Clinical Trial
. 2022 Dec;9(12):1863-1873.
doi: 10.1002/acn3.51649. Epub 2022 Nov 22.

Multiple sclerosis clinical decision support system based on projection to reference datasets

Affiliations
Clinical Trial

Multiple sclerosis clinical decision support system based on projection to reference datasets

Chadia Ed-Driouch et al. Ann Clin Transl Neurol. 2022 Dec.

Abstract

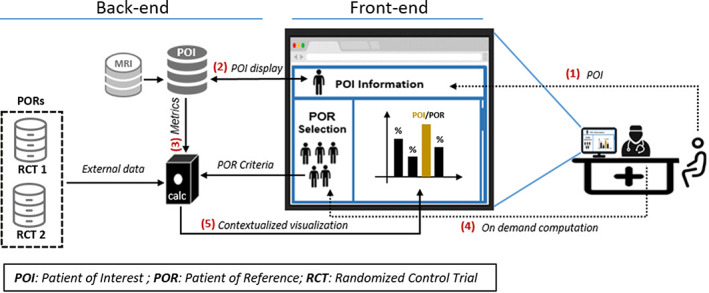
Objective: Multiple sclerosis (MS) is a multifactorial disease with increasingly complicated management. Our objective is to use on-demand computational power to address the challenges of dynamically managing MS.

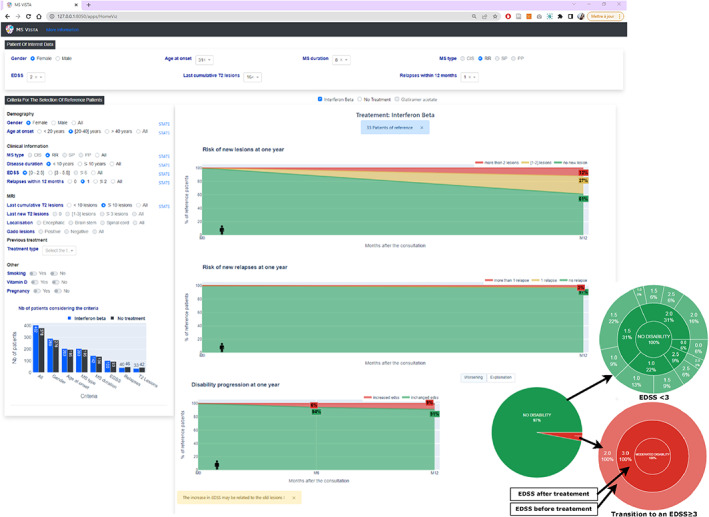
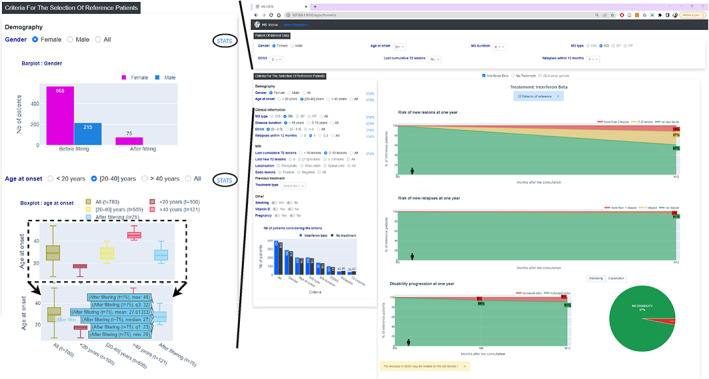
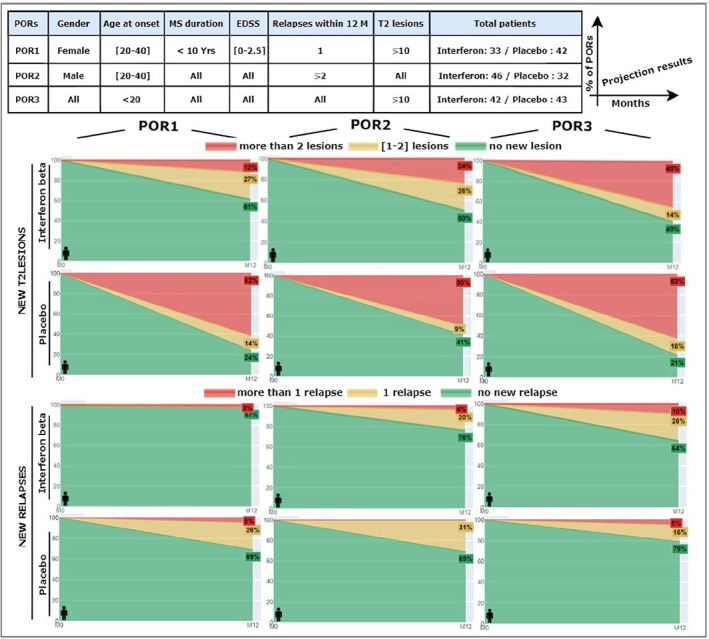
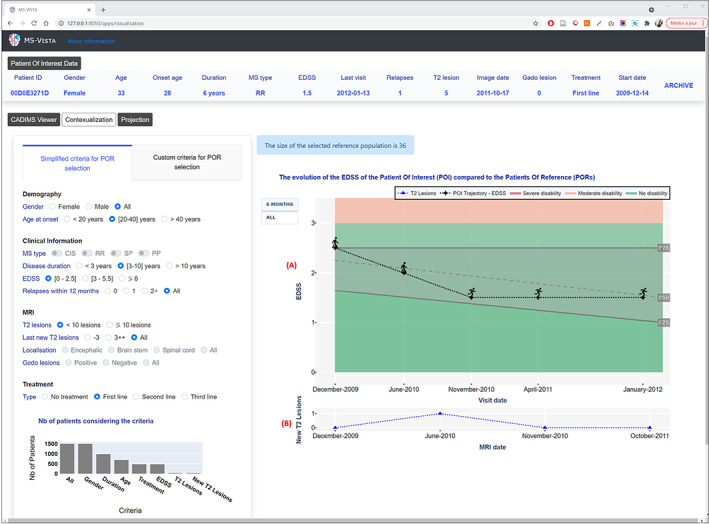
Methods: A phase 3 clinical trial data (NCT00906399) were used to contextualize the medication efficacy of peg-interferon beta-1a vs placebo on patients with relapsing-remitting MS (RRMS). Using a set of reference patients (PORs), selected based on adequate features similar to those of an individual patient, we visualize disease activity by measuring the percentage of relapses, accumulation of new T2 lesions on MRI, and worsening EDSS during the clinical trial.

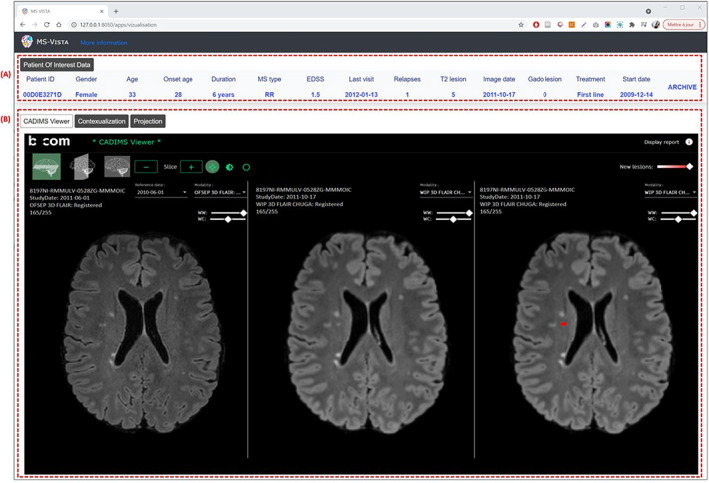
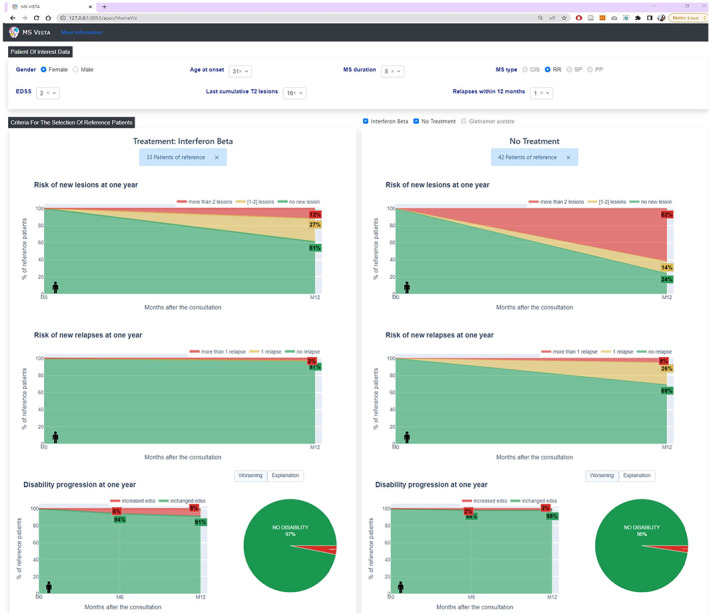
Results: We developed MS Vista, a functional prototype of clinical decision support system (CDSS), with a user-centered design and distributed infrastructure. MS Vista shows the medication efficacy of peginterferon beta-1a versus placebo for each individual patient with RRMS. In addition, MS Vista initiated the integration of a longitudinal magnetic resonance imaging (MRI) viewer and interactive dual physician-patient data display to facilitate communication.

Interpretation: The pioneer use of PORs for each individual patient enables personalized analytics sustaining the dialog between neurologists, patients and caregivers with quantified evidence.


Conflict of interest statement

Pierre‐Antoine Gourraud is the founder of MethodOmics (2008) (www.methodomics.com) and the co‐founder of Wedata (2018) (www.wedata.science). He consults for major pharmaceutical companies, all dealt with through academic pipelines (AstraZeneca, Biogen, Boston Scientific, Cook, Edimark, Ellipses, Elsevier, Methodomics, Merck, Mérieux, Sanofi‐Genzyme, WeData). PA Gourraud is board member at AXA mutual insurance company (2021). He has no prescription activity, drugs or devices;

David‐Axel Laplaud receives consulting fees from Alexion, Biogen, BMS, Merck, Novartis, Sanofi and Roche.

Figures

Figure 1
Figure 1
IT infrastructure supporting the MS Vista application. Adopting a user‐centric point of view: (1) Use of MS Vista starts with the POI ID. (2) If the POI ID exists in the POI's database, the data will be automatically displayed. Otherwise, the physician must select the POI's features. If the MRI images of the POI are available, the user can access them. (3) Depending on the POI's features, a first suggestion of the PORs criteria will be automatically defined, then the PORs data will be selected. (4) The physician can modify the PORs selection criteria. Once the PORs are selected, computations will be performed, (5) then the graphs of the obtained results will be displayed.
Figure 2
Figure 2
MS Vista presents a 360° view of MS patient data, including MRI. Wireframe of CADIMS integration in MS Vista: (A) POI's data features for clinical description. (B) Longitudinal MRI viewer, CADIMS. The CADIMS MRI viewer consists of three synchronized views displayed from left to right: baseline scan, follow‐up scan and follow‐up scan with segmented new lesions highlighted in red.
Figure 3
Figure 3
MS Vista provides temporal visualization of PORs data projections. MS Vista displays interactive graphs demonstrating the probability of worsening at 1 year of the gold standard of therapeutic control indicators of MS activity (new relapses, new MRI lesions, and EDSS) based on PORs data projection. The pie chart provides a dual visualization mode of the EDSS worsening to simplify understanding the outcomes and allow the physician to decide whether the information is sufficient to make a decision. The first view level shows the percentage by which the disability will worsen (the transition from EDSS<3 to an EDSS≥3 24 ) in 1 year. The second view level displays the number of patients corresponding to each EDSS, with more details to provide a more precise visualization.
Figure 4
Figure 4
MS Vista displays descriptive statistics for factors used to select PORs. To allow the physician review the quality of the used data to contextualize the POI and decide whether it is conducive for clinical decision making, MS Vista displays descriptive statistics of the factors used to select PORs data, through interactive bar charts and boxplots.
Figure 5
Figure 5
MS Vista enriches physician‐patient communication about treatment options. MS Vista allows visualizing how different factors influence disease progression for each individual patient and contextualizing the medication efficacy of peginterferon beta‐1a versus placebo. Using data from PORs selected based on demographic, clinical, and MRI criteria (left panel of the interface) chosen according to POI data at a time‐point M0 (top panel), MS Vista displays disease activity (middle of the interface) through measurement of percentages of new relapses (0/1/>1), accumulation of new T2 lesions on MRI (0/[1,2]/>2), and worsening of EDSS (worsening / no worsening) over the clinical trial (1 year later ~ M0 + 12 Months).
Figure 6
Figure 6
The importance of patient contextualization to illustrate the individual benefits of each treatment option. Three different PORs (table above) were used to illustrate disease activity through percentages of new T2 lesions and new relapses at 1 year of the clinical trial. Differences in the projection results of the three used PORs demonstrate that different factors may contribute to disease progression and also show that the medication efficacy of peginterferon beta‐1a versus placebo may vary depending on patient features.
Figure 7
Figure 7
MS Vista presents the evolution of the EDSS of a POI over time. (A) POI's EDSS trajectory in the context of a PORs percentile distribution over MS duration. The POI is presented by a human icon that changes according to the EDSS value to be more illustrative for patients. Two views are available: the EDSS once every 6 months for clarity and all EDSSs saved for the patient for deeper analysis. (B) Curve of the POI's new T2 lesions at each MRI scan to help physicians decide whether the patient is progressing normally.

References

    1. Reich DS, Lucchinetti CF, Calabresi PA. Multiple sclerosis. N Engl J Med. 2018;378(2):169‐180. doi:10.1056/NEJMra1401483 - DOI - PMC - PubMed
    1. Wallin MT, Culpepper WJ, Campbell JD, et al. The prevalence of MS in the United States: a population‐based estimate using health claims data. Neurology. 2019;92(10):e1029‐e1040. doi:10.1212/WNL.0000000000007035 - DOI - PMC - PubMed
    1. Walton C, King R, Rechtman L, et al. Rising prevalence of multiple sclerosis worldwide: insights from the atlas of MS, third edition. Mult Scler Houndmills Basingstoke Engl. 2020;26(14):1816‐1821. doi:10.1177/1352458520970841 - DOI - PMC - PubMed
    1. Kotelnikova E, Kiani NA, Abad E, et al. Dynamics and heterogeneity of brain damage in multiple sclerosis. PLoS Comput Biol. 2017;13(10):e1005757. doi:10.1371/journal.pcbi.1005757 - DOI - PMC - PubMed
    1. Eshaghi A, Young A, Wijertane P, et al. Defining multiple sclerosis subtypes using machine learning. medRxiv. 2020;19011080. doi:10.1101/19011080 - DOI

Publication types

MeSH terms

Substances