

Oxidative Stress and Its Modulation by Ladostigil Alter the Expression of Abundant Long Non-Coding RNAs in SH-SY5Y Cells
- PMID: 36412908
- PMCID: PMC9680243
- DOI: 10.3390/ncrna8060072
Oxidative Stress and Its Modulation by Ladostigil Alter the Expression of Abundant Long Non-Coding RNAs in SH-SY5Y Cells
Abstract
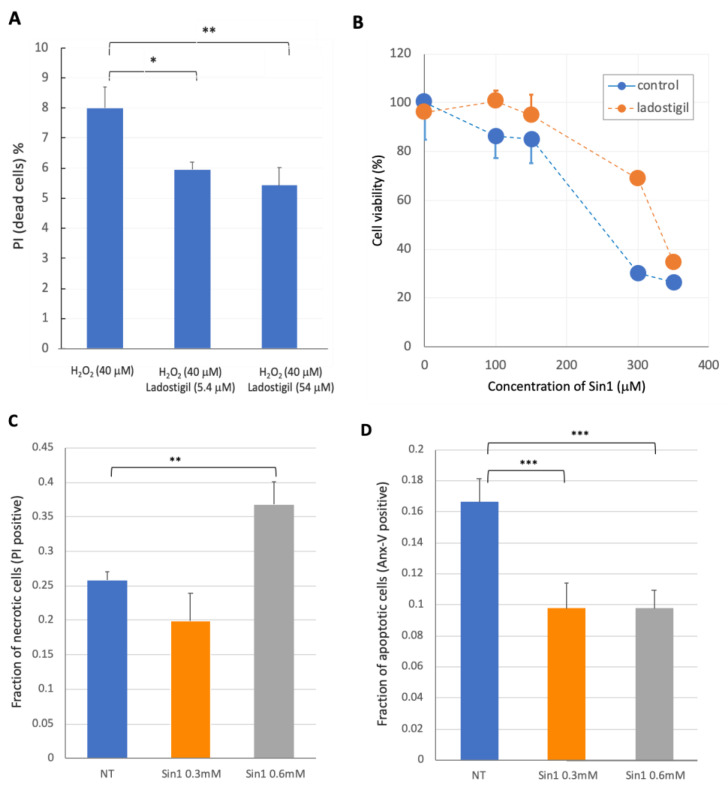
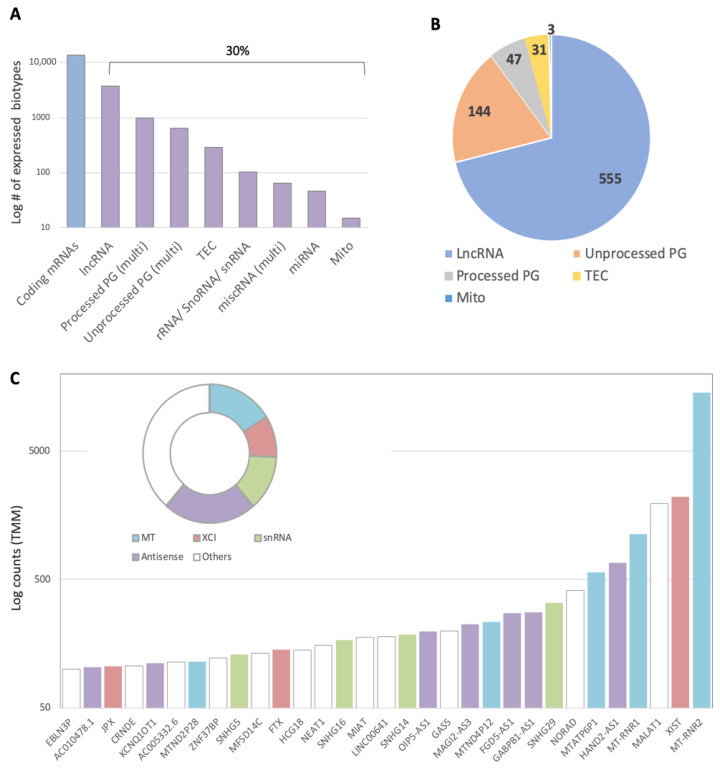
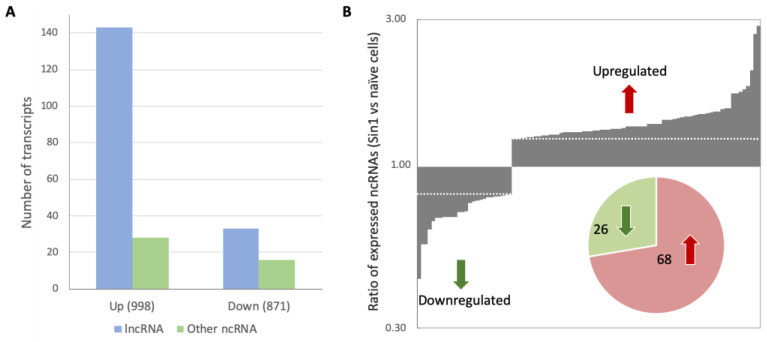
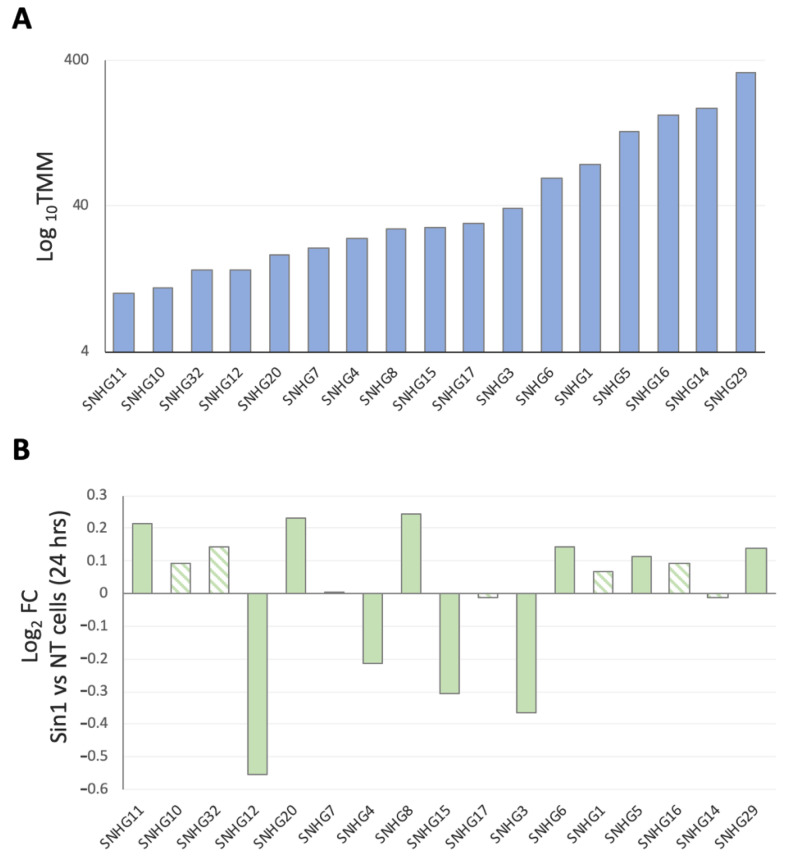
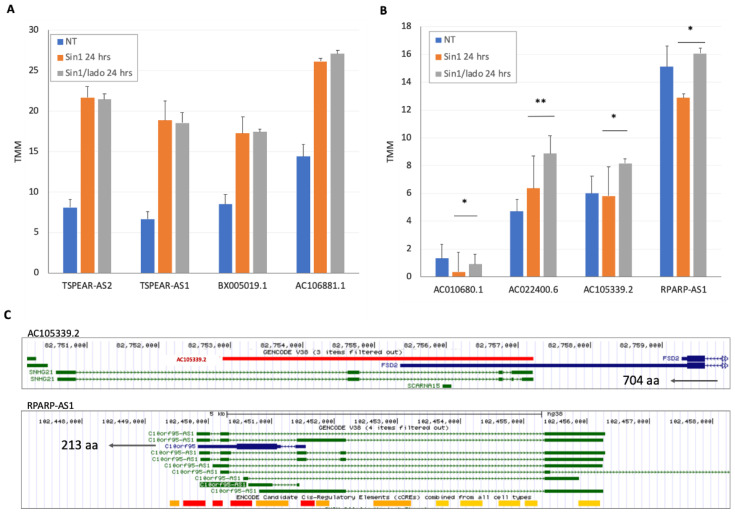
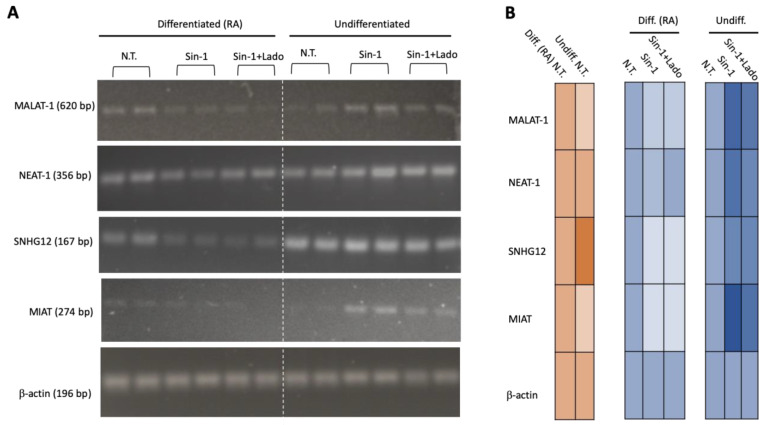
Neurodegenerative disorders, brain injury, and the decline in cognitive function with aging are accompanied by a reduced capacity of cells in the brain to cope with oxidative stress and inflammation. In this study, we focused on the response to oxidative stress in SH-SY5Y, a human neuroblastoma cell line. We monitored the viability of the cells in the presence of oxidative stress. Such stress was induced by hydrogen peroxide or by Sin1 (3-morpholinosydnonimine) that generates reactive oxygen and nitrogen species (ROS and RNS). Both stressors caused significant cell death. Our results from the RNA-seq experiments show that SH-SY5Y cells treated with Sin1 for 24 h resulted in 94 differently expressed long non-coding RNAs (lncRNAs), including many abundant ones. Among the abundant lncRNAs that were upregulated by exposing the cells to Sin1 were those implicated in redox homeostasis, energy metabolism, and neurodegenerative diseases (e.g., MALAT1, MIAT, GABPB1-AS1, NEAT1, MIAT, GABPB1-AS1, and HAND2-AS1). Another group of abundant lncRNAs that were significantly altered under oxidative stress included cancer-related SNHG family members. We tested the impact of ladostigil, a bifunctional reagent with antioxidant and anti-inflammatory properties, on the lncRNA expression levels. Ladostigil was previously shown to enhance learning and memory in the brains of elderly rats. In SH-SY5Y cells, several lncRNAs involved in transcription regulation and the chromatin structure were significantly induced by ladostigil. We anticipate that these poorly studied lncRNAs may act as enhancers (eRNA), regulating transcription and splicing, and in competition for miRNA binding (ceRNA). We found that the induction of abundant lncRNAs, such as MALAT1, NEAT-1, MIAT, and SHNG12, by the Sin1 oxidative stress paradigm specifies only the undifferentiated cell state. We conclude that a global alteration in the lncRNA profiles upon stress in SH-SY5Y may shift cell homeostasis and is an attractive in vitro system to characterize drugs that impact the redox state of the cells and their viability.
Keywords: MALAT1; Nrf2 signaling; RNA-seq; UPR; ceRNA; neurodegenerative disease.
Conflict of interest statement
The authors declare no conflict of interest.
Figures
Similar articles
-
Ladostigil Attenuates Induced Oxidative Stress in Human Neuroblast-like SH-SY5Y Cells.Biomedicines. 2021 Sep 17;9(9):1251. doi: 10.3390/biomedicines9091251. Biomedicines. 2021. PMID: 34572436 Free PMC article.
-
The novel cholinesterase-monoamine oxidase inhibitor and antioxidant, ladostigil, confers neuroprotection in neuroblastoma cells and aged rats.J Mol Neurosci. 2009 Feb;37(2):135-45. doi: 10.1007/s12031-008-9139-6. Epub 2008 Aug 27. J Mol Neurosci. 2009. PMID: 18751929
-
Circulating long non-coding RNAs NKILA, NEAT1, MALAT1, and MIAT expression and their association in type 2 diabetes mellitus.BMJ Open Diabetes Res Care. 2021 Jan;9(1):e001821. doi: 10.1136/bmjdrc-2020-001821. BMJ Open Diabetes Res Care. 2021. Retraction in: BMJ Open Diabetes Res Care. 2025 Jan 30;13(1):e001821.ret. doi: 10.1136/bmjdrc-2020-001821.ret. PMID: 33436407 Free PMC article. Retracted.
-
Long non-coding RNAs: From disease code to drug role.Acta Pharm Sin B. 2021 Feb;11(2):340-354. doi: 10.1016/j.apsb.2020.10.001. Epub 2020 Oct 10. Acta Pharm Sin B. 2021. PMID: 33643816 Free PMC article. Review.
-
The Long Non-Coding RNAs in Neurodegenerative Diseases: Novel Mechanisms of Pathogenesis.Curr Alzheimer Res. 2016;13(11):1219-1231. doi: 10.2174/1567205013666160622112234. Curr Alzheimer Res. 2016. PMID: 27338628 Review.
Cited by
-
Conceptual Framework of the Design of Pleiotropic Drugs against Alzheimer's Disease.Pharmaceutics. 2023 Sep 26;15(10):2382. doi: 10.3390/pharmaceutics15102382. Pharmaceutics. 2023. PMID: 37896142 Free PMC article. Review.
-
Silencing lncRNA GABPB1-AS1 alleviates cerebral ischemia reperfusion injury through the miR-641/NUCKS1 axis.Am J Transl Res. 2024 Jul 15;16(7):2963-2972. doi: 10.62347/EAGK7098. eCollection 2024. Am J Transl Res. 2024. PMID: 39114718 Free PMC article.
-
Knockdown of DJ-1 Resulted in a Coordinated Activation of the Innate Immune Antiviral Response in HEK293 Cell Line.Int J Mol Sci. 2024 Jul 10;25(14):7550. doi: 10.3390/ijms25147550. Int J Mol Sci. 2024. PMID: 39062793 Free PMC article.
-
The multifaceted perspectives on the regulation of lncRNAs in hepatocellular carcinoma ferroptosis: from bench-to-bedside.Clin Exp Med. 2024 Jul 3;24(1):146. doi: 10.1007/s10238-024-01418-9. Clin Exp Med. 2024. PMID: 38960924 Free PMC article. Review.
References
Grants and funding
LinkOut - more resources
Full Text Sources
