Is There Evidence of P-Hacking in Imaging Research?
- PMID: 36412994
- PMCID: PMC10338063
- DOI: 10.1177/08465371221139418
Is There Evidence of P-Hacking in Imaging Research?
Abstract
Background: P-hacking, the tendency to run selective analyses until they become significant, is prevalent in many scientific disciplines.
Purpose: This study aims to assess if p-hacking exists in imaging research.
Methods: Protocol, data, and code available here https://osf.io/xz9ku/?view_only=a9f7c2d841684cb7a3616f567db273fa. We searched imaging journals Ovid MEDLINE from 1972 to 2021. Text mining using Python script was used to collect metadata: journal, publication year, title, abstract, and P-values from abstracts. One P-value was randomly sampled per abstract. We assessed for evidence of p-hacking using a p-curve, by evaluating for a concentration of P-values just below .05. We conducted a one-tailed binomial test (α = .05 level of significance) to assess whether there were more P-values falling in the upper range (e.g., .045 < P < .05) than in the lower range (e.g., .04 < P < .045). To assess variation in results introduced by our random sampling of a single P-value per abstract, we repeated the random sampling process 1000 times and pooled results across the samples. Analysis was done (divided into 10-year periods) to determine if p-hacking practices evolved over time.
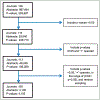
Results: Our search of 136 journals identified 967,981 abstracts. Text mining identified 293,687 P-values, and a total of 4105 randomly sampled P-values were included in the p-hacking analysis. The number of journals and abstracts that were included in the analysis as a fraction and percentage of the total number was, respectively, 108/136 (80%) and 4105/967,981 (.4%). P-values did not concentrate just under .05; in fact, there were more P-values falling in the lower range (e.g., .04 < P < .045) than falling just below .05 (e.g., .045 < P < .05), indicating lack of evidence for p-hacking. Time trend analysis did not identify p-hacking in any of the five 10-year periods.
Conclusion: We did not identify evidence of p-hacking in abstracts published in over 100 imaging journals since 1972. These analyses cannot detect all forms of p-hacking, and other forms of bias may exist in imaging research such as publication bias and selective outcome reporting.
Keywords: epidemiology; Evidence-Based Practice; Reporting Bias; statistics.
Conflict of interest statement
Declaration of Conflicting Interests
The author(s) declared no potential conflicts of interest with respect to the research, authorship, and/or publication of this article.
Figures


References
-
- Rosenthal R The file drawer problem and tolerance for null results. Psychol Bull. 1979;86(3):638–641.
-
- Mathur M Sensitivity Analysis for P-Hacking in Meta-Analyses. OSF Preprints; 2022. https://osf.io/ezjsx/
-
- Simonsohn U, Nelson LD, Simmons JP. P-curve: a key to the file-drawer. J Exp Psychol Gen. 2014;143(2):534–547. - PubMed
MeSH terms
Grants and funding
LinkOut - more resources
Full Text Sources
Medical

