

Recent Trends in the Incidence of Gastric Cancer in the United States
- PMID: 36413030
- PMCID: PMC10199958
- DOI: 10.1097/MCG.0000000000001811
Recent Trends in the Incidence of Gastric Cancer in the United States
Abstract
Background: Gastric cancer (GC) incidence rates overall in the United States have declined over recent decades and are predicted to continue declining. However, there have been mixed recent findings regarding the potential stabilization of rates and potential divergent trends by age group. We used the most recent cancer data for the United States and examined trends in GC between 1992 and 2019, overall and in important subgroups of the population.
Methods: Age-adjusted GC incidence rates and trends in adults 20 years or older were calculated using data from the Surveillance, Epidemiology, and End Results (SEER) 12 program. Secular trends were examined overall and by age group, sex, race/ethnicity, SEER registry, and tumor location. We used joinpoint regression to compute annual percent changes, average annual percent changes, and associated 95% CI.
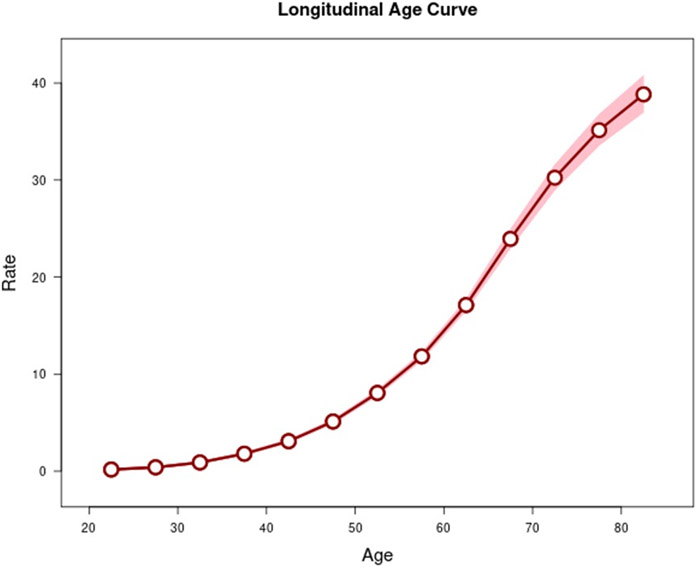
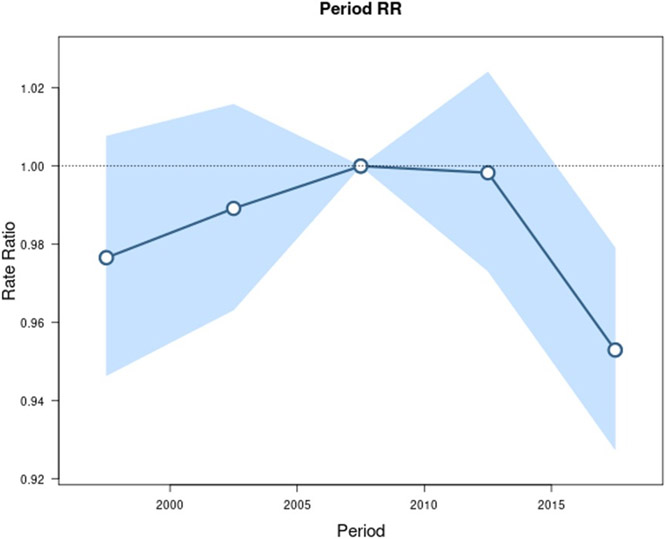
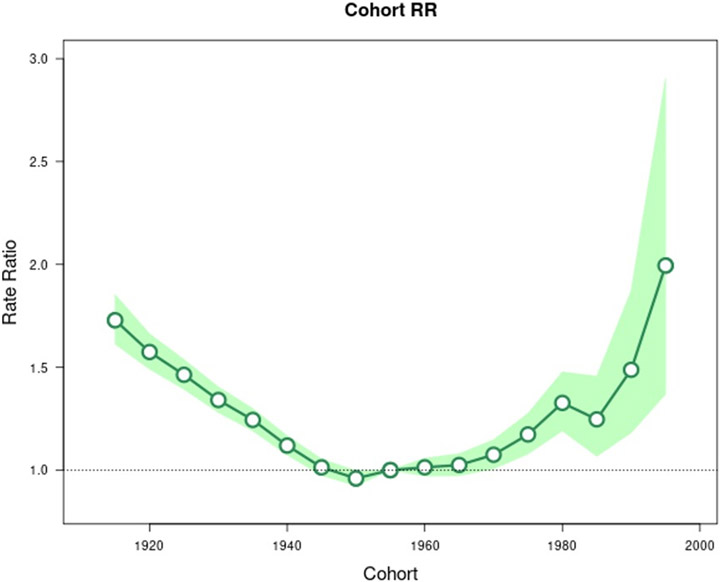
Results: GC rates decreased by 1.23% annually from 1992 to 2019. Despite overall decreases, GC incidence rates increased for age groups below 50 years, predominately driven by noncardia GC (74.3% of all GCs). Cardia GC (26.7% of GC) rates decreased in all age groups except for 80 to 84 years. Overall GC rates decreased for both sexes, all races, and for all SEER registry regions, with the largest decreases occurring in males, Asians and Pacific Islanders, and in Hawaii. Age-period-cohort analysis revealed that birth cohorts before 1940 and after 1980 both had increased rates of GC compared with the reference birth cohort of 1955.
Conclusion: GC rates overall have continued to decline through 2019, despite increases in the rate of noncardia GC for younger age groups.
Copyright © 2022 Wolters Kluwer Health, Inc. All rights reserved.
Conflict of interest statement
Figures
References
-
- Karimi Parisa et al. “Gastric cancer: descriptive epidemiology, risk factors, screening, and prevention.” Cancer epidemiology, biomarkers & prevention : a publication of the American Association for Cancer Research, cosponsored by the American Society of Preventive Oncology vol. 23,5 (2014): 700–13. doi:10.1158/1055-9965.EPI-13-1057 - DOI - PMC - PubMed
-
- SEER. Surveillance, Epidemiology, and End Results (SEER) Program (www.seer.cancer.gov) SEER*Stat Database: Incidence - SEER Research Data, 12 Registries, Nov 2021 Sub (1992-2019) - Linked To County Attributes - Time Dependent (1990-2019) Income/Rurality, 1969-2020 Counties, National Cancer Institute, DCCPS, Surveillance Research Program, released April 2022, based on the November 2021 submission. 2021.
Publication types
MeSH terms
Grants and funding
LinkOut - more resources
Full Text Sources
Medical
Miscellaneous
