. 2022 Dec 8;126(48):9108-9113.
doi: 10.1021/acs.jpca.2c06858. Epub 2022 Nov 22.

Analysis of Small-Molecule Mixtures by Super-Resolved 1H NMR Spectroscopy

Affiliations

Analysis of Small-Molecule Mixtures by Super-Resolved 1H NMR Spectroscopy

Aritro Sinha Roy et al. J Phys Chem A. .

Abstract

Analysis of small molecules is essential to metabolomics, natural products, drug discovery, food technology, and many other areas of interest. Current barriers preclude from identifying the constituent molecules in a mixture as overlapping clusters of NMR lines pose a major challenge in resolving signature frequencies for individual molecules. While homonuclear decoupling techniques produce much simplified pure shift spectra, they often affect sensitivity. Conversion of typical NMR spectra to pure shift spectra by signal processing without a priori knowledge about the coupling patterns is essential for accurate analysis. We developed a super-resolved wavelet packet transform based 1H NMR spectroscopy that can be used in high-throughput studies to reliably decouple individual constituents of small molecule mixtures. We demonstrate the efficacy of the method on the model mixtures of saccharides and amino acids in the presence of significant noise.


Conflict of interest statement

The authors declare no competing financial interest.

Figures

Figure 1.
Figure 1.
Conversion of 1H NMR spectra to WPT shift spectra. Glutathione 1H NMR recorded at 500 MHz in H2O is shown in the left. In the first step, all multiplets in the spectrum are collapsed to singlets in the approximation component (blue boxed) at WPT decomposition level K. The peaks are separated from artifacts (yellow circles) of WPT in the second step. The peak positions (blue colored triangles) and heights are used to produce the stick spectrum. The maximum intensity of the original NMR spectrum was ~1, and the maximum intensities of each of the components are printed next to the spectra in blue for comparison.
Figure 2.
Figure 2.
Conversions of 1H NMR spectra of cellobiose, fructose, and sucrose to WPT shift spectra. The WPT shift spectra were produced from the approximation components at levels 7 (A), 7 (B), and 8 (C) of wavelet decomposition of the respective NMR spectra by using Db9 wavelet.
Figure 3.
Figure 3.
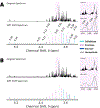
Analysis of model mixtures of cellobiose, fructose, and sucrose using Db9 wavelet at a wavelet decomposition level of 8 are illustrated for the noise-free (A) and noisy (B) data sets. The resolved peaks corresponding to cellobiose (light blue), fructose (violet), and sucrose (navy) are color-coded, while the line at 3.81 ppm is marked unresolved (gray). Analysis of the spectral slice between 3.78 and 3.94 ppm at a decomposition level of 7 resolved the peaks at 3.83 ppm (cellobiose), 3.87 ppm (sucrose) and 3.90 ppm (fructose).
Figure 4.
Figure 4.
Analysis of the NMR spectra of two different compositions of model mixture (II) of six amino acids at 10% noise are illustrated. Conversion of the NMR spectra using Db9 wavelet at a decomposition level of 8 are shown (A, B). The peaks corresponding to glutamine (red), glycine (blue), isoleucine (green), leucine (orange), threonine (cyan), and valine (magenta) were resolved in both the WPT shift spectra. The compositions of the mixtures and the resolved lines in the WPT shift spectra are tabulated on the left.

References

    1. Worley B; Powers R. Multivariate analysis in metabolomics. Curr. Metabolomics 2012, 1, 92–107. - PMC - PubMed
    1. Idle JR; Gonzalez FJ Metabolomics. Cell Metabolism 2007, 6, 348–351. - PMC - PubMed
    1. Pellecchia M; Sem DS; Wüthrich K. NMR in drug discovery. Nat. Rev. Drug Discovery 2002, 1, 211–219. - PubMed
    1. Softley CA; Bostock MJ; Popowicz GM; Sattler M. Paramagnetic NMR in drug discovery. Journal of Biomolecular NMR 2020, 74, 287–309. - PMC - PubMed
    1. Pauli GF; Jaki BU; Lankin DC Quantitative 1H NMR: Development and potential of a method for natural products analysis. J. Nat. Prod 2005, 68, 133–149. - PubMed

MeSH terms