. 2023 Jan 2;220(1):e20211938.
doi: 10.1084/jem.20211938. Epub 2022 Nov 22.

Intelectin-1 binds and alters the localization of the mucus barrier-modifying bacterium Akkermansia muciniphila

Affiliations

Intelectin-1 binds and alters the localization of the mucus barrier-modifying bacterium Akkermansia muciniphila

Juan D Matute et al. J Exp Med. .

Abstract

Intelectin-1 (ITLN1) is a lectin secreted by intestinal epithelial cells (IECs) and upregulated in human ulcerative colitis (UC). We investigated how ITLN1 production is regulated in IECs and the biological effects of ITLN1 at the host-microbiota interface using mouse models. Our data show that ITLN1 upregulation in IECs from UC patients is a consequence of activating the unfolded protein response. Analysis of microbes coated by ITLN1 in vivo revealed a restricted subset of microorganisms, including the mucolytic bacterium Akkermansia muciniphila. Mice overexpressing intestinal ITLN1 exhibited decreased inner colonic mucus layer thickness and closer apposition of A. muciniphila to the epithelial cell surface, similar to alterations reported in UC. The changes in the inner mucus layer were microbiota and A. muciniphila dependent and associated with enhanced sensitivity to chemically induced and T cell-mediated colitis. We conclude that by determining the localization of a select group of bacteria to the mucus layer, ITLN1 modifies this critical barrier. Together, these findings may explain the impact of ITLN1 dysregulation on UC pathogenesis.


Conflict of interest statement

Disclosures: G.M. Fuhler reported personal fees from Janssen and Galapagos during the conduct of the study. F. Tran reported personal fees from Abbvie, Janssen, and Falk outside the submitted work. J.R. White reported “other” from Resphera Biosciences LLC outside the submitted work. J.N. Glickman reported being an employee of PathAI, Inc. No other disclosures were reported.

Figures

None
Graphical abstract
Figure 1.
Figure 1.
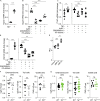
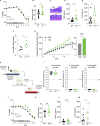
ITLN1 is increased in response to ER stress in intestinal epithelial cells. (A) ITLN1 expression level from bulk RNA-seq performed in colonic biopsies of healthy controls, patients with treatment-naive UC with colitis, or in remission from Taman et al. (2017) (n = 14–16). Boxes extend from the 25th to 75th percentile and whiskers from minimum to maximum value, and the line in the middle is the median. (B) Correlation between ITLN1 and UPR hallmark gene expression by bulk RNA-seq in Taman et al. (2017) (n = 44). Symbols represent individual human subjects. (C) Correlation between UPR hallmark genes and ITLN1 expression in goblet cells by scRNA-seq from Parikh et al. (2019) (n = 1,198 cells). Symbols represent individual epithelial cells. (D) ITLN staining in crypts from patients with CD that have GRP78 negative (−) or positive (+) staining of their crypts (n = 9–13). Left panel: Representative pictures from small intestine biopsies obtained from GRP78(−) patients and GRP78(+) patients (Deuring et al., 2014). Scale bars indicate 20 µm. Black arrows point to Paneth cells in the crypt. Right panel: Bars represent arithmetic means. Symbols represent individual human subjects. (E) Quantification of Itln1 transcripts by qPCR in mouse small intestinal organoids in the presence or absence of tunicamycin (TM; n = 6). Symbols represent individual biological replicates. Bars represent arithmetic means. Data were compiled from two independent experiments. (F) Quantification of Itln1 transcripts by qPCR in mouse small intestinal organoids after TM treatment alone or in the presence of 4μ8c, GSK2606414, or PF-429242 (n = 6–9). Symbols represent individual biological replicates. Bars represent arithmetic means. Data were compiled from two to three independent experiments. (G) Volcano plot showing log2-transformed fold-change of gene expression in crypts obtained by laser capture microscopy from GF Xbp1ΔIEC mice compared with crypts obtained by laser capture microscopy from GF Xbp1fl/fl controls (n = 3–4). Symbols represent individual genes. (H) Itln1 transcripts by qPCR in intestinal organoids from wild-type and Atf6tg mice at baseline and after treatment with TM (n = 8). Symbols represent individual biological replicates. P values were calculated by Wald-test and corrected for multiple testing by the method of Benjamini and Hochberg (A); generalized linear model (B); generalized negative binomial linear model (C); unpaired T test (D, E, and H); one-way ANOVA corrected for multiple comparisons with Dunnet (F); and two-stage step-up method of Benjamini, Krieger, and Yekutieli to control the FDR (G). *P < 0.05; **P < 0.01; ***P < 0.001; ****P < 0.0001.
Figure S1.
Figure S1.
ITLN1 transcription is induced upon ER stress activation, and its absence or overexpression in intestinal epithelial cells does not affect colonic enteroendocrine cells, Tuft cells, and goblet cells. (A) Quantification of Hspa5 transcripts by qPCR in mouse small intestinal organoids in the presence or absence of tunicamycin (TM; n = 6). Symbols represent individual biological replicates. Bars represent arithmetic means. Data were compiled from two independent experiments. (B) Quantification of Hspa5 transcripts by qPCR in mouse small intestinal organoids after TM treatment alone or in the presence of 4μ8c, GSK2606414, or PF-429242 (n = 6–9). Symbols represent individual biological replicates. Bars represent arithmetic means. Data were compiled from two to three independent experiments. (C) ITLN1 transcripts after tunicamycin treatment alone (TM) or in the presence of 4μ8c, GSK2606414, or PF-429242 in Caco-2 cells (n = 9). Symbols represent biological replicate. Bars represent arithmetic means. Data were compiled from three independent experiments. (D) HSPA5 transcripts after tunicamycin treatment alone (TM) or in the presence of 4μ8c, GSK2606414, or PF-429242 in Caco-2 cells (n = 9). Symbols represent biological replicate. Bars represent arithmetic means. Data were compiled from three independent experiments. (E) Luciferase activity of ITLN1 promoter in HEK293 cells in relative luminescence units (RLU after transfection with XBP1s, XBP1u, or empty vector [control]; n = 4). Symbols represent biological replicate. Bars represent arithmetic means. Data were compiled from two independent experiments. (F) Quantification of enteroendocrine cells (Chromogranin A+ cells), Tuft cells (DCLK1+ cells), goblet cells (PAS+ cells) in the colon per crypt of Itln1−/− mice compared to wild-type littermates (wt; n = 8). wt = wild-type littermate from Itln1−/− colony. Symbols represent individual mice. (G) Quantification of enteroendocrine cells (Chromogranin A+ cells), Tuft cells (DCLK1+ cells), goblet cells (PAS+ cells) in the colon per crypt of TgVil-Itln1 mice compared to wild-type littermates (WT; n = 16). WT = wild-type littermate from TgVil1-Itln1 colony. Symbols represent individual mice. P values were calculated by unpaired T test (A, C, left panel, D, left panel, F, and G) or one-way ANOVA corrected for multiple comparisons with Dunnet (B, C, right panel, D right panel, and E). *P < 0.05; **P < 0.01; ***P < 0.001; ****P < 0.0001.
Figure 2.
Figure 2.
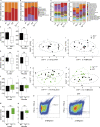
ITLN1 binds a subset of microbes in the intestinal lumen, particularly A. muciniphila. (A) Representative ITLN1 expression by immunohistochemistry in Itln1−/−, WT, and TgVil1-Itln1 mice (n = 3). Black arrows point to Paneth cells in the small intestinal crypt of WT mice. Scale bars indicate 100 μm. (B) Percentage of bacteria in stools (SYBRgreenhi) coated by ITLN1 in Itln1−/−, WT, and TgVil1-Itln1 mice with representative density plots gated in SYBRgreenhi (see Fig. S3 Q; n = 10–12). Symbols represent individual mice. Bars represent the arithmetic mean. Data were compiled from three independent experiments. (C) Principal coordinates analysis (Bray–Curtis dissimilarity) of bacterial communities in Itln1−/− and TgVil1-Itln1 stools before sorting, ITLN1 bound (ITLN1+) and ITLN1 unbound (ITLN1−) fraction post-sorting from TgVil1-Itln1 stools. n = 7 pooled stools from three mice per genotype. Experiment 1 pooled from same three mice on different days. Experiment 2 pooled stools from different three mice on different days. Symbols represent experiments performed on different days. (D) Differential microbial composition of ITLN1+ and ITLN1− fractions. The graph depicts the average log2 ratio of relative abundances between ITLN1+ and ITLN1− fractions for each order on the x axis, the corresponding P-adjusted value on the y axis, and the relative abundance in the ITLN1+ fraction depicted by the color bar. n = 7 pooled stools from three mice per genotype per replicate. Experiment 1 pooled stools from the same three mice on different days. Experiment 2 pooled stools from three different mice on different days. (E) Representative histogram showing binding of human recombinant ITLN1 to A. muciniphila isolated from humans in orange, negative control in blue (Streptococcus pneumoniae Serotype 8), and positive control in purple (Streptococcus pneumoniae Serotype 43; n = 3). P values were calculated by one-way ANOVA corrected for multiple comparisons with Dunnet (B); PERMANOVA among ITLN1− and ITLN1+ fraction (C); Welch’s t test with log-transformed values in a generalized linear model adjusting for the paired design and two-stage step-up method of Benjamini, Krieger, and Yekutieli to control the FDR (D). *P < 0.05; ****P < 0.0001.
Figure S2.
Figure S2.
Baseline characterization of LP leukocytes in the Itln1−/− and TgVil-Itln1 mice. (A) Quantification of leukocytes in colonic LP of Itln1−/− mice compared to wt littermates (n = 11–19). Data were compiled from three independent experiments for the left and right panels and two independent experiments for the middle panel. Symbols represent individual mice. (B) Quantification of leukocytes in colonic LP of TgVil1-Itln1 mice compared to WT littermates (n = 6–11). Data were compiled from two independent experiments for the left and middle panels. Symbols represent individual mice. (C) Gating strategy for LP neutrophils and eosinophils in A and B. (D) Gating strategy for LP CD4+ T cells, CD8+ T cells, and B cells in A and B. (E) Gating strategy for innate lymphocytes (ILC) 1, 2, and 3 in A and B. Lin = CD3+, CD5+,CD19+, and LY6G+. (F) Gating strategy for natural killer cells (NK) in A and B. Lin = CD3+, CD5+, CD19+, and LY6G+. (G) Gating strategies for LP dendritic cells (DC) in A and B. Lin = CD3+, NK1.1+, CD19+, Ly6G+, and SiglecF+. (H) Gating strategies for LP macrophages in A and B. P1, P2, P3, and P5 macrophages correspond to macrophage subpopulations as described in Tamoutounour et al. (2012). Lin = CD3+, NK1.1+, CD19+, Ly6G+, and SiglecF+.
Figure S3.
Figure S3.
Baseline characterization of the microbiota of Itln1−/− and TgVil-Itln1 mice. (A) Stacked bars represent the aggregated total community composition at the phyla level in the large intestinal lumen of Itln1−/− mice and their wild-type littermates (wt; n = 14) and TgVil1-Itln1 mice and their wild-type littermates (WT; n = 13 or 14). (B) Stacked bars represent the aggregated total community composition at the phyla level in the colonic mucosa of Itln1−/− mice and their wild-type littermates (wt; n = 14) and TgVil1-Itln1 mice compared to wild-type littermates (WT; n = 12). (C) Stacked bars represent the aggregated total community composition at the family level in the large intestinal lumen of Itln1−/− mice and their wild-type littermates (wt; n = 14) and TgVil1-Itln1 mice compared to wild-type littermates (WT; n = 13 or 14). (D) Stacked bars represent the aggregated total community composition at the family level in the colonic mucosa of Itln1−/− mice and their wild-type littermates (wt; n = 14) and TgVil1-Itln1 mice compared to wild-type littermates (WT; n = 12). (E) Chao1 index for Itln1−/− mice compared to wild-type littermates (wt) in the large intestinal lumen (n = 14). (F) Chao1 index for Itln1−/− mice compared to wild-type littermates (wt) in the colonic mucosa (n = 14). (G) Shannon index for Itln1−/− mice compared to wild-type littermates (wt) in the large intestinal lumen (n = 14). (H) Shannon index for Itln1−/− mice compared to wild-type littermates (wt) in the colonic mucosa (n = 14). (I) Beta diversity of the microbiota composition of the large intestinal lumen by Bray–Curtis dissimilarity in Itln1−/− mice compared to wild-type littermates (wt; n = 14). Symbols represent individual mice. (J) Beta diversity of the microbiota composition of the colonic mucosa by Bray–Curtis dissimilarity in Itln1−/− mice compared to wild-type littermates (wt; n = 14). Symbols represent individual mice. (K) Chao1 index for TgVil1-Itln1 mice compared to wild-type littermates (WT) in the large intestinal lumen (n = 13 or 14). (L) Chao1 index for TgVil1-Itln1 mice compared to wild-type littermates (WT) in the colonic mucosa (n = 12). (M) Shannon index for TgVil1-Itln1 mice compared to wild-type littermates (WT) in the large intestinal lumen (n = 13 or 14). (N) Shannon index for TgVil1-Itln1 mice compared to wild-type littermates (WT) in the colonic mucosa (n = 12). (O) Beta diversity of the microbiota composition of the large intestinal lumen by Bray–Curtis dissimilarity in TgVil1-Itln1 mice compared to wild-type littermates (WT; n = 13 or 14). Symbols represent individual mice. (P) Beta diversity of the microbiota composition of the colonic mucosa by Bray–Curtis dissimilarity in TgVil1-Itln1 mice compared to wild-type littermates (WT; n = 12). Symbols represent individual mice. (Q) Bacteria gating strategy for ITLN1-seq. Stool bacteria were identified as SYBRgreen high (SYBRgreenhi) particles in SPF mice that were not present in GF mice. In the SYBRgreenhi fraction, we quantified the fraction of ITLN1(+) bacteria identified with a PE-conjugated ITLN1 antibody, as depicted in Fig. 2 B. P values for the alpha diversity (Chao1 and Shannon index) were calculated using a linear mixed model by regressing the alpha diversity value against the “genotype” with gender as a fixed effect and litter as a random effect (ns: P > 0.05). CAP1 and CAP2 are the first two axes from the constrained analysis of principal coordinates with the respective amount of variation in Bray–Curtis dissimilarity explained between brackets. For Bray–Curtis dissimilarity, P obtained by the anova.cca test with respect to the genotype with 10,000 permutations (*P < 0.05). WT = wild-type littermate from TgVil1-Itln1 colony. wt = wild-type littermate from Itln1−/− colony.
Figure S4.
Figure S4.
A muciniphila binding to ITLN1 in vitro, A. muciniphila quantification by qPCR, and methacarn and methacrylate fixed tissue imaging. (A) Representative histogram showing binding of recombinant ITLN1 to A. muciniphila isolated from TgVil-Itln1 mice in orange, negative control in green (Streptococcus pneumoniae serotype 8), and positive control in red (Streptococcus pneumoniae serotype 43; n = 9). (B) Absolute abundance of A. muciniphila in Itln1−/− mice compared to wild-type littermates by qPCR in stools and colon mucosa (n = 8–11). Symbols represent individual mice. Bars represent arithmetic means. Dotted lines represent the level of detection (LOD). (C) Absolute abundance of A. muciniphila in TgVil1-Itln1 mice compared to wild-type littermates by qPCR in stools and colon mucosa (n = 8). Symbols represent individual mice. Bars represent arithmetic means. Dotted lines represent the LOD. (D) Quantification of Muc2 transcripts by qPCR in colonic biopsies of WT and TgVil1-Itln1 mice (n = 6). Symbols represent individual mice. Bars represent arithmetic means. (E) Absolute abundance of A. muciniphila in wt, Itln1−/−, and TgVil1-Itln1 mice in stools of ex-GF mice monocolonized by A. muciniphila compared to wild-type littermates by qPCR from Fig. 3, H and I (n = 4). Symbols represent individual mice. Bars represent arithmetic means. (F) Representative fluorescent images obtained after methacarn fixation and combined immunofluorescence (IF) and FISH showing A. muciniphila signal in the colonic inner mucus layer of ex-GF monocolonized Itln1−/−, WT, and TgVil1-Itln1 mice from Fig. 3, H and I (n = 4). For each genotype, we present representative fluorescence merged images with pseudocoloring depicting the nuclei (DAPI = blue), the intestinal epithelial surface (γ-actin IF = gray), A. muciniphila (A. muciniphila probe FISH = A. muciniphila = red), and the mucus layer (Mucin-2 IF = MUC2 = green). (G) Representative fluorescence images obtained after methacrylate fixation and combined IF and FISH of distal colon from TgVil1-Itln1 mice and their respective wild-type littermates (WT) under SPF conditions. For each genotype, we present representative grayscale images depicting the nuclei and epithelial cell autofluorescence (DAPI), ITLN1, intestinal microbiota (Eubacteria probes FISH = Eubacteria), and the mucus layer (FITC labeled WGA) and merged image with pseudo coloring (DAPI = blue, ITLN1 = yellow, Eubacteria = magenta, WGA = green). The inner mucus layer was characterized by a well-organized stratified WGA lamellar appearance between white arrowheads in the merged image. The dashed line represents the apical epithelial edge identified by DAPI autofluorescence. Scale bars indicate 10 µm. (H) Inner mucus thickness was measured between white arrowheads in G as described by Earle et al. (2015). 143–144 independent measurements 50 μm apart were obtained from four different mice per genotype (n = 4). Mean and SD were determined from the average measurements for each mouse. Each dot represents the mean value of measurements per mouse. Error bars represent the SD. (I) Representative fluorescence images obtained after methacrylate fixation and combined IF and FISH of distal colon from Itln1−/− mice and their respective wild-type littermates (wt) under SPF conditions. For each genotype, we present representative grayscale images depicting the nuclei and epithelial cell autofluorescence (DAPI), ITLN1, intestinal microbiota (Eubacteria probes FISH = Eubacteria), and the mucus layer (FITC labeled WGA) and merged image with pseudo coloring (DAPI = blue, ITLN1 = yellow, Eubacteria = magenta, WGA = green). The inner mucus layer was characterized by a well-organized stratified WGA lamellar appearance between white arrowheads in the merged image. The dashed line represents the apical epithelial edge identified by DAPI autofluorescence. Scale bars indicate 10 µm. (J) Inner mucus thickness was measured between white arrowheads in I as described by Earle et al. (2015). 144 independent measurements 50 μm apart were obtained from four different mice per genotype (n = 4). Mean and SD were determined from the average measurements for each mouse. Each dot represents the mean value of measurements per mouse. Error bars represent the SD. (K) Proximity analysis of the overall bacterial distribution (Eubacteria) and distribution of A. muciniphila in the inner mucus layer in methacrylate fixed tissues (n = 4). Distances relative to the epithelial-facing edge of the mucus layer. Higher/lower pair correlation values indicate a relative attraction/repulsion to the mucus edge close to the epithelium. The average pair correlation value for each distance point was calculated from average measurements for each mouse (3 fields of view/section × 3 sections/animal × 4 animals/genotype = 36 fields of view per genotype). The error bar for each distance point represents the 95% confidence interval. (L) Proximity analysis of the overall bacterial distribution (Eubacteria) and distribution of A. muciniphila with respect to the mucus layer in methacrylate fixed tissues. Distances relative to the epithelial-facing edge of the mucus layer. Higher/lower pair correlation values indicate a relative attraction/repulsion to the mucus edge close to the epithelium. The average pair correlation value for each distance point was calculated from average measurements for each mouse (3 fields of view/section × 3 sections/animal × 4 animals/genotype = 36 fields of view per genotype). The error bar for each distance point represents the 95% confidence interval. WT = wild-type littermate from TgVil1-Itln1 colony. wt = wild-type littermate from Itln1−/− colony. P values were calculated by unpaired T test (B–D, H, J, and K) or one-way ANOVA with Dunnet (E). *P < 0.05.
Figure 3.
Figure 3.
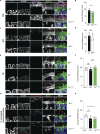
ITLN1 affects the inner mucus layer thickness in a microbiota-dependent manner. (A) Representative fluorescence images obtained after methacarn fixation and combined immunofluorescence (IF) and FISH of the distal colon from TgVil1-Itln1 mice and their respective wild-type littermates (WT) under SPF conditions. For each genotype, we present representative grayscale images depicting the nuclei (DAPI), the intestinal epithelial surface (γ-actin IF = γ-actin), the intestinal microbiota (Eubacteria probes FISH = Eubacteria), and the mucus layer (Mucin-2 IF = MUC2) and merged image with pseudo coloring (DAPI = blue, γ-actin = gray, Eubacteria = magenta, MUC2 = green). The inner mucus layer was characterized by a well-organized stratified MUC2 lamellar appearance between the epithelium and the bacterial biomass in the merged image (between white arrowheads). Scale bars indicate 20 µm. (B) Inner mucus thickness was measured between white arrowheads in A as described by Earle et al. (2015). 288 independent measurements 50 μm apart were obtained from four different mice per genotype (n = 4). Mean and SD were determined from the average measurements for each mouse. Each dot represents the mean value of measurements per mouse. Error bars represent the SD. (C) Representative fluorescence images were obtained after methacarn fixation and combined IF and FISH of distal colon from Itln1−/− mice and their respective wild-type littermates (wt) under SPF conditions. For each genotype, we present representative fluorescence images depicting the nuclei (DAPI), the intestinal epithelial surface (γ-actin IF = γ-actin), intestinal microbiota (Eubacteria probes FISH = Eubacteria), and the mucus layer (Mucin-2 IF = MUC2) and merged images with pseudo coloring (DAPI = blue, γ-actin = gray, Eubacteria = magenta, MUC2 = green). The inner mucus layer was characterized by a well-organized stratified MUC2 lamellar appearance between the epithelium and the bacterial biomass in the merged image (between white arrowheads). Scale bars indicate 20 µm. (D) Inner mucus thickness was measured between white arrowheads in C as described by Earle et al. (2015). 276–284 independent measurements 50 μm apart were obtained from four different mice per genotype (n = 4). Mean and SD were determined from the average measurements for each mouse. Each dot represents the mean value of measurements per mouse. Error bars represent the SD. (E) Representative fluorescence images obtained after methacarn fixation and combined IF and FISH of distal colon from GF wild-type, Itln1−/−, and TgVil1-Itln1 mice. For each genotype, we present representative fluorescence images depicting the nuclei (DAPI), the intestinal epithelial surface (γ-actin IF = γ-actin), intestinal microbiota (Eubacteria probes FISH = Eubacteria), and the mucus layer (Mucin-2 IF = MUC2) and merged images with pseudo coloring (DAPI = blue, γ-actin = gray, Eubacteria = magenta, MUC2 = green). The inner mucus layer was characterized by a well-organized stratified MUC2 lamellar appearance above the epithelium (between white arrowheads). Scale bars indicate 20 µm. (F) Inner mucus thickness was measured between white arrowheads in E as described by Earle et al. (2015). 244–276 independent measurements 50 μm apart were obtained from four different mice per genotype (n = 4). Mean and SD were determined from the average measurements for each mouse. Each dot represents the mean value of measurements per mouse. Error bars represent the SD. (G) Representative fluorescence images obtained after methacarn fixation and combined IF and FISH of distal colon from GF wild-type, Itln1−/−, and TgVil1-Itln1 mice monocolonized with A. muciniphila. For each genotype, we present representative fluorescence images depicting the nuclei (DAPI), the intestinal epithelial surface (γ-actin IF = γ-actin), A. muciniphila (A. muciniphila probe FISH = A. muciniphila), and the mucus layer (Mucin-2 IF = MUC2) and merged images with pseudo coloring (DAPI = blue, γ-actin = gray, A. muciniphila = red, mucus layer = green). The inner mucus layer was characterized by a well-organized stratified MUC2 lamellar appearance between the epithelium and the bacterial biomass in the merged image (between white arrowheads). Scale bars indicate 20 µm. (H) Inner mucus thickness was measured between white arrowheads in G as described by Earle et al. (2015). 244–276 independent measurements 50 μm apart were obtained from four different mice per genotype (n = 4). Mean and SD were determined from the average measurements for each mouse. Each dot represents the mean value of measurements per mouse. Error bars represent the SD. WT = wild-type littermate from TgVil1-Itln1 colony. wt = wild-type littermate from Itln1−/− colony. P values were calculated by unpaired T test (B and D) and one-way ANOVA corrected for multiple comparisons with Dunnet (F and H). *P < 0.05.
Figure S5.
Figure S5.
ITLN1 over expression worsens colitis in DSS-induced and naive T transfer-induced colitis model. (A) Weight loss after exposure to DSS for 7 and 2 d of water (DSS colitis) in Itln1−/− mice and wild-type littermates (WT; n = 34). Symbols represent means of baseline weight. Error bars represent SEs. Data were compiled from three independent experiments. (B) Histology score on day 8 or 9 following DSS colitis (n = 27 or 30). Symbols represent individual mice. Data were compiled from three independent experiments. (C) Representative micrograph of Itln1−/− and wt mice after DSS colitis. (D) Weight loss after DSS colitis in TgVil1-Itln1 mice and wild-type littermates (WT; n = 10–11) in a separate cohort of mice treated with DSS for the cytokines explant experiment in Fig. 4, D and E. Symbols represent means of baseline weight. Error bars represent SEs. Data were compiled from two independent experiments. (E) Quantification of macrophages in colonic LP from TgVil1-Itln1 mice compared to wild-type littermates during day 2 of DSS colitis (n = 10–11). (F) Transcription of IL-10, IL-6, and TNF in human monocyte-derived macrophages following incubation with uncoated (Akk) or ITLN1-coated A. muciniphila (Akk + ITLN1; n = 3–4 from two independent experiments). (G) Weight loss after transfer of naive T cells in TgVil1-Itln1 Rag1−/− and Rag1−/− littermates (n = 11). Symbols represent means of baseline weight. Error bars represent SEs. (H) Colonic weight to length ratio (Ostanin et al., 2008) 6 wk after transfer of naive T cells in TgVil1-Itln1 Rag1−/− and Rag1−/− littermates (n = 11). Symbols represent individual mice and bars represent the means. P values were calculated by unpaired T test with correction for multiple comparisons using Holm–Sidak in (A, D, and G) and unpaired T test in (B, E, F, and H). *P < 0.05; **P < 0.01; ***P < 0.001.
Figure 4.
Figure 4.
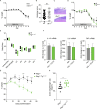
Overexpression of ITLN1 results in increased susceptibility to colitis ameliorated after clearance of A. muciniphila with tetracycline. (A) Weight loss after exposure to DSS for 7 and 2 d of water (DSS colitis) in TgVil1-Itln1 and wild-type littermates (WT; n = 19 or 22). Symbols represent means of baseline weight. Error bars represent SEs. Data were compiled from three independent experiments. (B) Histology score on day 9 following DSS colitis (n = 19 or 22). Symbols represent individual mice. Data were compiled from three independent experiments. (C) Representative micrograph of TgVil1-Itln1 and wild-type littermates (WT) after DSS colitis on day 9. (D) TNF measurement on colonic explants from TgVil1-Itln1 and wild-type littermates (WT) on day 9 after DSS colitis (n = 10). Symbols represent individual mice. Data were compiled from two independent experiments (see weight loss graph in Fig. S5 D). (E) IL-22 measurement on mouse colonic explants after DSS colitis (n = 10–11). Symbols represent individual mice. Data were compiled from two independent experiments (see weight loss graph in Fig. S5 D). (F) Tnf transcription in sorted macrophages from TgVil1-Itln1 and wild-type littermates (WT) during day 2 of DSS colitis (n = 5–6). (G) Phagocytosis of uncoated (0 nM) or ITLN1-coated (1 nM) pHrodo Red–conjugated A. muciniphila by human monocyte-derived macrophages. The left panel shows the signal increase over time, and the right panel shows the corresponding AUC. n = 4. Data were compiled from two independent experiments. (H) Schematic of tetracycline treatment for 3 wk to eradicate A. muciniphila. (I) Absolute A. muciniphila levels by qPCR in stools before treatment with tetracycline (left panel), after treatment with tetracycline (middle panel), and after DSS experiment (right panel) in TgVil1-Itln1 and wild-type littermates (WT; n = 8–19). Symbols represent individual mice. (J) Weight loss after DSS colitis model in TgVil1-Itln1 and wild-type littermates (WT) treated with tetracycline (n = 20). Symbols represent means of baseline weight. Error bars represent SEs. Data were compiled from three independent experiments. (K) Histology score on day 9 following DSS colitis after tetracycline treatment in TgVil1-Itln1 and wild-type littermates (WT; n = 10). Symbols represent individual mice. (L) TNF measurement on colonic explants from TgVil1-Itln1 and wild-type littermates (WT) on day 9 after DSS colitis following tetracycline treatment (n = 10). Symbols represent individual mice. (M) IL22 measurement on colonic explants from TgVil1-Itln1 and wild-type littermates (WT) on day 9 after DSS colitis following tetracycline treatment (n = 10). Symbols represent individual mice. WT = wild-type littermate from TgVil1-Itln1 colony. wt = wild-type littermate from Itln1−/− colony. P values were calculated by unpaired T test with correction for multiple comparisons using Holm–Sidak (A and J) or unpaired T test (B, D–G, I, and K–M). *P < 0.05; **P < 0.01; ***P < 0.001.

Comment in

  • Lectin recruits pathogenic bugs.
    Schutt CR, Yamasaki S. Schutt CR, et al. J Exp Med. 2023 Jan 2;220(1):e20221732. doi: 10.1084/jem.20221732. Epub 2022 Nov 22. J Exp Med. 2023. PMID: 36413218 Free PMC article.

References

    1. Adolph, T.E., Tomczak M.F., Niederreiter L., Ko H.-J., Böck J., Martinez-Naves E., Glickman J.N., Tschurtschenthaler M., Hartwig J., Hosomi S., et al. . 2013. Paneth cells as a site of origin for intestinal inflammation. Nature. 503:272–276. 10.1038/nature12599 - DOI - PMC - PubMed
    1. Aibar, S., González-Blas C.B., Moerman T., Huynh-Thu V.A., Imrichova H., Hulselmans G., Rambow F., Marine J.-C., Geurts P., Aerts J., et al. . 2017. SCENIC: Single-cell regulatory network inference and clustering. Nat. Methods. 14:1083–1086. 10.1038/nmeth.4463 - DOI - PMC - PubMed
    1. Almalki, F., Nonnecke E.B., Castillo P.A., Bevin-Holder A., Ullrich K.K., Lönnerdal B., Odenthal-Hesse L., Bevins C.L., and Hollox E.J.. 2021. Extensive variation in the intelectin gene family in laboratory and wild mouse strains. Sci. Rep. 11:15548. 10.1038/s41598-021-94679-3 - DOI - PMC - PubMed
    1. Amann, R.I., Binder B.J., Olson R.J., Chisholm S.W., Devereux R., and Stahl D.A.. 1990. Combination of 16S rRNA-targeted oligonucleotide probes with flow cytometry for analyzing mixed microbial populations. Appl. Environ. Microbiol. 56:1919–1925. 10.1128/aem.56.6.1919-1925.1990 - DOI - PMC - PubMed
    1. Anderson, M.J., and Willis T.J.. 2003. Canonical analysis of principal coordinates: A useful method of constrained ordination for ecology. Ecology. 84:5112–5525. 10.1890/0012-9658(2003)084[0511:CAOPCA]2.0.CO;2 - DOI

Publication types

Supplementary concepts