Clinical Trial
. 2023 Jan 17;133(2):e165076.
doi: 10.1172/JCI165076.

A phase I/II study on intracerebroventricular tralesinidase alfa in patients with Sanfilippo syndrome type B

Affiliations
Clinical Trial

A phase I/II study on intracerebroventricular tralesinidase alfa in patients with Sanfilippo syndrome type B

Nicole Muschol et al. J Clin Invest. .

Abstract

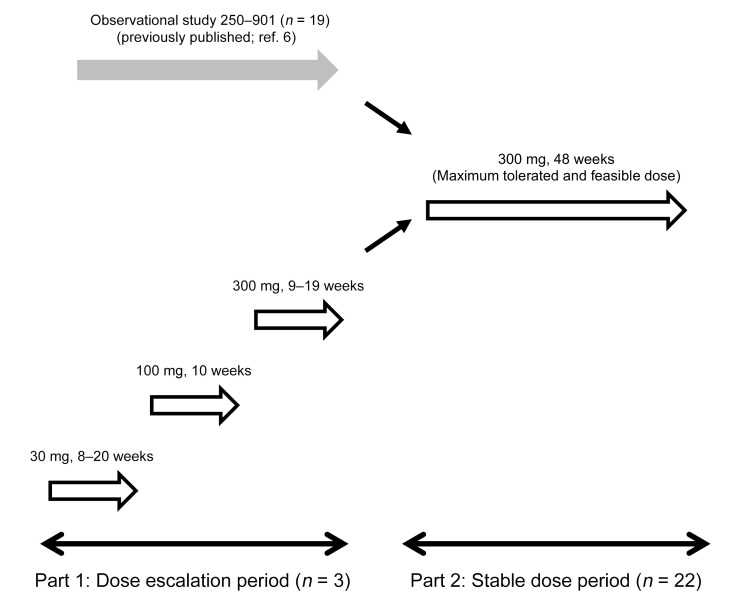
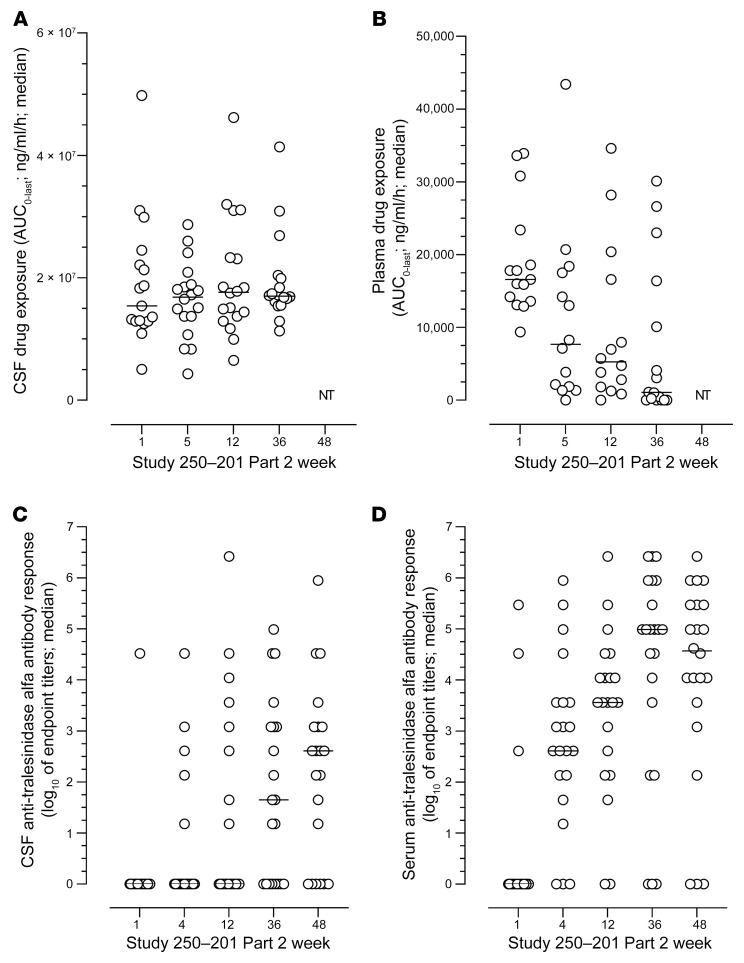
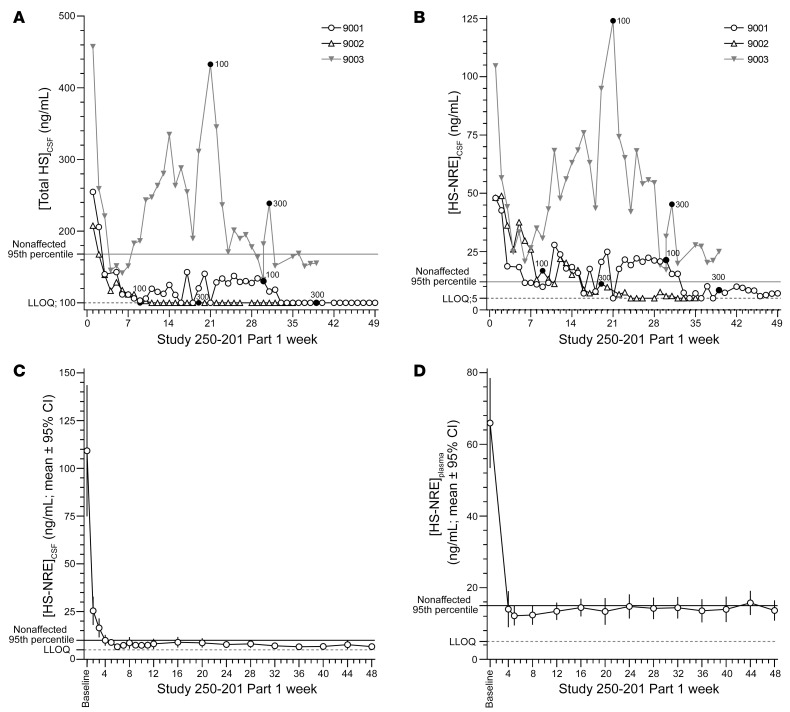
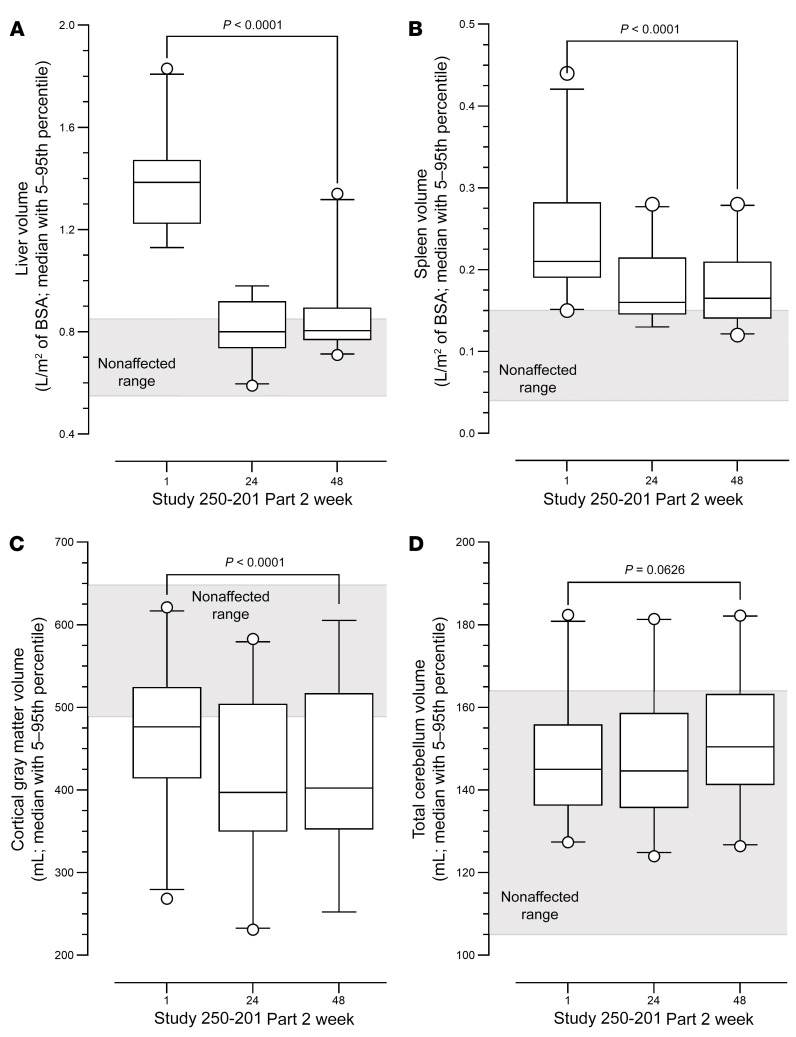
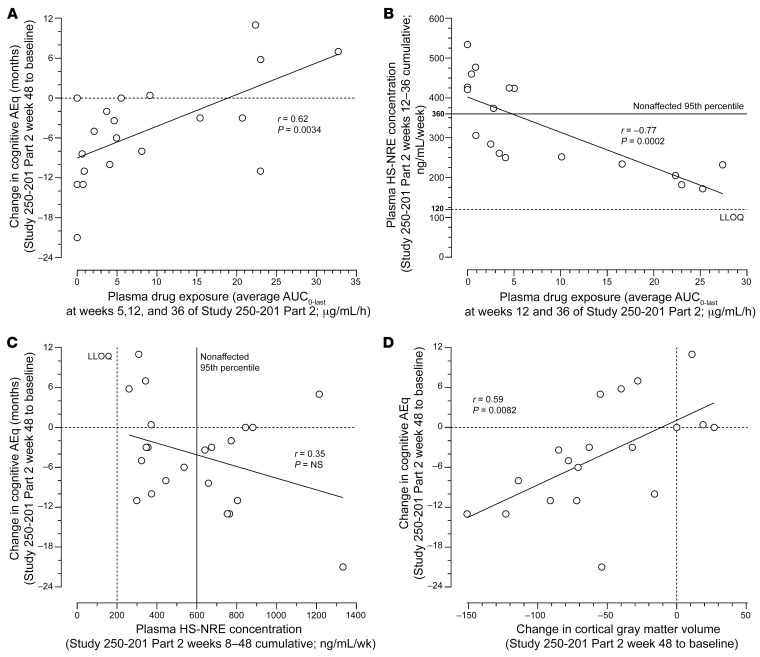
BackgroundSanfilippo type B is a mucopolysaccharidosis (MPS) with a major neuronopathic component characterized by heparan sulfate (HS) accumulation due to mutations in the NAGLU gene encoding alfa-N-acetyl-glucosaminidase. Enzyme replacement therapy for neuronopathic MPS requires efficient enzyme delivery throughout the brain in order to normalize HS levels, prevent brain atrophy, and potentially delay cognitive decline.MethodsIn this phase I/II open-label study, patients with MPS type IIIB (n = 22) were treated with tralesinidase alfa administered i.c.v. The patients were monitored for drug exposure; total HS and HS nonreducing end (HS-NRE) levels in both cerebrospinal fluid (CSF) and plasma; anti-drug antibody response; brain, spleen, and liver volumes as measured by MRI; and cognitive development as measured by age-equivalent (AEq) scores.ResultsIn the Part 1 dose escalation (30, 100, and 300 mg) phase, a 300 mg dose of tralesinidase alfa was necessary to achieve normalization of HS and HS-NRE levels in the CSF and plasma. In Part 2, 300 mg tralesinidase alfa sustained HS and HS-NRE normalization in the CSF and stabilized cortical gray matter volume (CGMV) over 48 weeks of treatment. Resolution of hepatomegaly and a reduction in spleen volume were observed in most patients. Significant correlations were also established between the change in cognitive AEq score and plasma drug exposure, plasma HS-NRE levels, and CGMV.ConclusionAdministration of tralesinidase alfa i.c.v. effectively normalized HS and HS-NRE levels as a prerequisite for clinical efficacy. Peripheral drug exposure data suggest a role for the glymphatic system in altering tralesinidase alfa efficacy.Trial registrationClinicaltrials.gov NCT02754076.FUNDINGBioMarin Pharmaceutical Inc. and Allievex Corporation.

Keywords: Neurological disorders; Neuroscience.


Conflict of interest statement

Conflict of interest: B Kuca, JK, and EZ are employees of Allievex Corporation. SMM is a former employee of Allievex Corporation.

Figures

Figure 1
Figure 1. Flow diagram of Study 250-201.
In Part 1, 3 patients, i.e., 9001, 9002, and 9003, were recruited and treated with escalating doses of 30, 100, and 300 mg tralesinidase alfa as described in Results. These 3 patients were eventually recruited to Part 2 of the study and treated for an additional 48 weeks. In addition, 19 patients, i.e., patients 9004–9015 and 9017–9023, previously observed in our natural history Study 250-901 (6), were treated with 300 mg tralesinidase alfa. One patient, 9016, withdrew from the trial prior to the first drug administration. In all cases, treatment was done weekly through i.c.v. administration.
Figure 2
Figure 2. Drug exposure in plasma and CSF and anti-drug antibody response in serum and CSF.
(A) Patients were treated i.c.v. weekly from weeks 1 to 48 (n = 22). Total exposure in CSF was calculated as the AUC0–last in samples collected 0.5, 4, 10, 24, 48, 72, 96, and 168 hours after drug administration at week 1 (baseline) and at weeks 5, 12, and 36 of Study 250-201 Part 2. (B) similarly, total exposure in serum was calculated as the AUC0–last at weeks 1 (baseline), 5, 12, and 36 of Study 250-201 Part 2. Anti-drug antibodies were measured in CSF (C) and serum (D) at week 1 (baseline) and at weeks 4, 12, 36, and 48 of Study 250-201. Quantification of tralesinidase alfa and titration of anti-drug antibody response were done as described in Methods. NT, not tested (i.e., samples were not collected for PK analysis at week 48). Data are presented as scattered plots with median values.
Figure 3
Figure 3. A 300 mg dose of tralesinidase alfa administered weekly i.c.v. normalizes total HS and HS-NRE levels in the CSF and plasma.
In Study 250-201 Part 1, three patients, i.e., 9001, 9002, and 9003, were treated with 30, 100, or 300 mg tralesinidase alfa weekly. Total HS (A) and HS-NRE (B) concentrations were quantified weekly in the CSF of treated patients using a Sensi-Pro assay as described in Methods. Black dots labeled 100 or 300 indicate the weeks when treatment increased for each patient from 30 to 100 mg or from 100 to 300 mg. In Study 250-201 Part 2, the patients (n = 22) were treated weekly for 48 weeks with 300 mg tralesinidase alfa. HS-NRE was quantified in the CSF (C) and plasma (D) of treated patients weekly or at least every 4 weeks using the Sensi-Pro assay as described in Methods. Two patients were excluded from the data in C and D because they received only 17% and 57%, respectively, of the tralesinidase alfa doses expected to be administered from baseline to week 48 of Study 250-201. Data in C and D are expressed as the mean ± 95% CI. Supplemental Tables 1 and 3 list the individual values for each data point and each patient.
Figure 4
Figure 4. Changes in liver, spleen, cortical gray matter, and cerebellum gray matter volumes over the course of Study 250-201 Part 2.
Liver (A), spleen (B), and brain subregions (C and D) were measured by MRI at week 1 (baseline) and weeks 24 and 48. Ranges for nonaffected patients were defined on the basis of previous publications (13, 14, 36, 37). MRI data were collected as described in Methods. Liver and spleen volumes in A and B were adjusted for BSA. Individual values in C and D for each participant at week 1 of Part 1 and weeks 1, 24, and 48 of Part 2 are listed in Supplemental Table 5. Boxes represent the 5th–95th percentiles with the median; dots represent values outside the 5th–95th percentiles. P values comparing week 1 (baseline) with week 48 were calculated using a 2-tailed, paired t test as determined by GraphPad Prism 9.3.1. n = 22 for liver and spleen; n = 19 and n = 20 for cortical gray matter and cerebellum, respectively.
Figure 5
Figure 5. Correlation analyses of cognitive AEq scores, plasma drug exposure, plasma HS-NRE concentrations, and CGMVs over 48 weeks of tralesinidase alfa treatment.
(A) Change in cognitive AEq score from Study 250-201 Part 2, week 1 to week 48, versus the average plasma drug exposure, i.e., AUC0–last, at weeks 5, 12, and 36 of Study 250-201 Part 2. (B) Plasma HS-NRE cumulative concentrations from weeks 8 to 48 of Study 250-201 Part 2 versus the average plasma drug exposure, i.e., AUC0–last, at weeks 5, 12, and 36 of Study 250-201 Part 2. the HS-NRE LLOQ was defined as 200 ng/mL/week, i.e., 5 ng/mL/week times 40 weeks, whereas the 95th percentile for nonaffected individuals was defined as 15 ng/mL/week times 40 weeks. (C) Change in cognitive AEq scores from Study 250-201 Part 2, weeks 1 to 48, versus plasma HS-NRE cumulative concentrations from weeks 8 to 48 of Study 250-201 Part 2. (D) Change in cognitive AEq scores from Study 250-201 Part 2, weeks 1 to 48, versus the change in CGMVs from Study 250-201 Part 2, weeks 1 to 48. Pearson’s r correlation and P values were calculated using GraphPad Prism 9.3.1. n = 20, n = 18, n = 22, and n = 19 for AD, respectively.

References

    1. Parenti G, et al. The rapidly evolving view of lysosomal storage diseases. EMBO Mol Med. 2021;13(2):e12836. - PMC - PubMed
    1. Fernandez-Pereira C, et al. Therapeutic approaches in lysosomal storage diseases. Biomolecules. 2021;11(12):1775. doi: 10.3390/biom11121775. - DOI - PMC - PubMed
    1. Puckett Y, et al. Epidemiology of mucopolysaccharidoses (MPS) in United States: challenges and opportunities. Orphanet J Rare Dis. 2021;16(1):241. doi: 10.1186/s13023-021-01880-8. - DOI - PMC - PubMed
    1. Andrade F, et al. Sanfilippo syndrome: overall review. Pediatr Int. 2015;57(3):331–338. doi: 10.1111/ped.12636. - DOI - PubMed
    1. Clark WT, et al. Utilizing ExAC to assess the hidden contribution of variants of unknown significance to Sanfilippo Type B incidence. PLoS One. 2018;13(7):e0200008. doi: 10.1371/journal.pone.0200008. - DOI - PMC - PubMed

Publication types

Substances

Associated data