. 2022 Nov 29;119(48):e2201783119.
doi: 10.1073/pnas.2201783119. Epub 2022 Nov 21.

Neuronally produced betaine acts via a ligand-gated ion channel to control behavioral states

Affiliations

Neuronally produced betaine acts via a ligand-gated ion channel to control behavioral states

Iris Hardege et al. Proc Natl Acad Sci U S A. .

Abstract

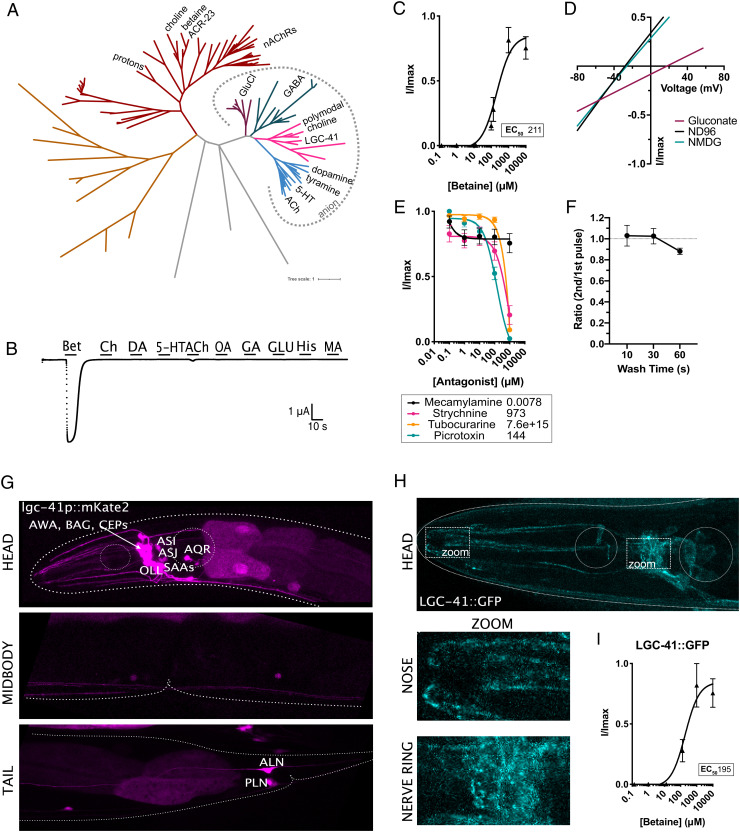
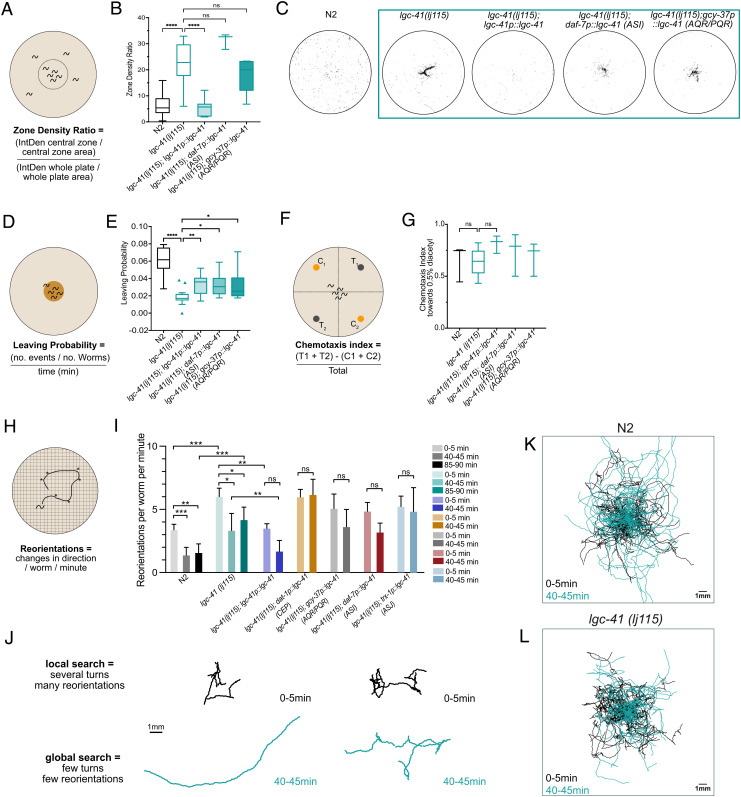
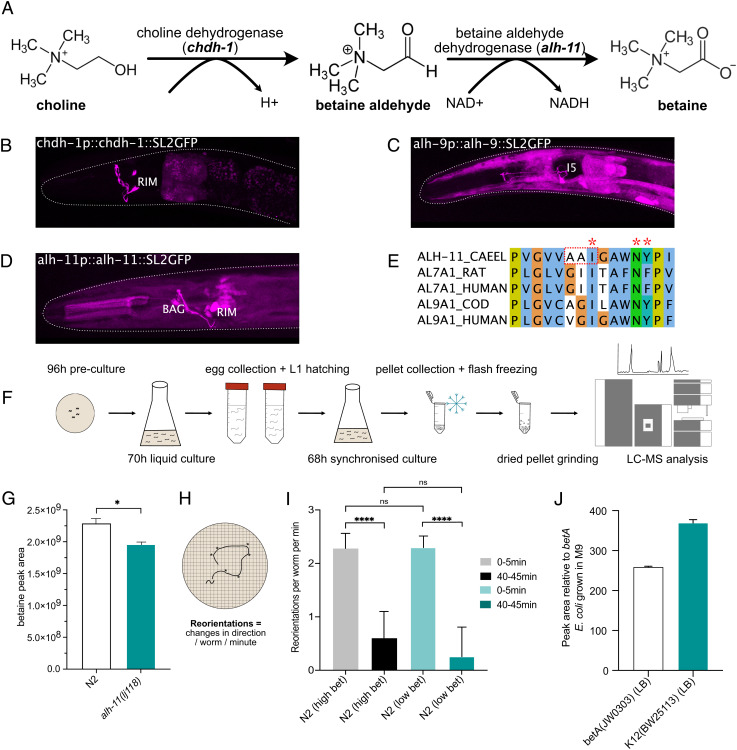
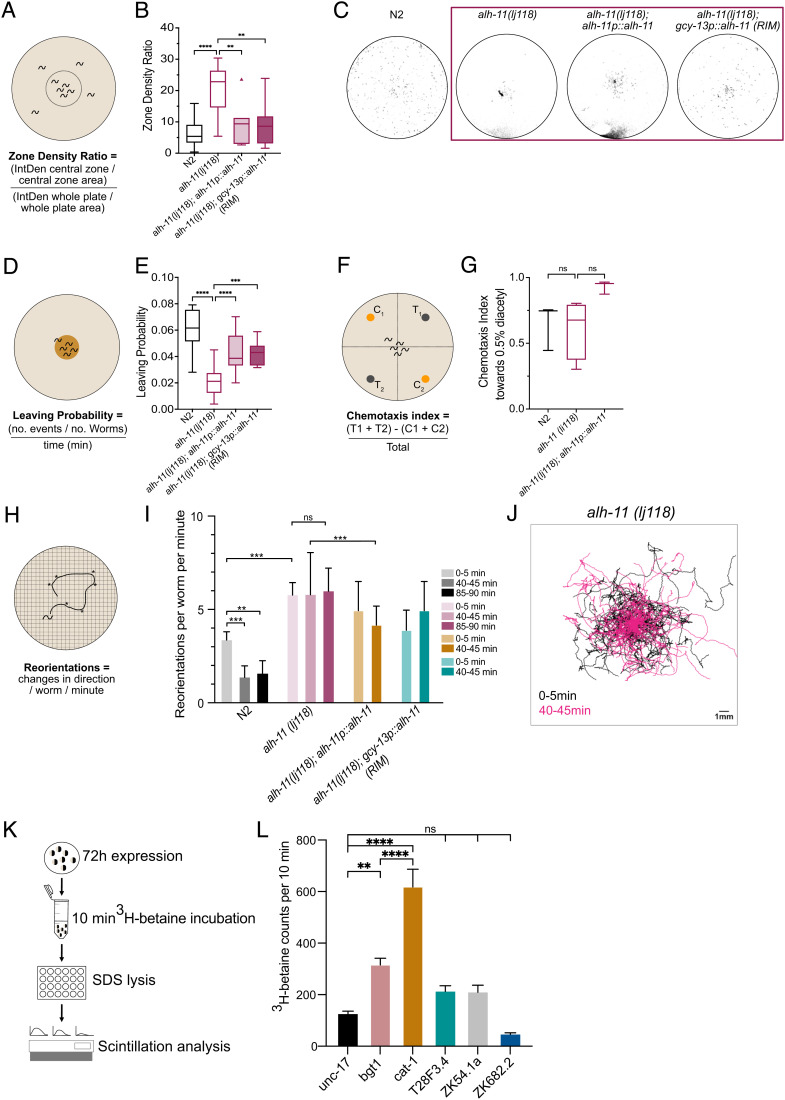
Trimethylglycine, or betaine, is an amino acid derivative found in diverse organisms, from bacteria to plants and animals, with well-established functions as a methyl donor and osmolyte in all cells. In addition, betaine is found in the nervous system, though its function there is not well understood. Here, we show that betaine is synthesized in the nervous system of the nematode worm, Caenorhabditis elegans, where it functions in the control of different behavioral states. Specifically, we find that betaine can be produced in a pair of interneurons, the RIMs, and packed into synaptic vesicles by the vesicular monoamine transporter, CAT-1, expressed in these cells. Mutant animals defective in betaine synthesis are unable to control the switch from local to global foraging, a phenotype that can be rescued by restoring betaine specifically to the RIM neurons. These effects on behavior are mediated by a newly identified betaine-gated chloride channel, LGC-41, which is expressed broadly in the navigation circuit. These results implicate neuronally produced betaine as a neuromodulator in vivo and suggest a potentially similar role for betaine in nervous systems of other animals.

Keywords: C. elegans; behavior; betaine; ion channel.


Conflict of interest statement

The authors declare no competing interest.

Figures

Fig. 1.
Fig. 1.
LGC-41 forms a homomeric inhibitory betaine-gated channel. (A) Phylogenetic tree showing evolutionary relationship between C. elegans LGICs, branch colors show subfamilies as follows: nAChRs (red), uncharacterized (orange and grey), GluCl (purple), GABA-gated anion and cation channels (green), diverse channels including LGC-41 (pink), ACh-gated and monoamine-gated channels (blue). Figure made with iTOL using an unrooted tree with one iteration of the equal-daylight algorithm (B) Continuous current trace for an oocyte expressing LGC-41 held at −60 mV and perfused with a panel of ligands. (C) Dose–response curve for oocytes expressing LGC-41 exposed to increasing concentrations of betaine, error bars represent SEM of at least five oocytes. Inset shows EC50 in μM calculated with a three parameter Hill slope. (D) Representative plot of current-voltage relationship of betaine-induced current in oocytes expressing LGC-41 in ND96 (Na+ & Cl present), Na Gluconate (low Cl) and NMDG (no Na+), mean ΔErev for ND96 vs. Na Gluconate: −43.1 mV, SEM: 0.8 mV, N = 9 oocytes. (E) Antagonist dose–response curves in oocytes expressing LGC-41 in the presence of 500 μM betaine and increasing concentrations of each antagonist, error bars represent SEM of at least seven oocytes. Inset shows IC50 in μM calculated with a three parameter Hill slope. (F) Ratio of betaine-induced current in oocytes expressing LGC-41 exposed to multiple pulses of 500 μM betaine with 10-, 30-, and 60-s wash time between pulses. Error bars represent SEM of at least 6 oocytes. (G) Fluorescent reporter of mKate2 driven under the promoter sequence of lgc-41. (H) Images of LGC-41::GFP tagged endogenously with CRISPR/Cas9 in the M3/4 loop, dotted boxes indicate zoomed areas which show localization in the nose and nerve ring. (I) Dose–response curve for oocytes expressing LGC-41::GFP exposed to increasing concentrations of betaine, error bars represent SEM of at least four oocytes. Inset shows EC50 in μM calculated with a three parameter Hill slope.
Fig. 2.
Fig. 2.
LGC-41 is required for global search and food leaving behaviors. Behavioral responses of N2 (wild-type), lgc-41(lj115)lgc-41(lj115); lgc-41p::lgc-41, lgc-41(lj115); daf-7p(ASI)::lgc-41, lgc-41(lj115); gcy-37p(AQR/PQR)::lgc-41. (A) Schematic representation of the experimental design and (B) Tukey’s box and whisker plot of dispersal assay, in which the zone density ratio of the central zone vs. the whole plate is calculated and plotted. N = 3–29 plates per genotype. (C) Representative images of threshold-filtered plates used to calculate dispersal index. (D) Schematic representation of the experimental design and (E) box and whisker plot of food leaving probability 6 h after being placed on the food patch. N = 16–21 plates per genotype. (F) Schematic representation of experiment (G) Chemotaxis index toward 0.5% diacetyl. N = 3–5 plates per genotype presented in a box and whisker plot. (H) Schematic representation of the experimental design. (I) Amount of reorientation events off food at three different time points, as measured per worm per minute. N = 99–157 per genotype. (J) Representative trajectories of individual N2 or lgc-41 mutant worms at 0–5 min and 40–45 min after removal from a food patch. (K and L) Overlaid trajectories of individual N2 or lgc-41 mutant worms at 0–5 min and 40–45 min after removal from a food patch. (K) 0–5 min: N = 95, 40–45 min: N = 85 individual worms. (L) 0–5 min: N = 58, 40–45 min: N = 52 individual worms. (B, C, E, and G) Tukey’s boxplots showing the median and one-way ANOVA with Bonferroni (B and G) or Tukey’s (C and E) correction for multiple comparisons, *P < 0.05, **P < 0.005, ****P < 0.0001. (I) Bars represent the median value with 95% CI and significance test using the Kruskal–Wallis test *P < 0.05, **P < 0.005, ***P < 0.0005.
Fig. 3.
Fig. 3.
Neuronal C. elegans betaine synthesis pathway involves alh-11. (A) Schematic of the betaine biosynthesis pathway and putative enzymes involved in each stage. (B–D) Fluorescent reporter of intercistonically spliced GFP driven under the promoter and genomic sequence of the putative betaine synthesis enzymes chdh-1, alh-9, and alh-11. (E) Cropped alignment of the substrate-binding region of C. elegans ALH-11 and related genes from rat, human and cod. Stars highlight conserved residues required for substrate and NAD+ binding as described by ref. , residues within the red box are mutated in alh-11(lj118) from AAI to --V, the full alignment can be found in SI Appendix, Fig. S1B. (F) Schematic describing the experimental procedure for metabolite extraction paired with LC–MS analysis in C. elegans preparations. (G) Mass spectrometry analysis of betaine content in C. elegans wild-type or alh-11 mutant preparation. The data show peak area for betaine. Error bars represent SEM of three samples per genotype, *P < 0.05 calculated by unpaired t-test. (H) Schematic representing the experimental design. (I) Food search behavior as calculated by reorientations per worm per minute in N2 worms grown under betaine-deficient conditions using the strain betA(JW0303), grown in M9 media, or betaine-containing Lennox Broth (LB) media. N = 75–133 worms per condition. Bar charts showing median with 95% CI and significance test using the Kruskal–Wallis test *P < 0.05, **P < 0.005, ***P < 0.0005. (J) Relative betaine amount detected using quantitative mass spectrometry in the betA(JW0303) and K12(BW25113) strains grown in LB media to the betA grown in M9 media.
Fig. 4.
Fig. 4.
Endogenously produced betaine is required to promote global search and food leaving behaviors. Behavioral responses of N2 (wild-type), alh-11(lj118), alh-11(lj118); alh-11p::alh-11, and alh-11(lj118); gcy-13p(RIM)::alh-11 worms. (A) Schematic representation of the experimental design and (B) Tukey’s boxplot of dispersal assay, in which the zone density ratio of the central zone vs. the whole plate is calculated and plotted. N = 3–29 plates per genotype. (C) Representative images of threshold-filtered plates used to calculated dispersal index. (D) Schematic representation of the experimental design and (E) Tukey’s box plot of food leaving probability 6 h after being placed on the food patch. N = 16–21 plates per genotype. (F) Schematic representation of the experiment (G) Chemotaxis index toward 0.5% diacetyl. N = 3–5 plates per genotype presented in a box and whisker plot. (H) Schematic representation of the experimental design (I) Amount of reorientation events off food at three different time points, as measured per worm per minute. N = 80–157 per genotype. Bars show median value with 95% CI and significance test using the Kruskal–Wallis test *P < 0.05, **P < 0.005, ***P < 0.0005. (J) Overlaid trajectories of individual alh-11 mutant animals at 0–5 min and 40–45 min after removal from a food patch. 0–5 min: N = 69, 40–45 min: N = 109 individual worms. (K) Schematic outlining workflow for transporter assay in Xenopus oocytes. (L) 3H-betaine uptake during 10 min evaluated in the C. elegans genes unc-17, cat-1, T28F3.4, ZK54.1a, and ZK682.2 as well as the human betaine/GABA transporter BGT1 (SLC6A12). Error bars represent SEM of 6–10 samples per genotype, **P < 0.01, ****P < 0.0001, calculated by a one-way ANOVA using Sidak’s test for multiple comparisons. (B, C, E, and G) Tukey’s boxplots showing the median value and a one-way ANOVA with Bonferroni (B and G) or Tukey’s (C and E) correction for multiple comparisons, **P < 0.005, ***P < 0.001, ****P < 0.0001.

References

    1. Nakanishi T., Turner R. J., Burg M. B., Osmoregulation of betaine transport in mammalian renal medullary cells. Am. J. Physiol. Ren. Fluid Electrolyte Physiol. 258, F1061–F1067 (1990). - PubMed
    1. Ott V., Koch J., Späte K., Morbach S., Krämer R., Regulatory properties and interaction of the C- and N-terminal domains of BetP, an osmoregulated betaine transporter from Corynebacterium glutamicun. Biochemistry 47, 12208–12218 (2008). - PubMed
    1. Teng Y. W., Mehedint M. G., Garrow T. A., Zeisel S. H., Deletion of betaine-homocysteine S-methyltransferase in mice perturbs choline and 1-carbon metabolism, resulting in fatty liver and hepatocellular carcinomas. J. Biol. Chem. 286, 36258–36267 (2011). - PMC - PubMed
    1. Yamauchi A., et al. , Cloning of a Na+- and Cl-dependent betaine transporter that is regulated by hypertonicity. J. Biol. Chem. 267, 649–652 (1992). - PubMed
    1. Lopez-Corcuera B., Liu Q. R., Mandiyan S., Nelson H., Nelson N., Expression of a mouse brain cDNA encoding novel γ-aminobutyric acid transporter. J. Biol. Chem. 267, 17491–17493 (1992). - PubMed

Publication types

MeSH terms

LinkOut - more resources