. 2022 Dec 1;109(12):2163-2177.
doi: 10.1016/j.ajhg.2022.10.013. Epub 2022 Nov 21.

Calibration of computational tools for missense variant pathogenicity classification and ClinGen recommendations for PP3/BP4 criteria

Collaborators, Affiliations

Calibration of computational tools for missense variant pathogenicity classification and ClinGen recommendations for PP3/BP4 criteria

Vikas Pejaver et al. Am J Hum Genet. .

Abstract

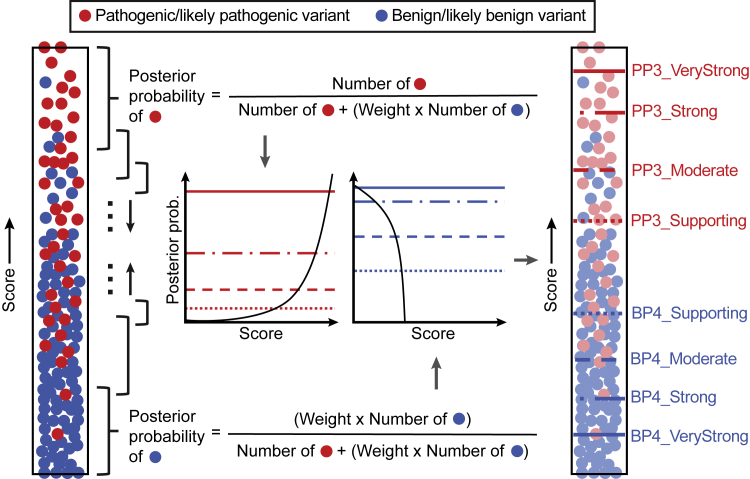
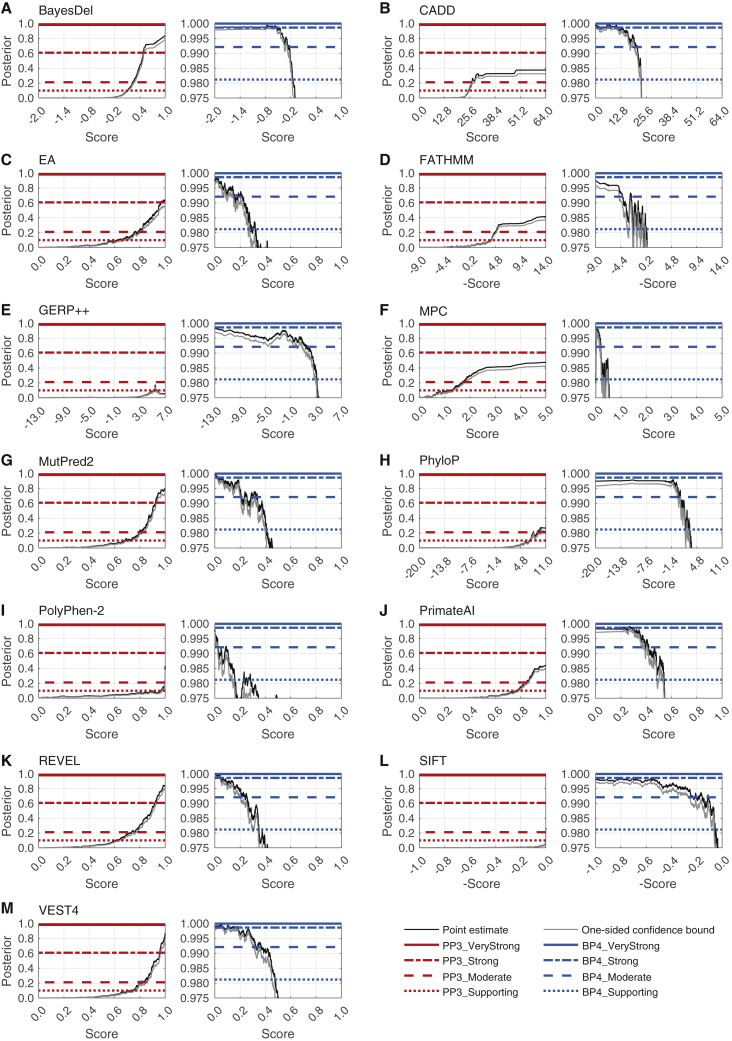
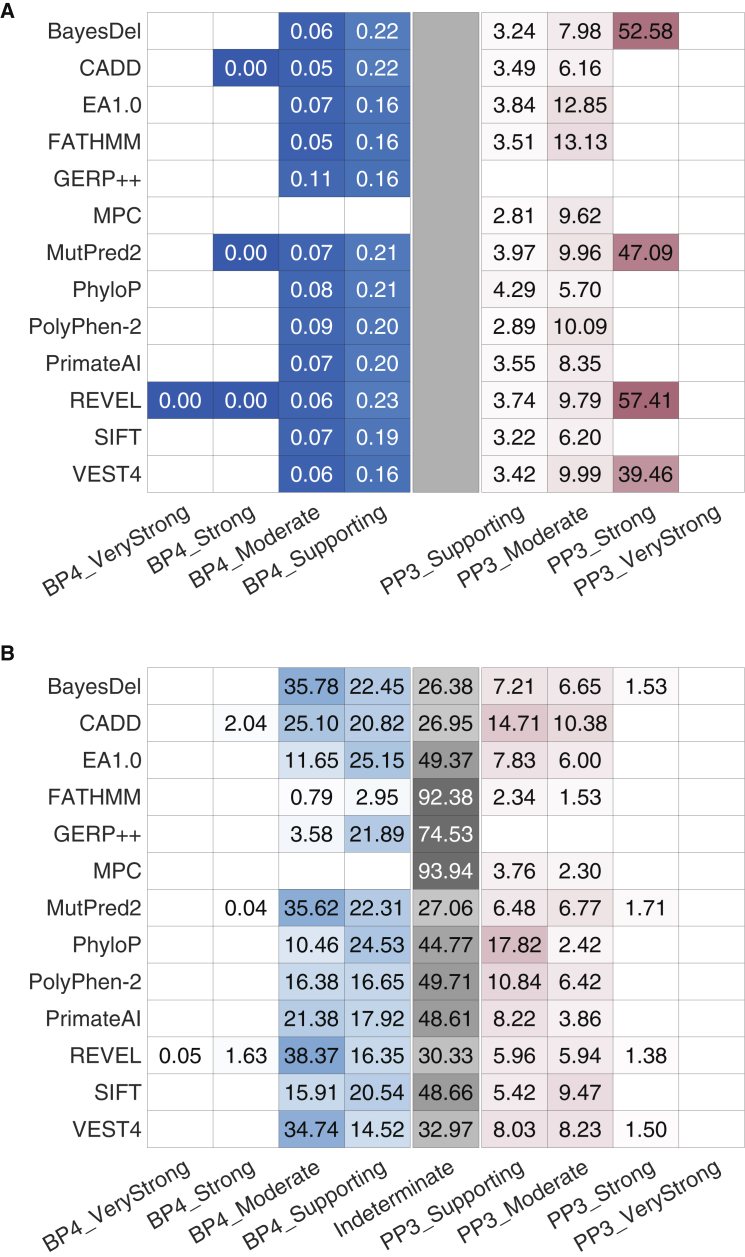
Recommendations from the American College of Medical Genetics and Genomics and the Association for Molecular Pathology (ACMG/AMP) for interpreting sequence variants specify the use of computational predictors as "supporting" level of evidence for pathogenicity or benignity using criteria PP3 and BP4, respectively. However, score intervals defined by tool developers, and ACMG/AMP recommendations that require the consensus of multiple predictors, lack quantitative support. Previously, we described a probabilistic framework that quantified the strengths of evidence (supporting, moderate, strong, very strong) within ACMG/AMP recommendations. We have extended this framework to computational predictors and introduce a new standard that converts a tool's scores to PP3 and BP4 evidence strengths. Our approach is based on estimating the local positive predictive value and can calibrate any computational tool or other continuous-scale evidence on any variant type. We estimate thresholds (score intervals) corresponding to each strength of evidence for pathogenicity and benignity for thirteen missense variant interpretation tools, using carefully assembled independent data sets. Most tools achieved supporting evidence level for both pathogenic and benign classification using newly established thresholds. Multiple tools reached score thresholds justifying moderate and several reached strong evidence levels. One tool reached very strong evidence level for benign classification on some variants. Based on these findings, we provide recommendations for evidence-based revisions of the PP3 and BP4 ACMG/AMP criteria using individual tools and future assessment of computational methods for clinical interpretation.

Keywords: ACMG/AMP recommendations; PP3/BP4 criteria; clinical classification; computational predictors; in silico tools; likelihood ratio; posterior probability; variant interpretation.


Conflict of interest statement

Declaration of interests The PERCH software, for which B.-J.F. is the inventor, has been non-exclusively licensed to Ambry Genetics Corporation for their clinical genetic testing services and research. B.-J.F. also reports funding and sponsorship to his institution on his behalf from Pfizer Inc., Regeneron Genetics Center LLC., and Astra Zeneca. A.O’D.-L. is a compensated member of the Scientific Advisory Board of Congenica. L.G.B. is an uncompensated member of the Illumina Medical Ethics committee and receives honoraria from Cold Spring Harbor Laboratory Press. V.P., B.-J.F., K.A.P., S.D.M., R.K., A.O’D.-L., and P.R. participated in the development of some of the tools assessed in this study. While every care was taken to mitigate any potential biases in this work, these authors’ participation in method development is noted.

Figures

Figure 1
Figure 1
Data set preparation Steps taken to prepare the three data sets in this study, extracted from ClinVar (A and C) and gnomAD (B). Numbers on the right side represent the numbers of variants remaining after each step and numbers in parentheses represent the numbers of genes remaining after each step. The data set resulting from (A) is referred to as the ClinVar 2019 set, from (B) the gnomAD set, and from (C) the ClinVar 2020 set. The asterisk refers to numbers after removing variants from the MPC training sets. This was done in a post hoc manner after all filtering and downsampling steps were carried out for the ClinVar 2019 and gnomAD sets.
Figure 2
Figure 2
Conceptual representation of the estimation of intervals for evidential support An example in silico tool that is supposed to assign higher scores to pathogenic variants is shown. Each filled circle represents a variant, either pathogenic/likely pathogenic (red) or benign/likely benign (blue) as recorded in the ClinVar 2019 set. All unique scores were first sorted and each score was then set as the center of the sliding window or the local interval (black-colored braces), within which posterior probabilities were calculated. Here, to ensure that a sufficient number of variants were included in each local interval, ϵ was adaptively selected to be the smallest value so that the interval [sϵ,s+ϵ] around a prediction score s incorporated at least 100 pathogenic and benign variants (combined) from the ClinVar 2019 set and at least 3% of rare variants from the gnomAD set with predictions in the given local interval, separately for each method (technically, ϵ is a function of score s for each predictor). These numbers were proportionally scaled at the ends of the score range. The estimated posterior probabilities were then plotted against the output scores. Using posterior probability thresholds defined in Table 1, score thresholds were subsequently obtained for pathogenicity (PP3) and benignity (BP4) for each method. Here, the number of benign variants was weighted to calibrate methods according to the prior probability of pathogenicity. The weight was calculated by dividing the ratio of pathogenic and benign variant counts in the full data set by the prior odds of pathogenicity; see Equation 3. The pathogenic and benign counts (and this weight) slightly varied for each method because scores were not available for all variants in the data set for some tools. In this study, the estimated prior probability of pathogenicity (0.0441) was used to account for the enrichment of pathogenic/likely pathogenic variants in ClinVar. The estimated prior probability of benignity was assumed to be 1–0.0441 = 0.9559.
Figure 3
Figure 3
Local posterior probability curves Shown are (A) BayesDel, (B) CADD, (C) Evolutionary Action (EA), (D) FATHMM, (E) GERP++, (F) MPC, (G) MutPred2, (H) PhyloP, (I) PolyPhen-2, (J) PrimateAI, (K) REVEL, (L) SIFT, and (M) VEST4. For each panel, there are two curves: the curve on the left is for pathogenicity (red horizontal lines) and the curve on the right is for benignity (blue horizontal lines). The horizontal lines represent the posterior probability thresholds for supporting, moderate, strong, and very strong evidence. The black curves represent the posterior probability estimated from the ClinVar 2019 set. The grey curves represent one-sided 95% confidence intervals calculated from 10,000 bootstrap samples of this data set (in the direction of more stringent thresholds). The points at which the grey curves intersect the horizontal lines represent the thresholds for the relevant intervals.
Figure 4
Figure 4
Evaluation of the robustness of our approach and estimated score intervals (A) The likelihood ratios within each interval on the independent ClinVar 2020 set. (B) The percentage of variants predicted to be within the interval in the gnomAD set. Blue and red distinguish between the evidential strength intervals for benignity and pathogenicity, respectively, with the indeterminate interval colored grey. The color gradient corresponds to the value in the cells, regardless of color. In (A), darker colors indicate higher values for pathogenicity and lower values for benignity (because these are positive likelihood ratios). The limits for the color gradients are asymmetric, with ranges set between 0 and 1 for benignity and between 1 and 100 for pathogenicity. In (B), darker colors indicate higher proportions. A grey rectangle is introduced at the center of (A) for comparability across the two panels. White cells without values indicate that the tool did not yield thresholds corresponding to the relevant intervals. The indeterminate interval in (B) also included variants without any scores. For each tool, the fraction of variants with missing predictions is reported in Table S2. When interpreting these findings, the totality of the results in (A) and (B) must be considered to account for the effects of binning of continuous scores into discrete intervals. For example, although a tool such as CADD provides most predictions classified to be supporting and moderate for PP3 (B), it does so with lower accuracy (A), measured by the smaller number of true positive predictions for the same number of false positive ones, than a tool such as REVEL. Due to the effects of binning, many of the true positive predictions for REVEL are in its strong evidence category, further obscuring interpretation. Thus, the results in Table 2 and this figure must be considered with utmost care for any use outside our recommendations; see below.

References

    1. McInnes G., Sharo A.G., Koleske M.L., Brown J.E.H., Norstad M., Adhikari A.N., Wang S., Brenner S.E., Halpern J., Koenig B.A., et al. Opportunities and challenges for the computational interpretation of rare variation in clinically important genes. Am. J. Hum. Genet. 2021;108:535–548. doi: 10.1016/j.ajhg.2021.03.003. - DOI - PMC - PubMed
    1. Richards S., Aziz N., Bale S., Bick D., Das S., Gastier-Foster J., Grody W.W., Hegde M., Lyon E., Spector E., et al. Standards and guidelines for the interpretation of sequence variants: a joint consensus recommendation of the American College of Medical Genetics and Genomics and the Association for Molecular Pathology. Genet. Med. 2015;17:405–424. - PMC - PubMed
    1. Ghosh R., Oak N., Plon S.E. Evaluation of in silico algorithms for use with ACMG/AMP clinical variant interpretation guidelines. Genome Biol. 2017;18:225. doi: 10.1186/s13059-017-1353-5. - DOI - PMC - PubMed
    1. Peterson T.A., Doughty E., Kann M.G. Towards precision medicine: advances in computational approaches for the analysis of human variants. J. Mol. Biol. 2013;425:4047–4063. - PMC - PubMed
    1. Hu Z., Yu C., Furutsuki M., Andreoletti G., Ly M., Hoskins R., Adhikari A.N., Brenner S.E. VIPdb, a genetic variant impact predictor database. Hum. Mutat. 2019;40:1202–1214. doi: 10.1002/humu.23858. - DOI - PMC - PubMed

Publication types

LinkOut - more resources