. 2022 Oct 12;42(41):7721-7732.
doi: 10.1523/JNEUROSCI.0096-22.2022. Epub 2022 Sep 9.

Cerebellar GABA Change during Visuomotor Adaptation Relates to Adaptation Performance and Cerebellar Network Connectivity: A Magnetic Resonance Spectroscopic Imaging Study

Affiliations

Cerebellar GABA Change during Visuomotor Adaptation Relates to Adaptation Performance and Cerebellar Network Connectivity: A Magnetic Resonance Spectroscopic Imaging Study

Caroline Nettekoven et al. J Neurosci. .

Abstract

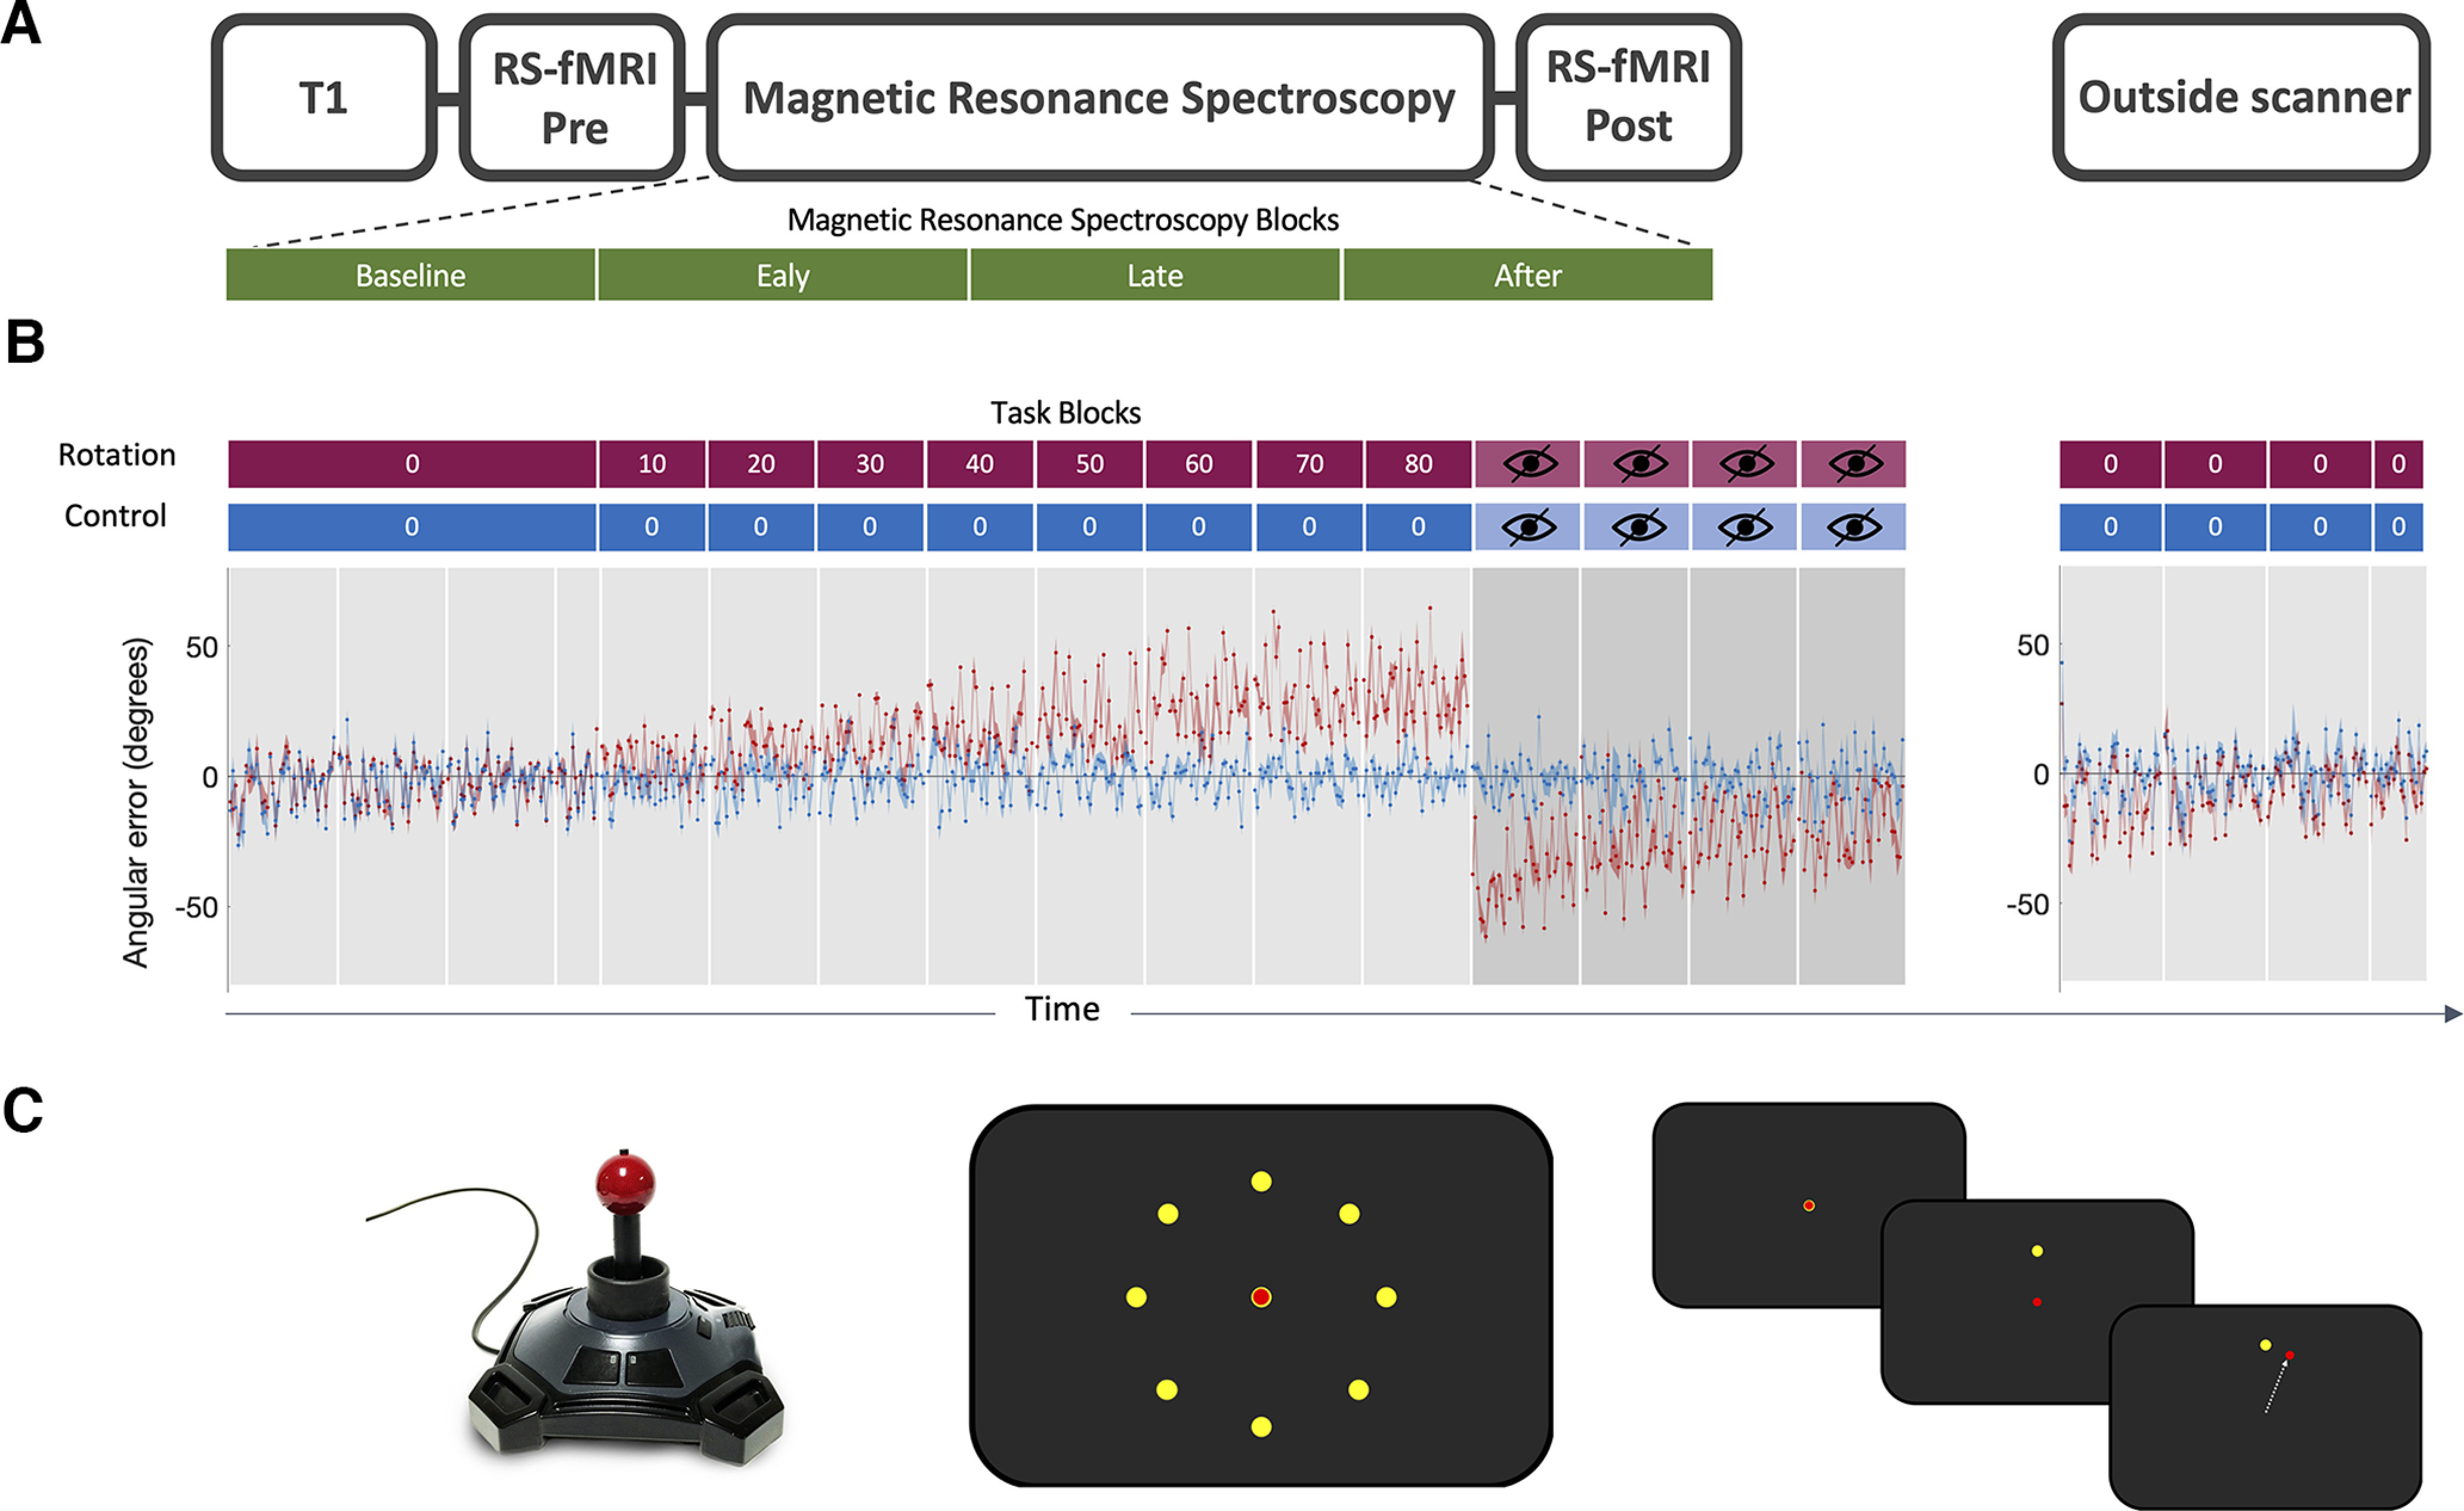
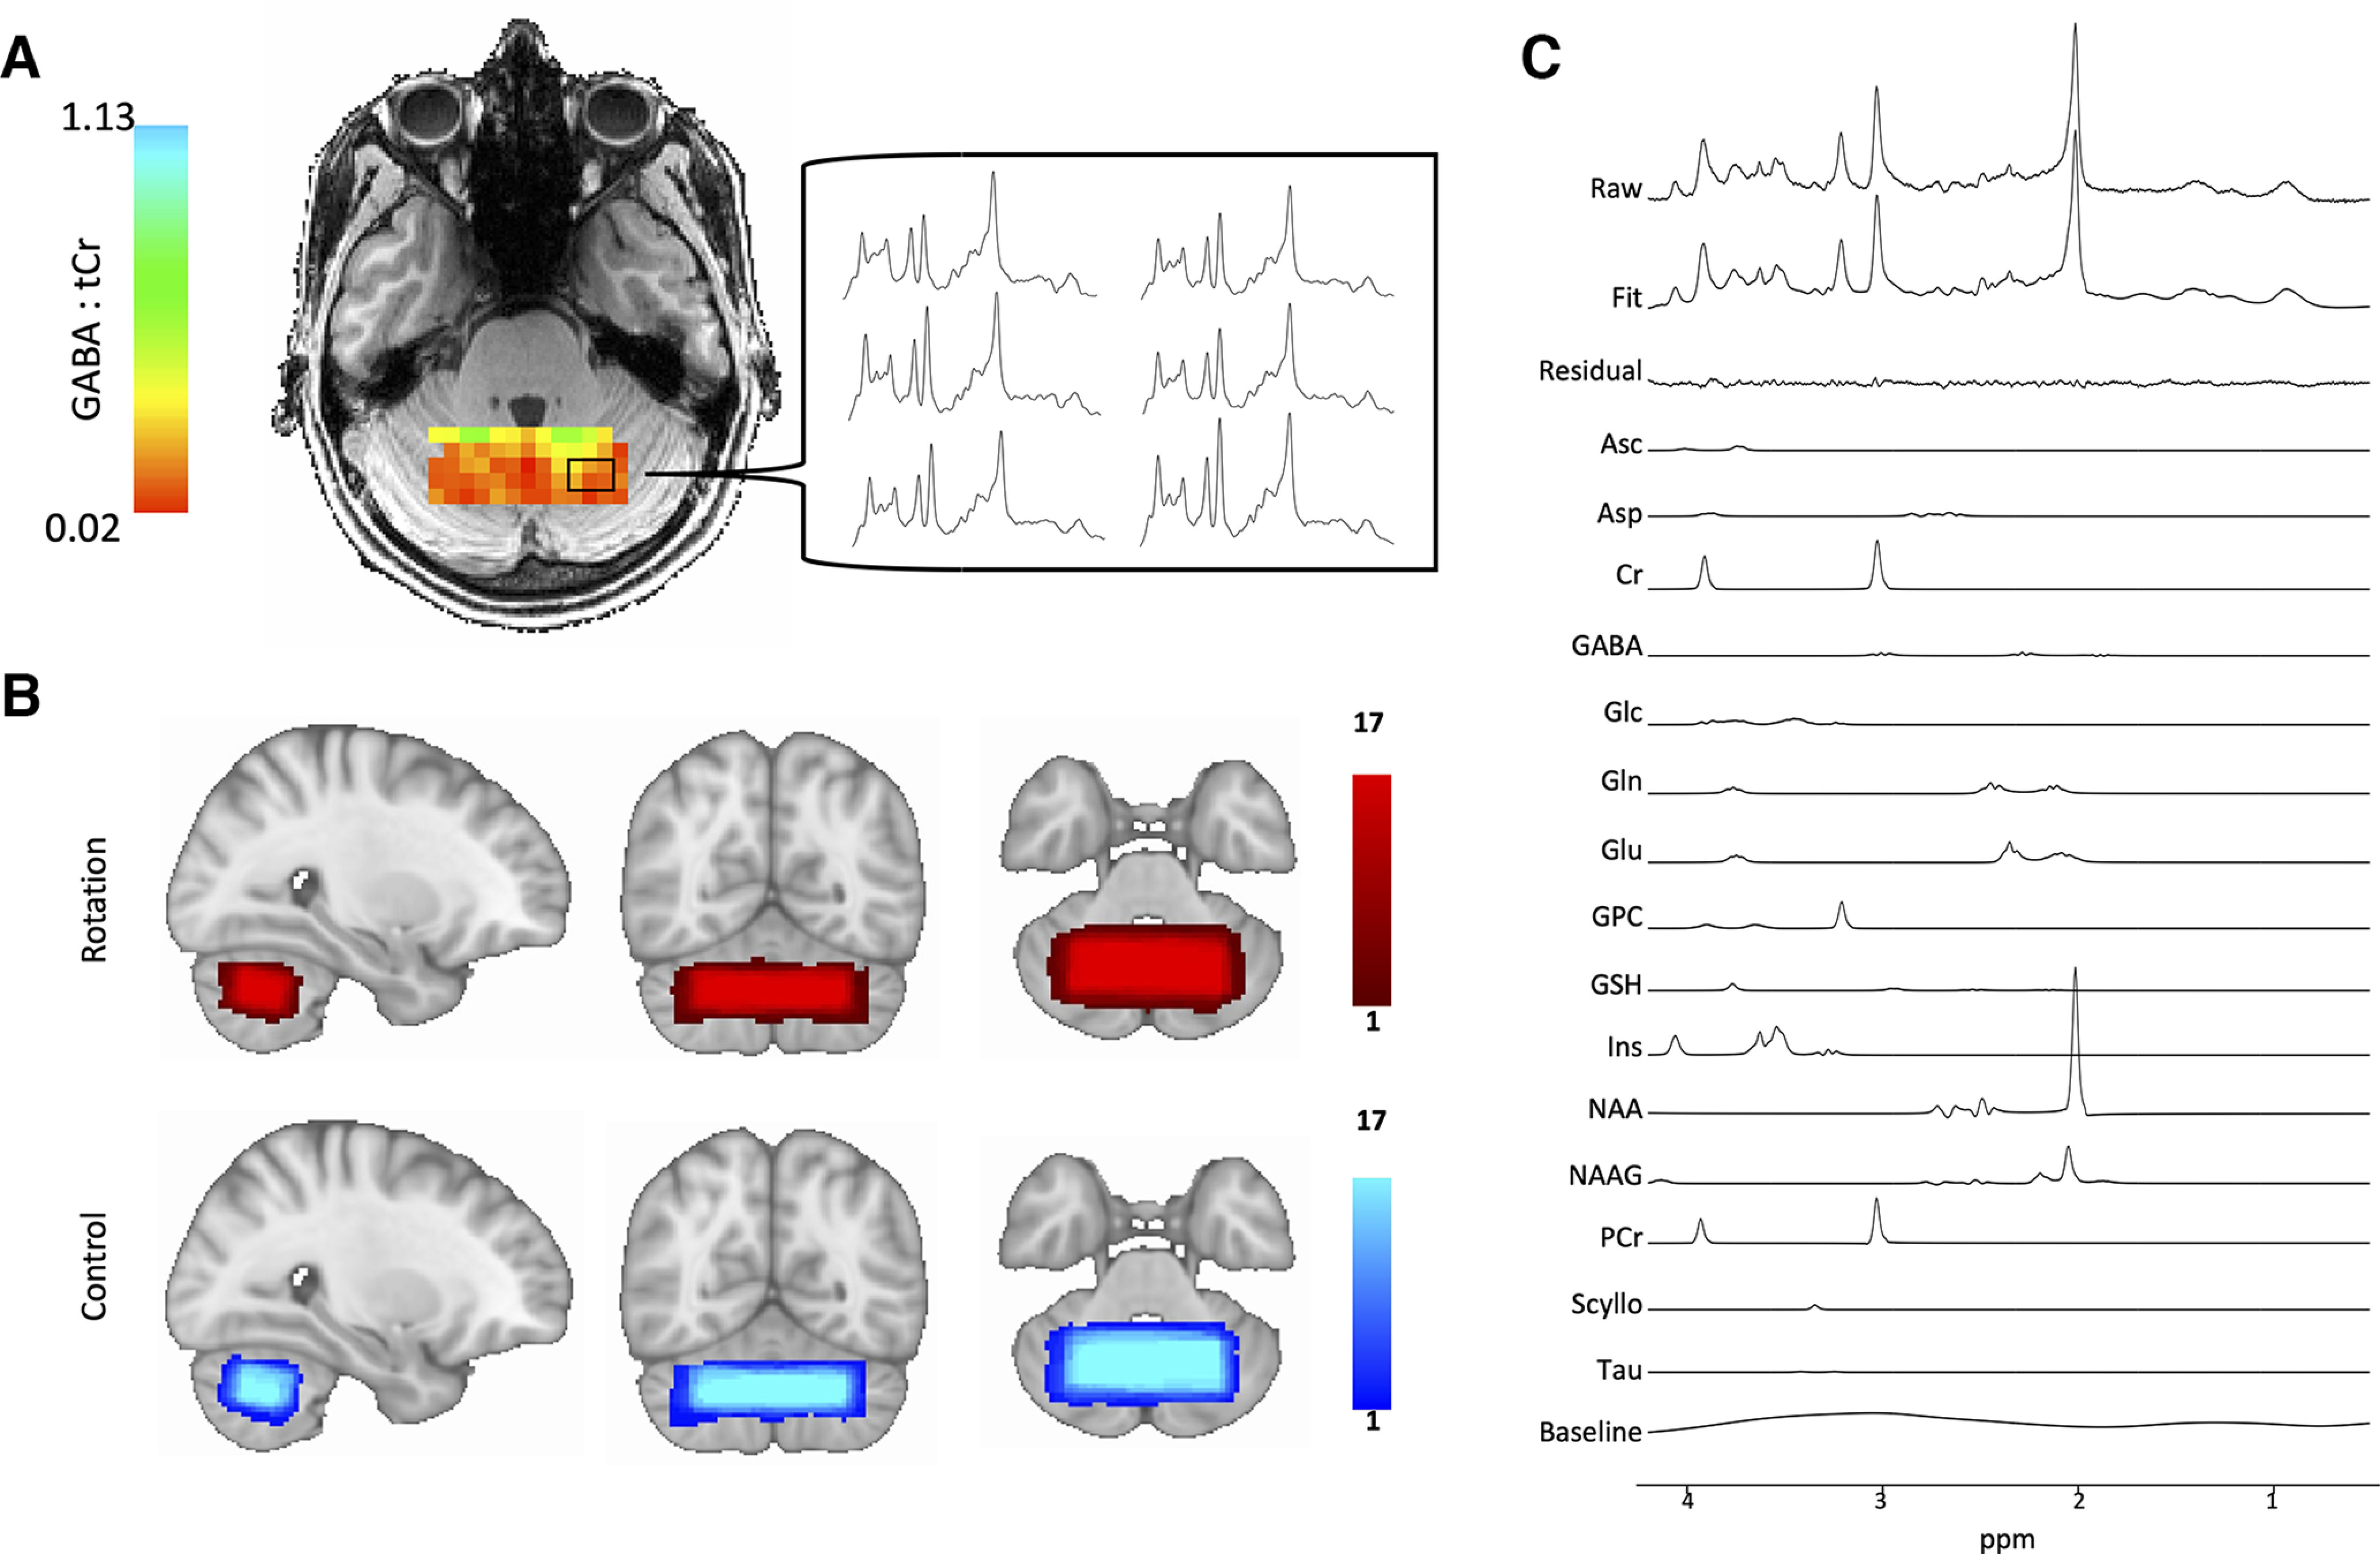
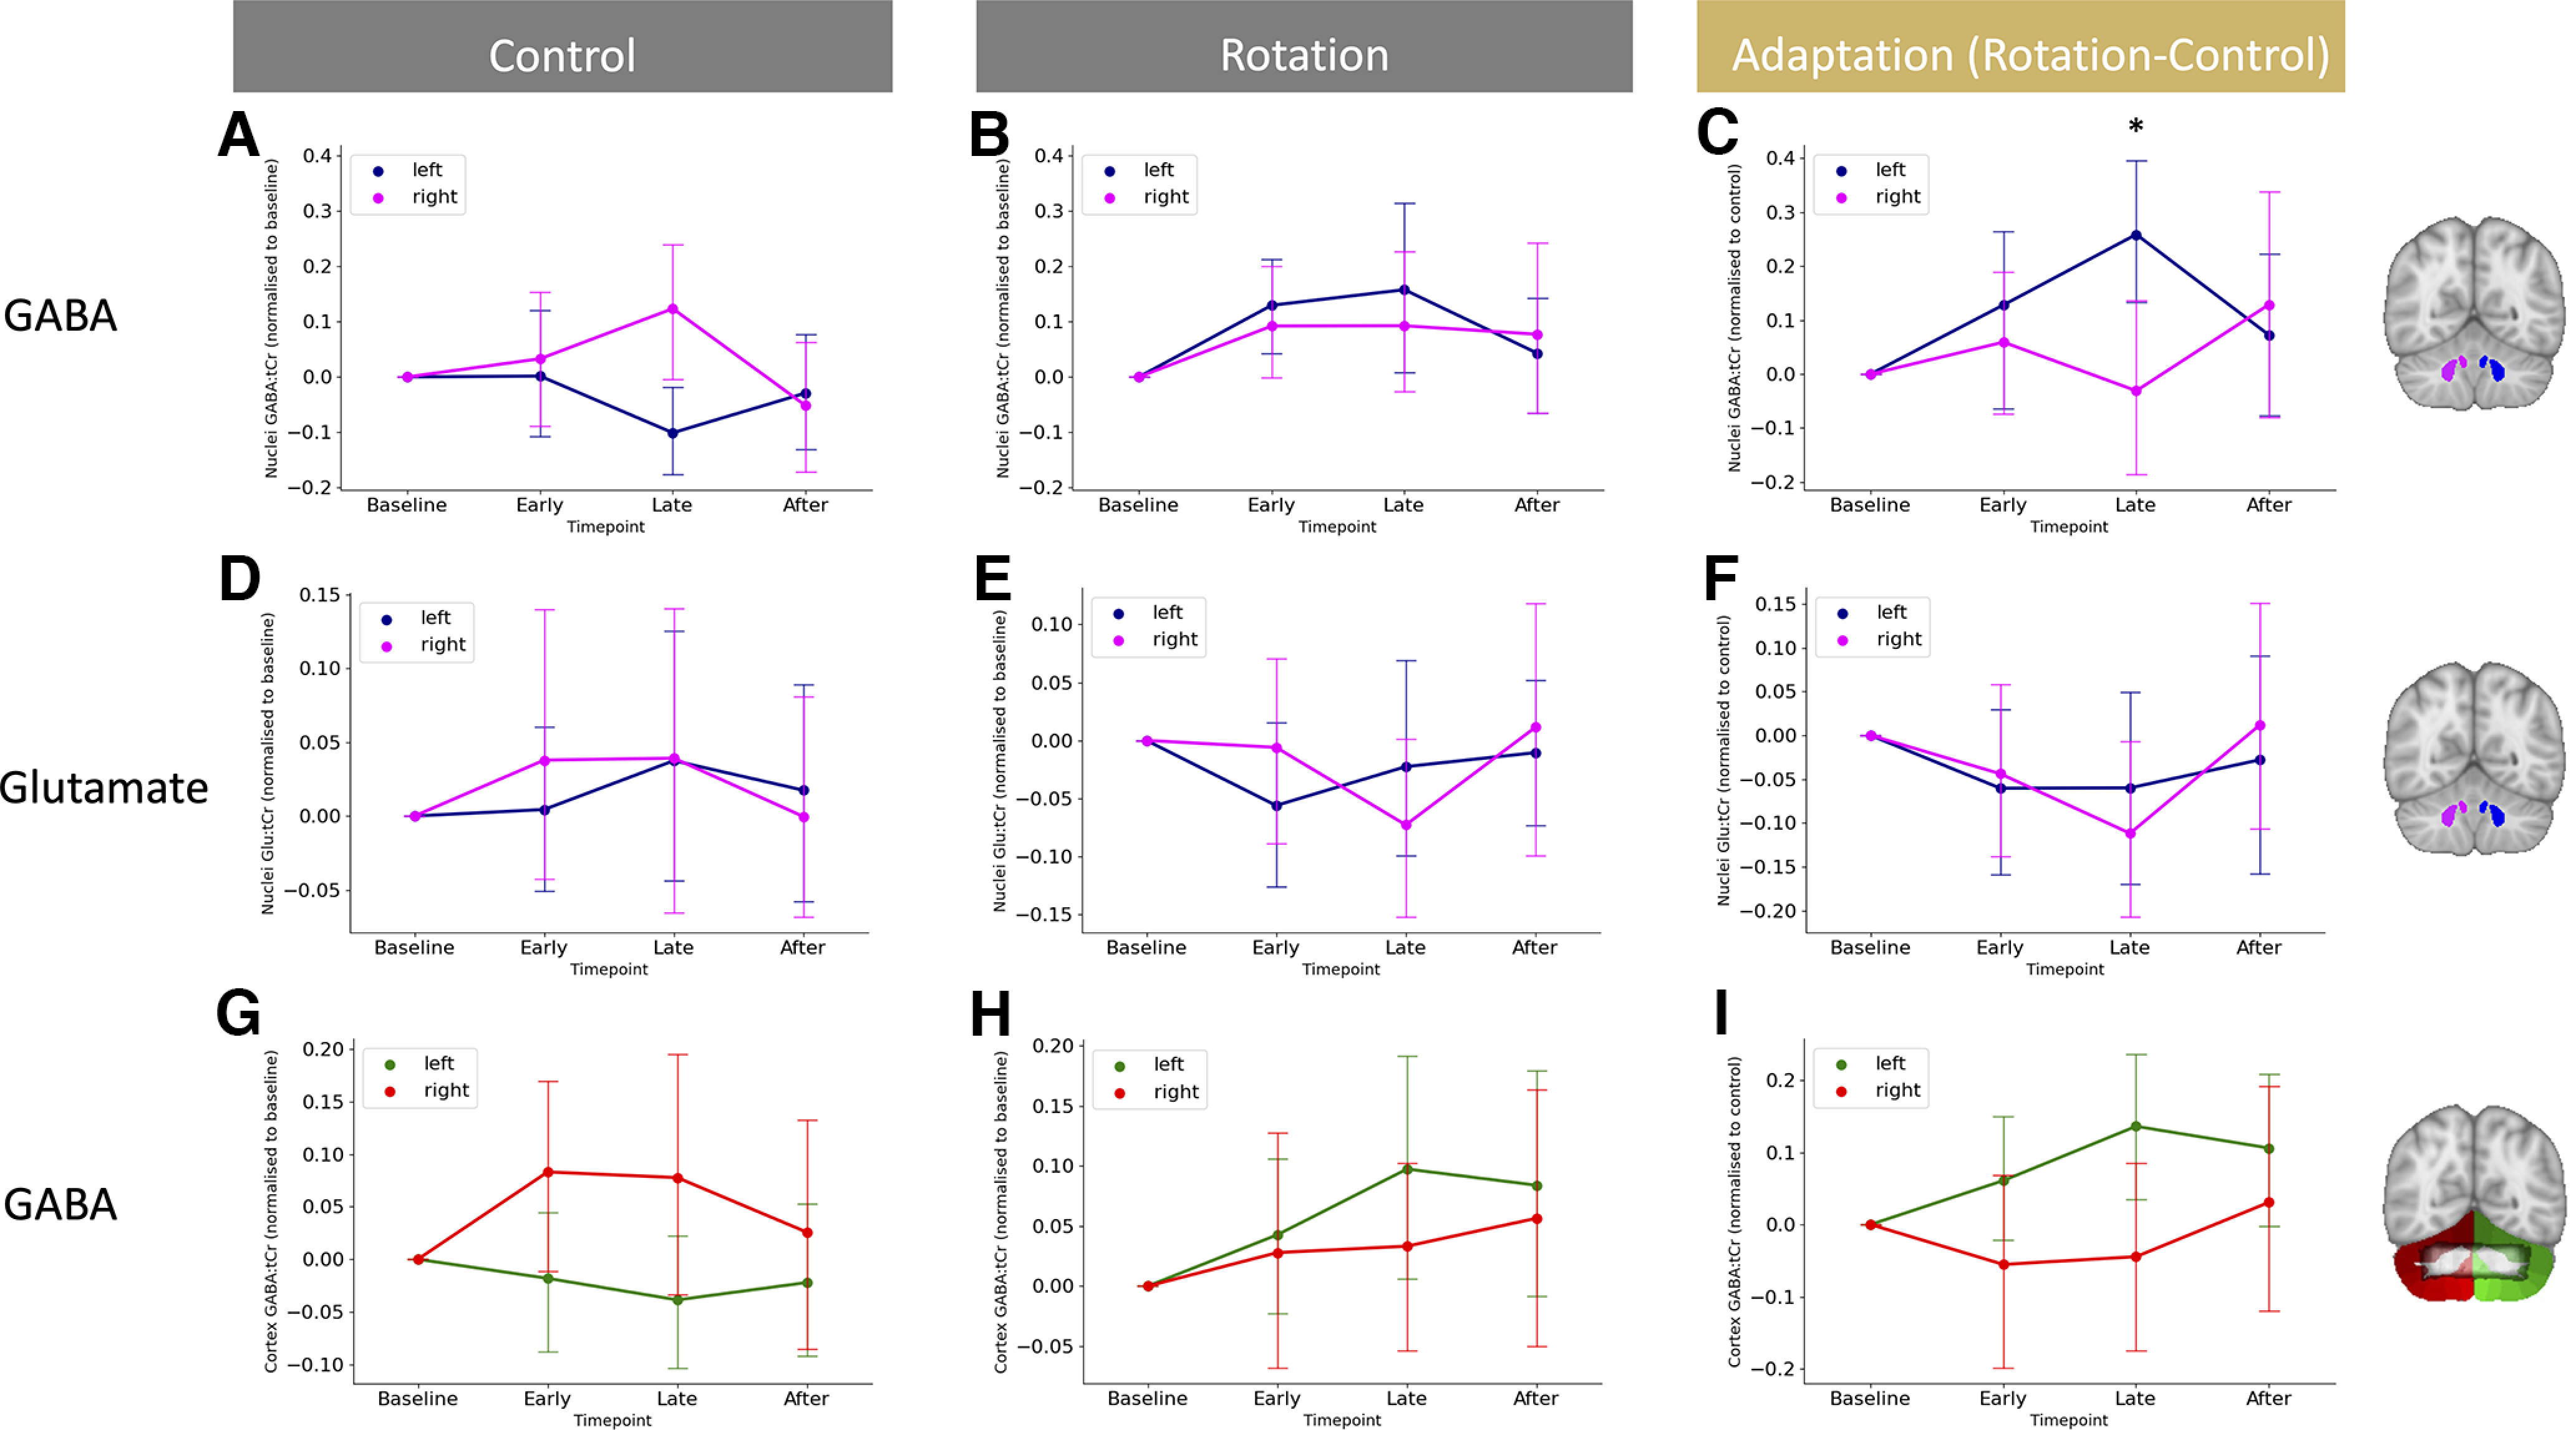
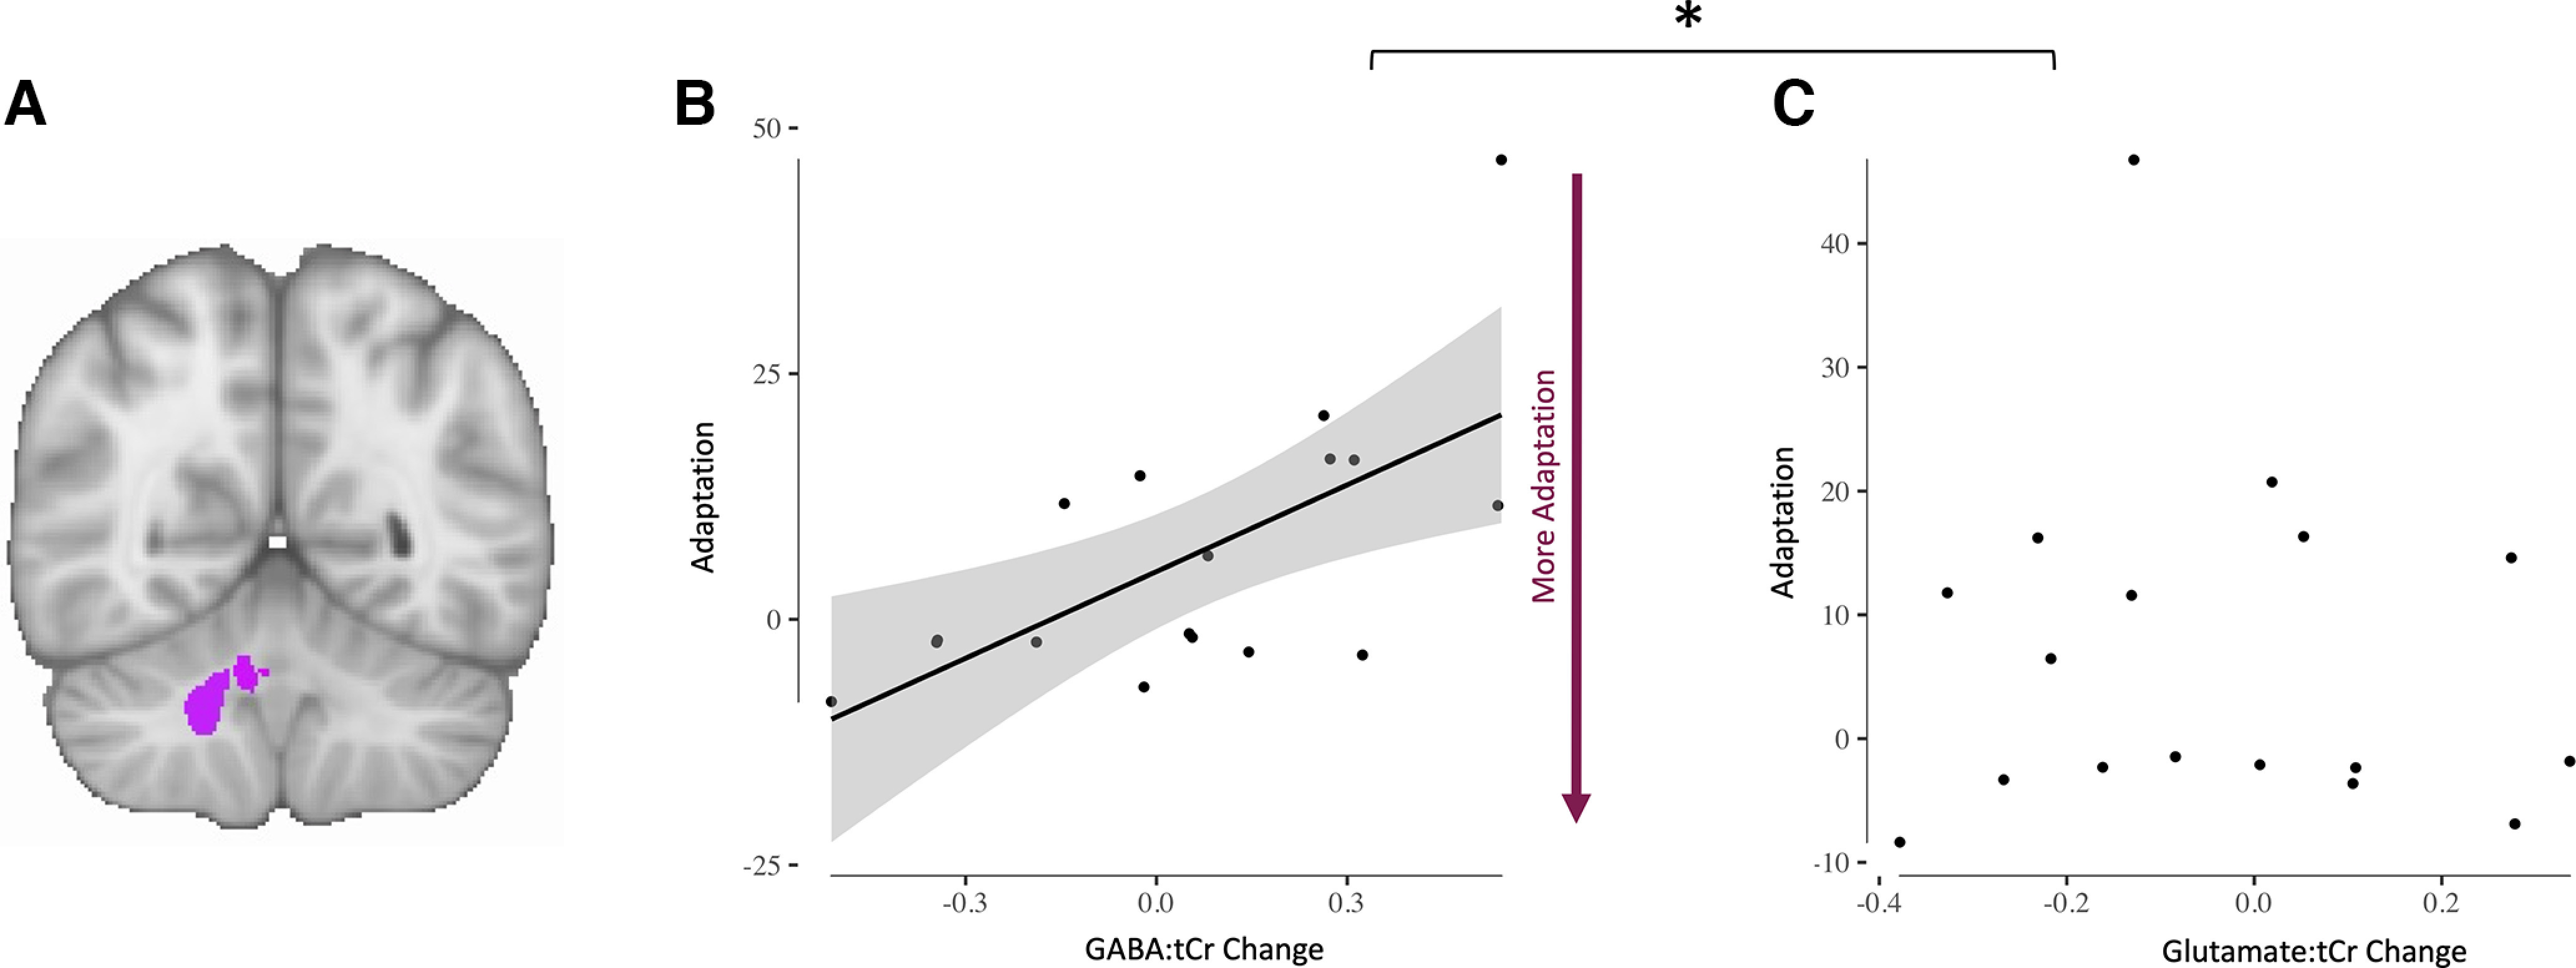
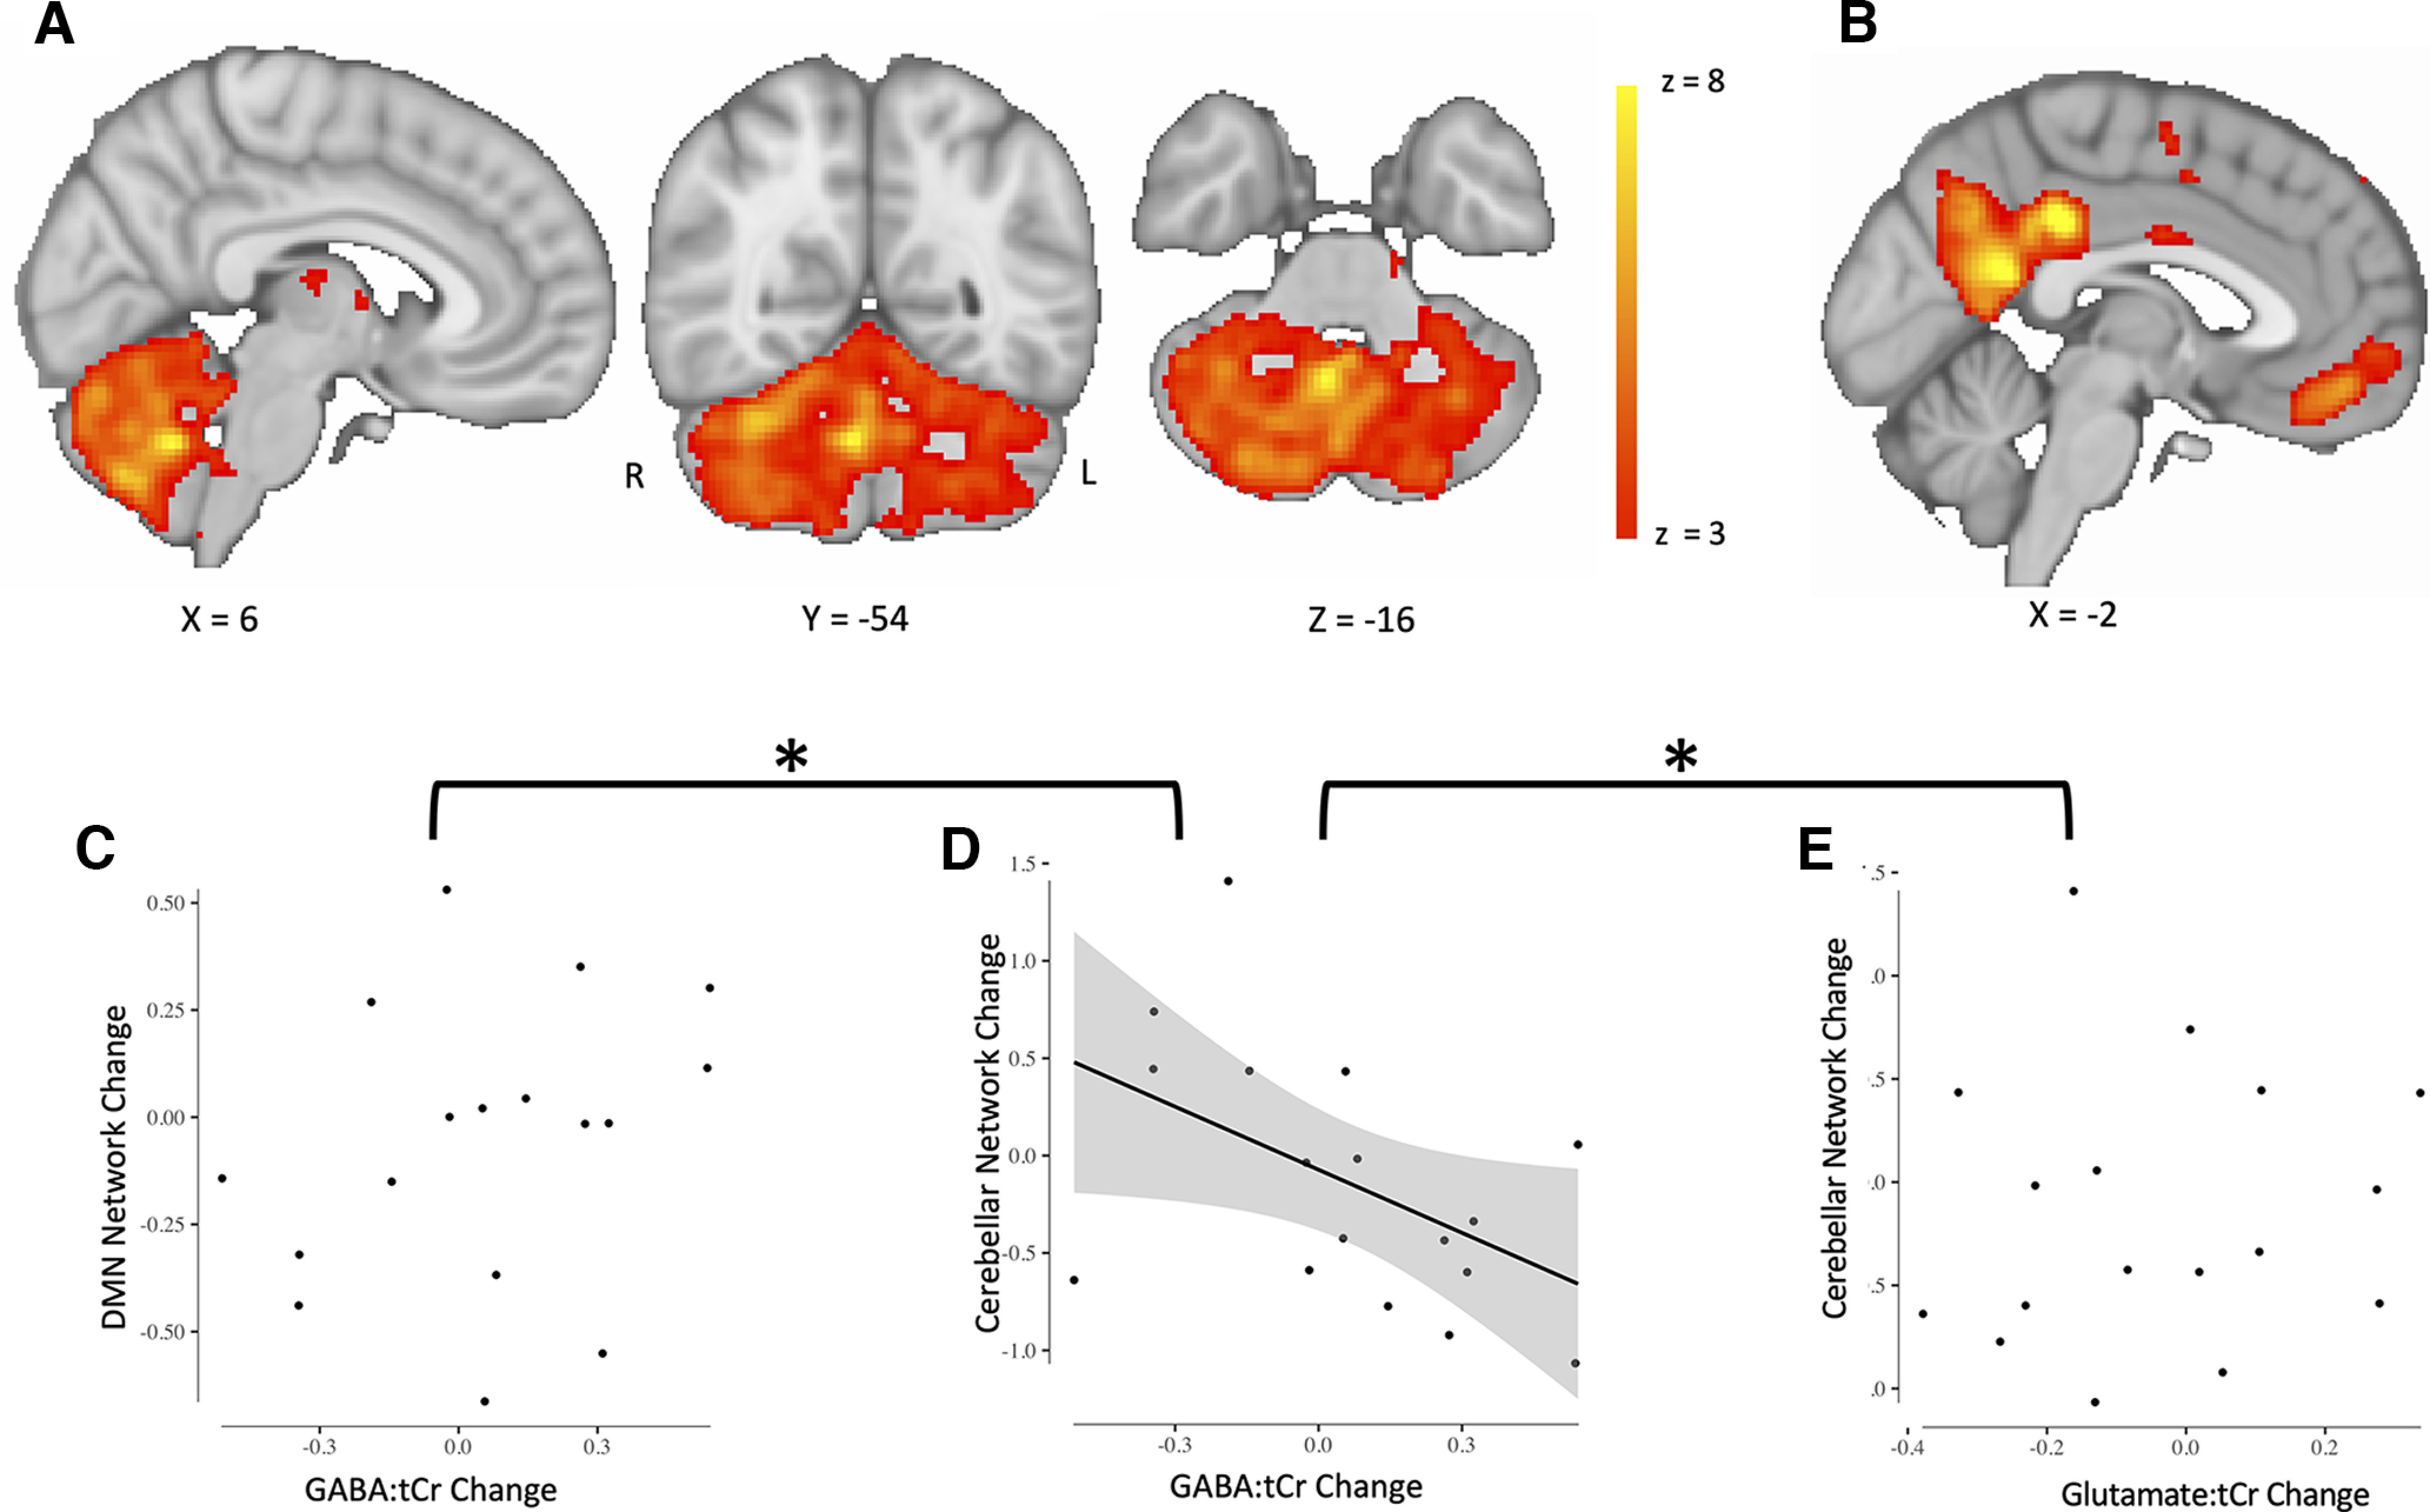
Motor adaptation is crucial for performing accurate movements in a changing environment and relies on the cerebellum. Although cerebellar involvement has been well characterized, the neurochemical changes in the cerebellum underpinning human motor adaptation remain unknown. We used a novel magnetic resonance spectroscopic imaging (MRSI) technique to measure changes in the inhibitory neurotransmitter GABA in the human cerebellum during visuomotor adaptation. Participants (n = 17, six female) used their right hand to adapt to a rotated cursor in the scanner, compared with a control task requiring no adaptation. We spatially resolved adaptation-driven GABA changes at the cerebellar nuclei and cerebellar cortex in the left and the right cerebellar hemisphere independently and found that simple right-hand movements increase GABA in the right cerebellar nuclei and decreases GABA in the left. When isolating adaptation-driven GABA changes, we found that GABA in the left cerebellar nuclei and the right cerebellar nuclei diverged, although GABA change from baseline at the right cerebellar nuclei was not different from zero at the group level. Early adaptation-driven GABA fluctuations in the right cerebellar nuclei correlated with adaptation performance. Participants showing greater GABA decrease adapted better, suggesting early GABA change is behaviorally relevant. Early GABA change also correlated with functional connectivity change in a cerebellar network. Participants showing greater decreases in GABA showed greater strength increases in cerebellar network connectivity. Results were specific to GABA, to adaptation, and to the cerebellar network. This study provides first evidence for plastic changes in cerebellar neurochemistry during motor adaptation. Characterizing these naturally occurring neurochemical changes may provide a basis for developing therapeutic interventions to facilitate human motor adaptation.SIGNIFICANCE STATEMENT Despite motor adaptation being fundamental to maintaining accurate movements, its neurochemical basis remains poorly understood, perhaps because measuring neurochemicals in the human cerebellum is technically challenging. Using a novel magnetic resonance spectroscopic imaging method, this study provides evidence for GABA changes in the left compared with the right cerebellar nuclei driven by both simple movement and motor adaptation. Although right cerebellar GABA changes were not significantly different from zero at the group level, the adaptation-driven GABA fluctuations in the right cerebellar nuclei correlated with adaptation performance and with functional connectivity change in a cerebellar network. These results show the first evidence for plastic changes in cerebellar neurochemistry during a cerebellar learning task. This provides the basis for developing therapeutic interventions that facilitate these naturally occurring changes to amplify cerebellar-dependent learning.

Keywords: GABA; cerebellum; functional connectivity; neuroimaging; spectroscopy; visuomotor adaptation.


Figures

Figure 1.
Figure 1.
Experiment. A, Scanning protocol. T1-weighted structural image was acquired at the beginning of the MRI scan. Resting-state fMRI data were acquired before and after the task. MRSI data were acquired during the task. Four MRSI scans were acquired during performance of the visuomotor task with each MRSI scan lasting 9 min, total acquisition time 36 min. B, Behavioral data. Participants used a joystick to shoot targets on a screen. Participants began by performing 136 trials with no rotation imposed serving as the baseline in both conditions. In the rotation condition (red blocks), stepwise increase in rotated visual feedback required participants to adapt movements to reduce errors. One block at each angle and each block consisted of 40 trials of 4 s duration each. The numbers in the red and blue boxes indicate the degree to which the visual feedback was rotated, with 0° indicating no rotation. The imposed rotation reached a maximum of 80°, after which visual feedback was removed for four blocks of 40 trials each (blocks with crossed-out eye). In the control session (blue blocks), participants performed the task without any rotation imposed but for the same length (480 trials in total for the main task). The rotation was washed out after task (144 trials, no rotation). The task was practiced before the main task outside of the scanner (32 trials, no rotation; data not shown). Behavioral data are shown as angular error at each trial averaged across participants. Shaded area represents SEM. Rotation condition error is shown in red. Control condition error is shown in blue. Target sequence was fixed across participants and across sessions. C, Task schematic. Left, MR-compatible joystick used to record participant responses. Middle, Eight possible target locations (yellow) centered radially around the cursor (red) at its starting position. Right, Schematic of a rotation trial. Cursor (red) is first presented at the center starting position. Target (yellow) appears at one of the eight possible target locations. Participant makes a center-out movement toward the target but sees clockwise-rotated visual feedback.
Figure 2.
Figure 2.
Cerebellar magnetic resonance spectroscopic imaging. A, Representative GABA map. Image shows representative GABA map for one subject after quality control thresholding including the individual MRSI spectra from six voxels that allow quantification of GABA concentration in each voxel. Left, Color bars show GABA:tCr concentration in each voxel. B, Voxel placement. MRSI voxel overlap maps for the two conditions. A 65 × 25 × 15 mm3 MRSI slab placed over the anterior and superior areas of the cerebellum so that it optimally covers the right-hand motor representation. Right, Color bars indicate number of participants. C, Spectral fit. Image shows representative spectra of one subject including LCModel fit. Metabolite basis spectra have been scaled using LCModel so that a linear combination of the basis spectra, the residual, and the baseline best fits the raw measured spectrum. Top, Measured raw spectrum. Bottom, LCModel fit. GABA metabolite peaks appear at 1.89, 2.29, and 3.01 ppm.
Figure 3.
Figure 3.
Isolating adaptation reveals GABA diverges in the left and right cerebellar nuclei. A, GABA changes in the cerebellar nuclei during movement execution. Shown are GABA values normalized to baseline in the control condition. B, No GABA changes in in the left and right cerebellar nuclei while participants are in the rotation condition. Shown are GABA values normalized to baseline in the rotation condition. C, Adaptation-driven GABA changes in the left and right cerebellar nuclei. Against a backdrop of GABA changes related to simple movement execution, GABA diverges in the left and right cerebellar nuclei driven by adaptation. DF, Glutamate does not change in the left and right cerebellar nuclei during the control condition (D), rotation condition (E), or when isolating adaptation (F). G–I, GABA does not change in the left and right cerebellar cortex during the control condition (G), rotation condition (H), or when isolating adaptation (I). For visualization purposes, data in left and middle columns are shown normalized to baseline. Statistics for control and rotation data were conducted on raw, non-normalized data. Statistics testing for adaptation-driven changes were calculated on rotation data normalized to control data. The inset in I shows the overlap between cerebellar cortex ROI for the left (green) and the right (red) with an overlay mask of the MRSI slab from all sessions (shown in black at 50% opacity). The MRSI slab overlaps with the hand representation in lobule VI bilaterally and in the right lobule V. Error bars show ± standard error. Asterisk (*) indicates significant point times hemisphere interaction in isolated adaptation.
Figure 4.
Figure 4.
Adaptation-driven early GABA change correlates with adaptation. A, Right cerebellar nuclei ROI. B, GABA change in right cerebellar nuclei correlates with adaptation (r = 0.64, p = 0.006). Each dot represents one participant. Shading indicates 95% confidence bounds of the relationship. C, Glutamate change in right cerebellar nuclei does not correlate with adaptation (r = −0.10, p = 0.693). Each dot represents one participant. Line of best fit is not plotted for this correlation because the correlation is not significant. The asterisk (*) Indicates that the relationships were significantly different (GABA change vs glutamate change relationship; zdiff = 2.27, p = 0.011).
Figure 5.
Figure 5.
Adaptation-driven GABA changes correlate with cerebellar connectivity change. A, Cerebellar network. Cerebellar network that has previously been found to increase in connectivity after adaptation is shown in red-yellow. Right, Color bar indicates range of z values in voxels. Brain slices are shown according to radiology convention; left hemisphere is shown on the right, indicated by R (right) and L (left) surrounding the coronal slice. B, The DMN was chosen as a control network. C, Change in default mode network strength does not correlate with GABA change in right cerebellar nuclei (r = 0.2707, p = 0.29). Data points represent individual participants. Line of best fit is not plotted for this correlation because the correlation is not significant. D, Change in cerebellar network strength correlates with GABA change in right cerebellar nuclei. Participants who show a greater decrease in early GABA in the right cerebellar nuclei also show a larger increase in cerebellar network strength (r = −0.4939, p = 0.0439). Cerebellar network strength decreases in participants who show an increase in GABA in the right cerebellar nuclei. Data points represent individual participants. Plot shows line of best fit for correlation and 95% confidence interval. C–E, Change in cerebellar network strength does not correlate with glutamate change in right cerebellar nuclei (r = 0.09, p = 0.71). Data points represent individual participants. Line of best fit is not plotted for this correlation because the correlation is not significant. The asterisk (*) indicates significant difference between correlations shown in C and in D as well as in D and E. The correlation coefficient of cerebellar network change and GABA change was significantly different from the correlation coefficient of DMN change and GABA change (zdiff = −2.17, p = 0.015). The correlation coefficient of cerebellar network change and GABA change was also significantly different from the correlation coefficient of cerebellar network change and glutamate change (zdiff = −1.69, p = 0.0459).

References

    1. Albert NB, Robertson EM, Miall RC (2009) The resting human brain and motor learning. Curr Biol 19:1023–1027. 10.1016/j.cub.2009.04.028 - DOI - PMC - PubMed
    1. Albus JS (1971) A theory of cerebellar function. Math Biosci 10:25–61. 10.1016/0025-5564(71)90051-4 - DOI
    1. Alfaro-Almagro F, et al. . (2018) Image processing and quality control for the first 10,000 brain imaging datasets from UK Biobank. Neuroimage 166:400–424. 10.1016/j.neuroimage.2017.10.034 - DOI - PMC - PubMed
    1. Andersson JLR, Jenkinson M, Smith S (2007) Non-linear registration aka spatial normalisation. FMRIB Technical Report TRO7JA2. Available at https://www.fmrib.ox.ac.uk/datasets/techrep/tr07ja2/tr07ja2.pdf.
    1. Andersson JD, Matuskey D, Finnema SJ (2019) Positron emission tomography imaging of the γ-aminobutyric acid system. Neurosci Lett 691:35–43. 10.1016/j.neulet.2018.08.010 - DOI - PubMed

Publication types

Substances