

Differential Alterations in Striatal Direct and Indirect Pathways Mediate Two Autism-like Behaviors in Valproate-Exposed Mice
- PMID: 36414013
- PMCID: PMC9581566
- DOI: 10.1523/JNEUROSCI.0623-22.2022
Differential Alterations in Striatal Direct and Indirect Pathways Mediate Two Autism-like Behaviors in Valproate-Exposed Mice
Abstract
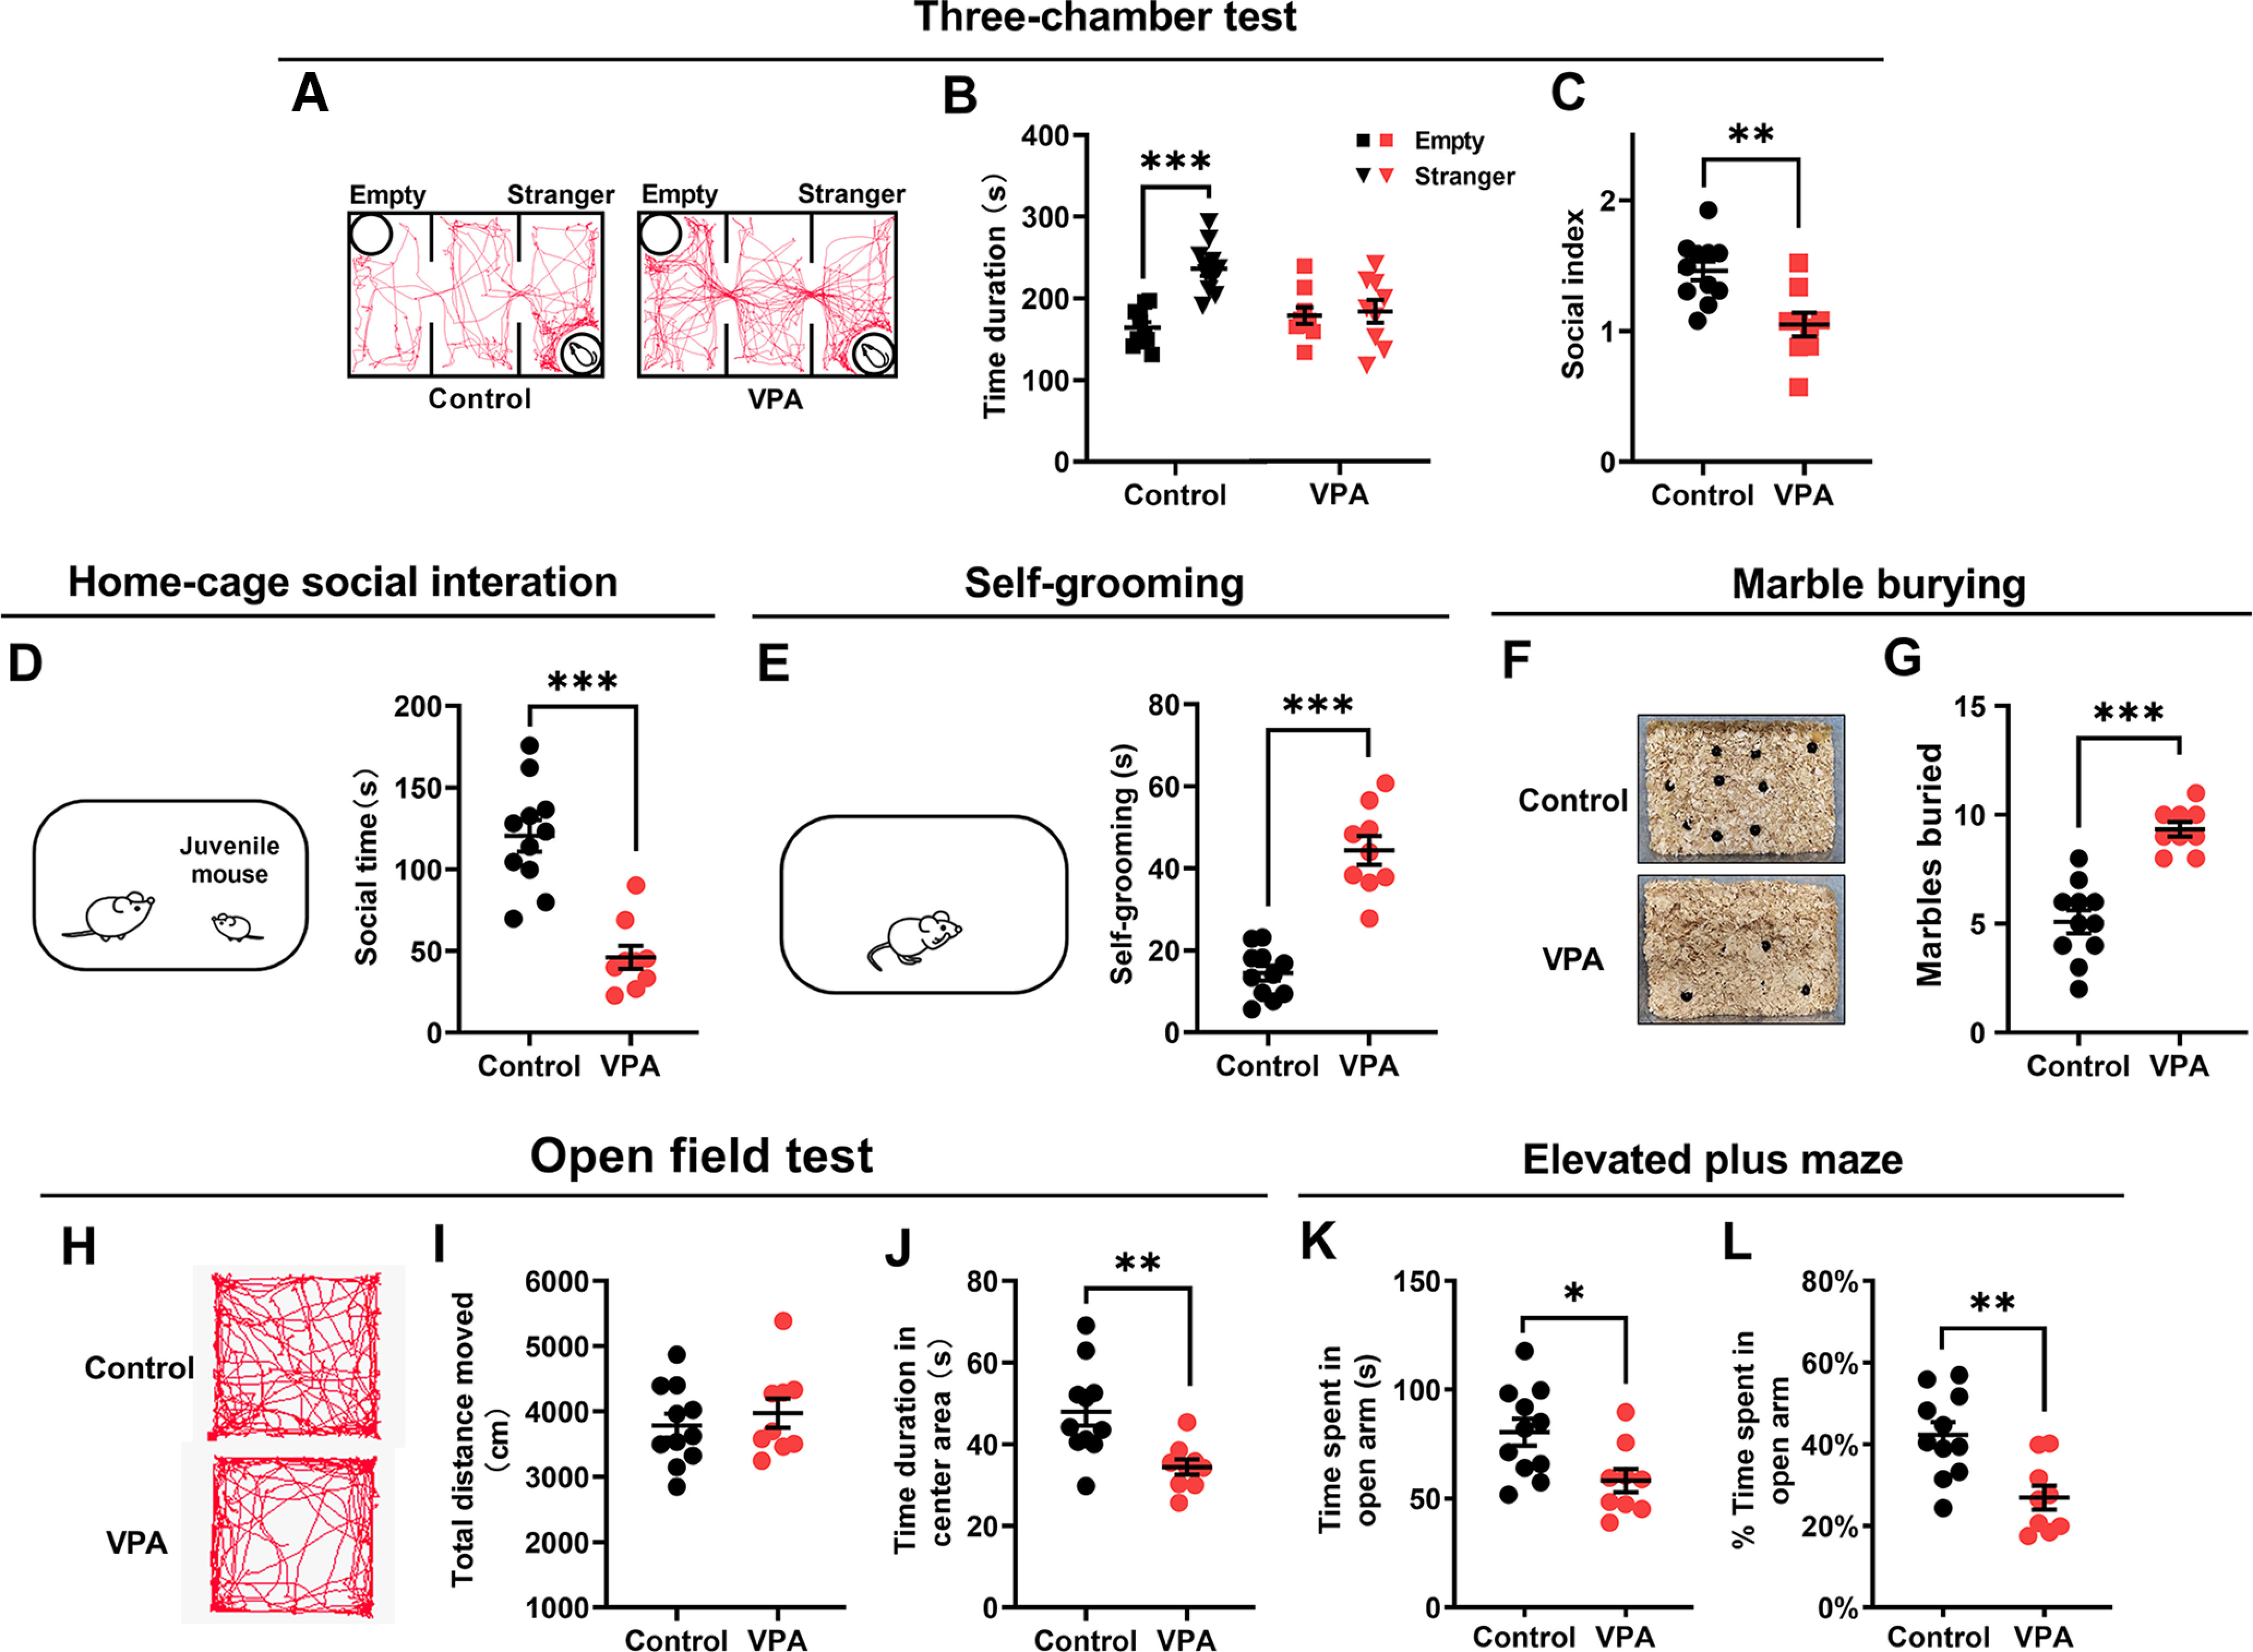
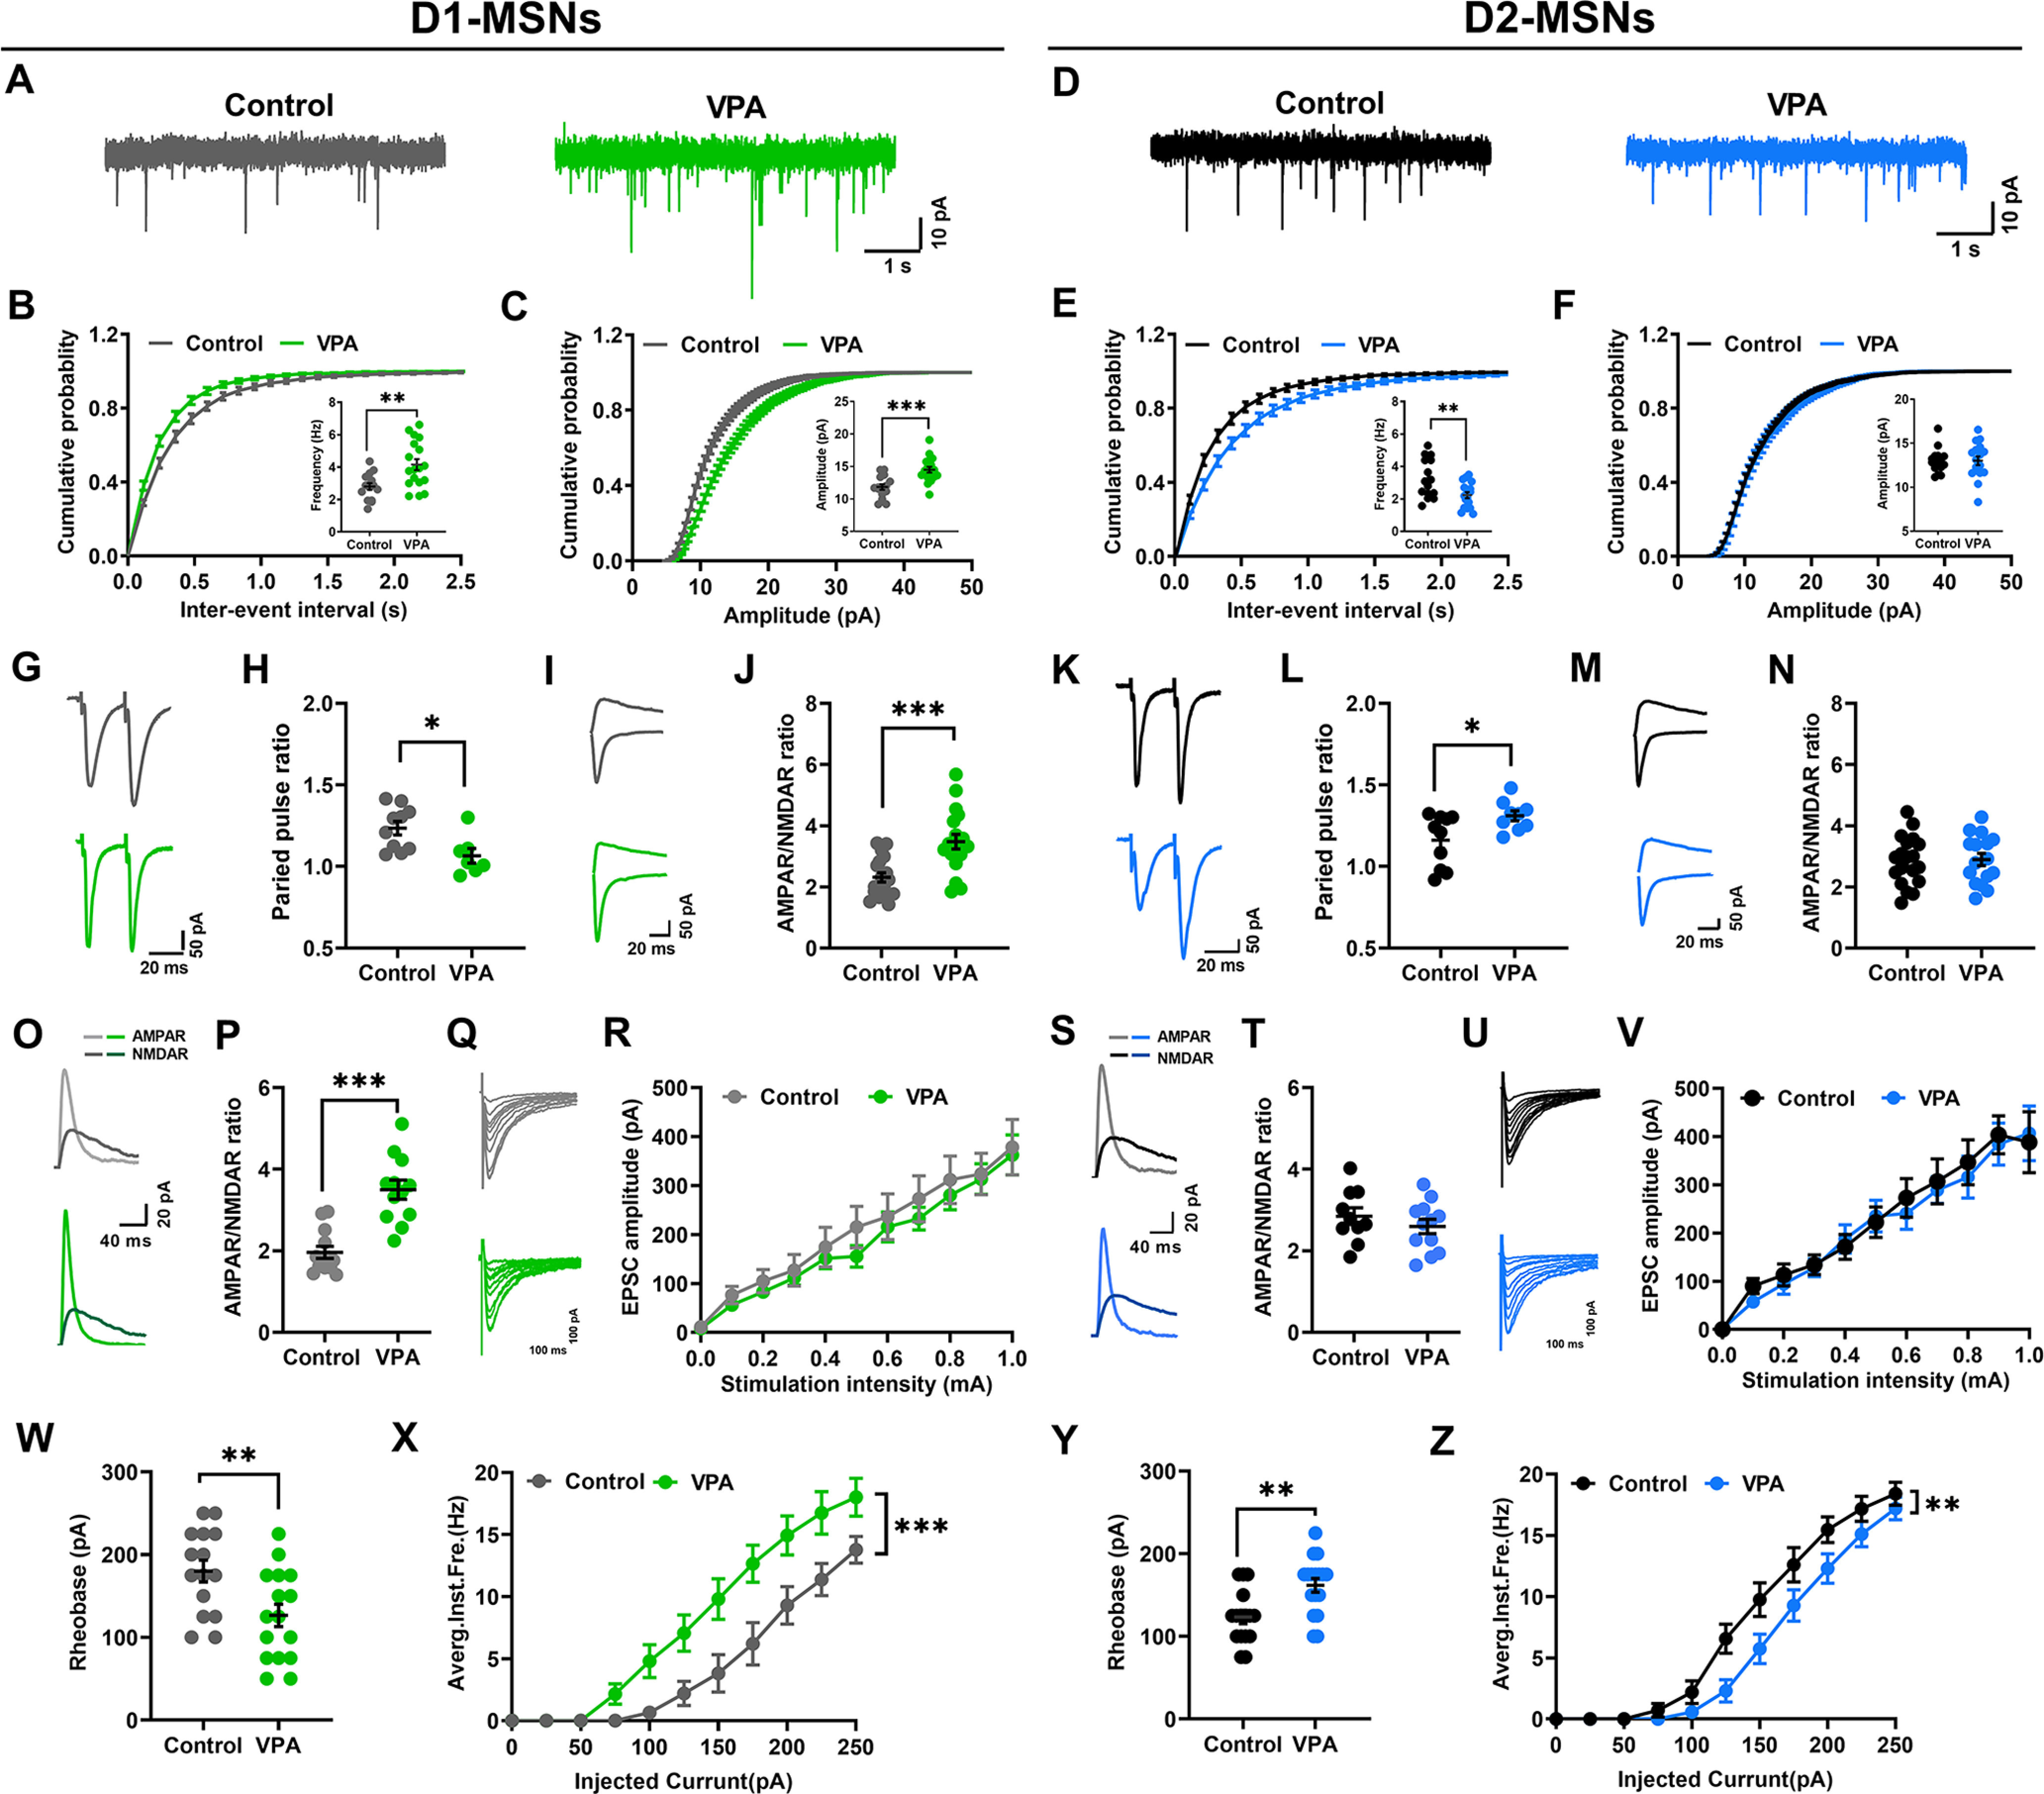
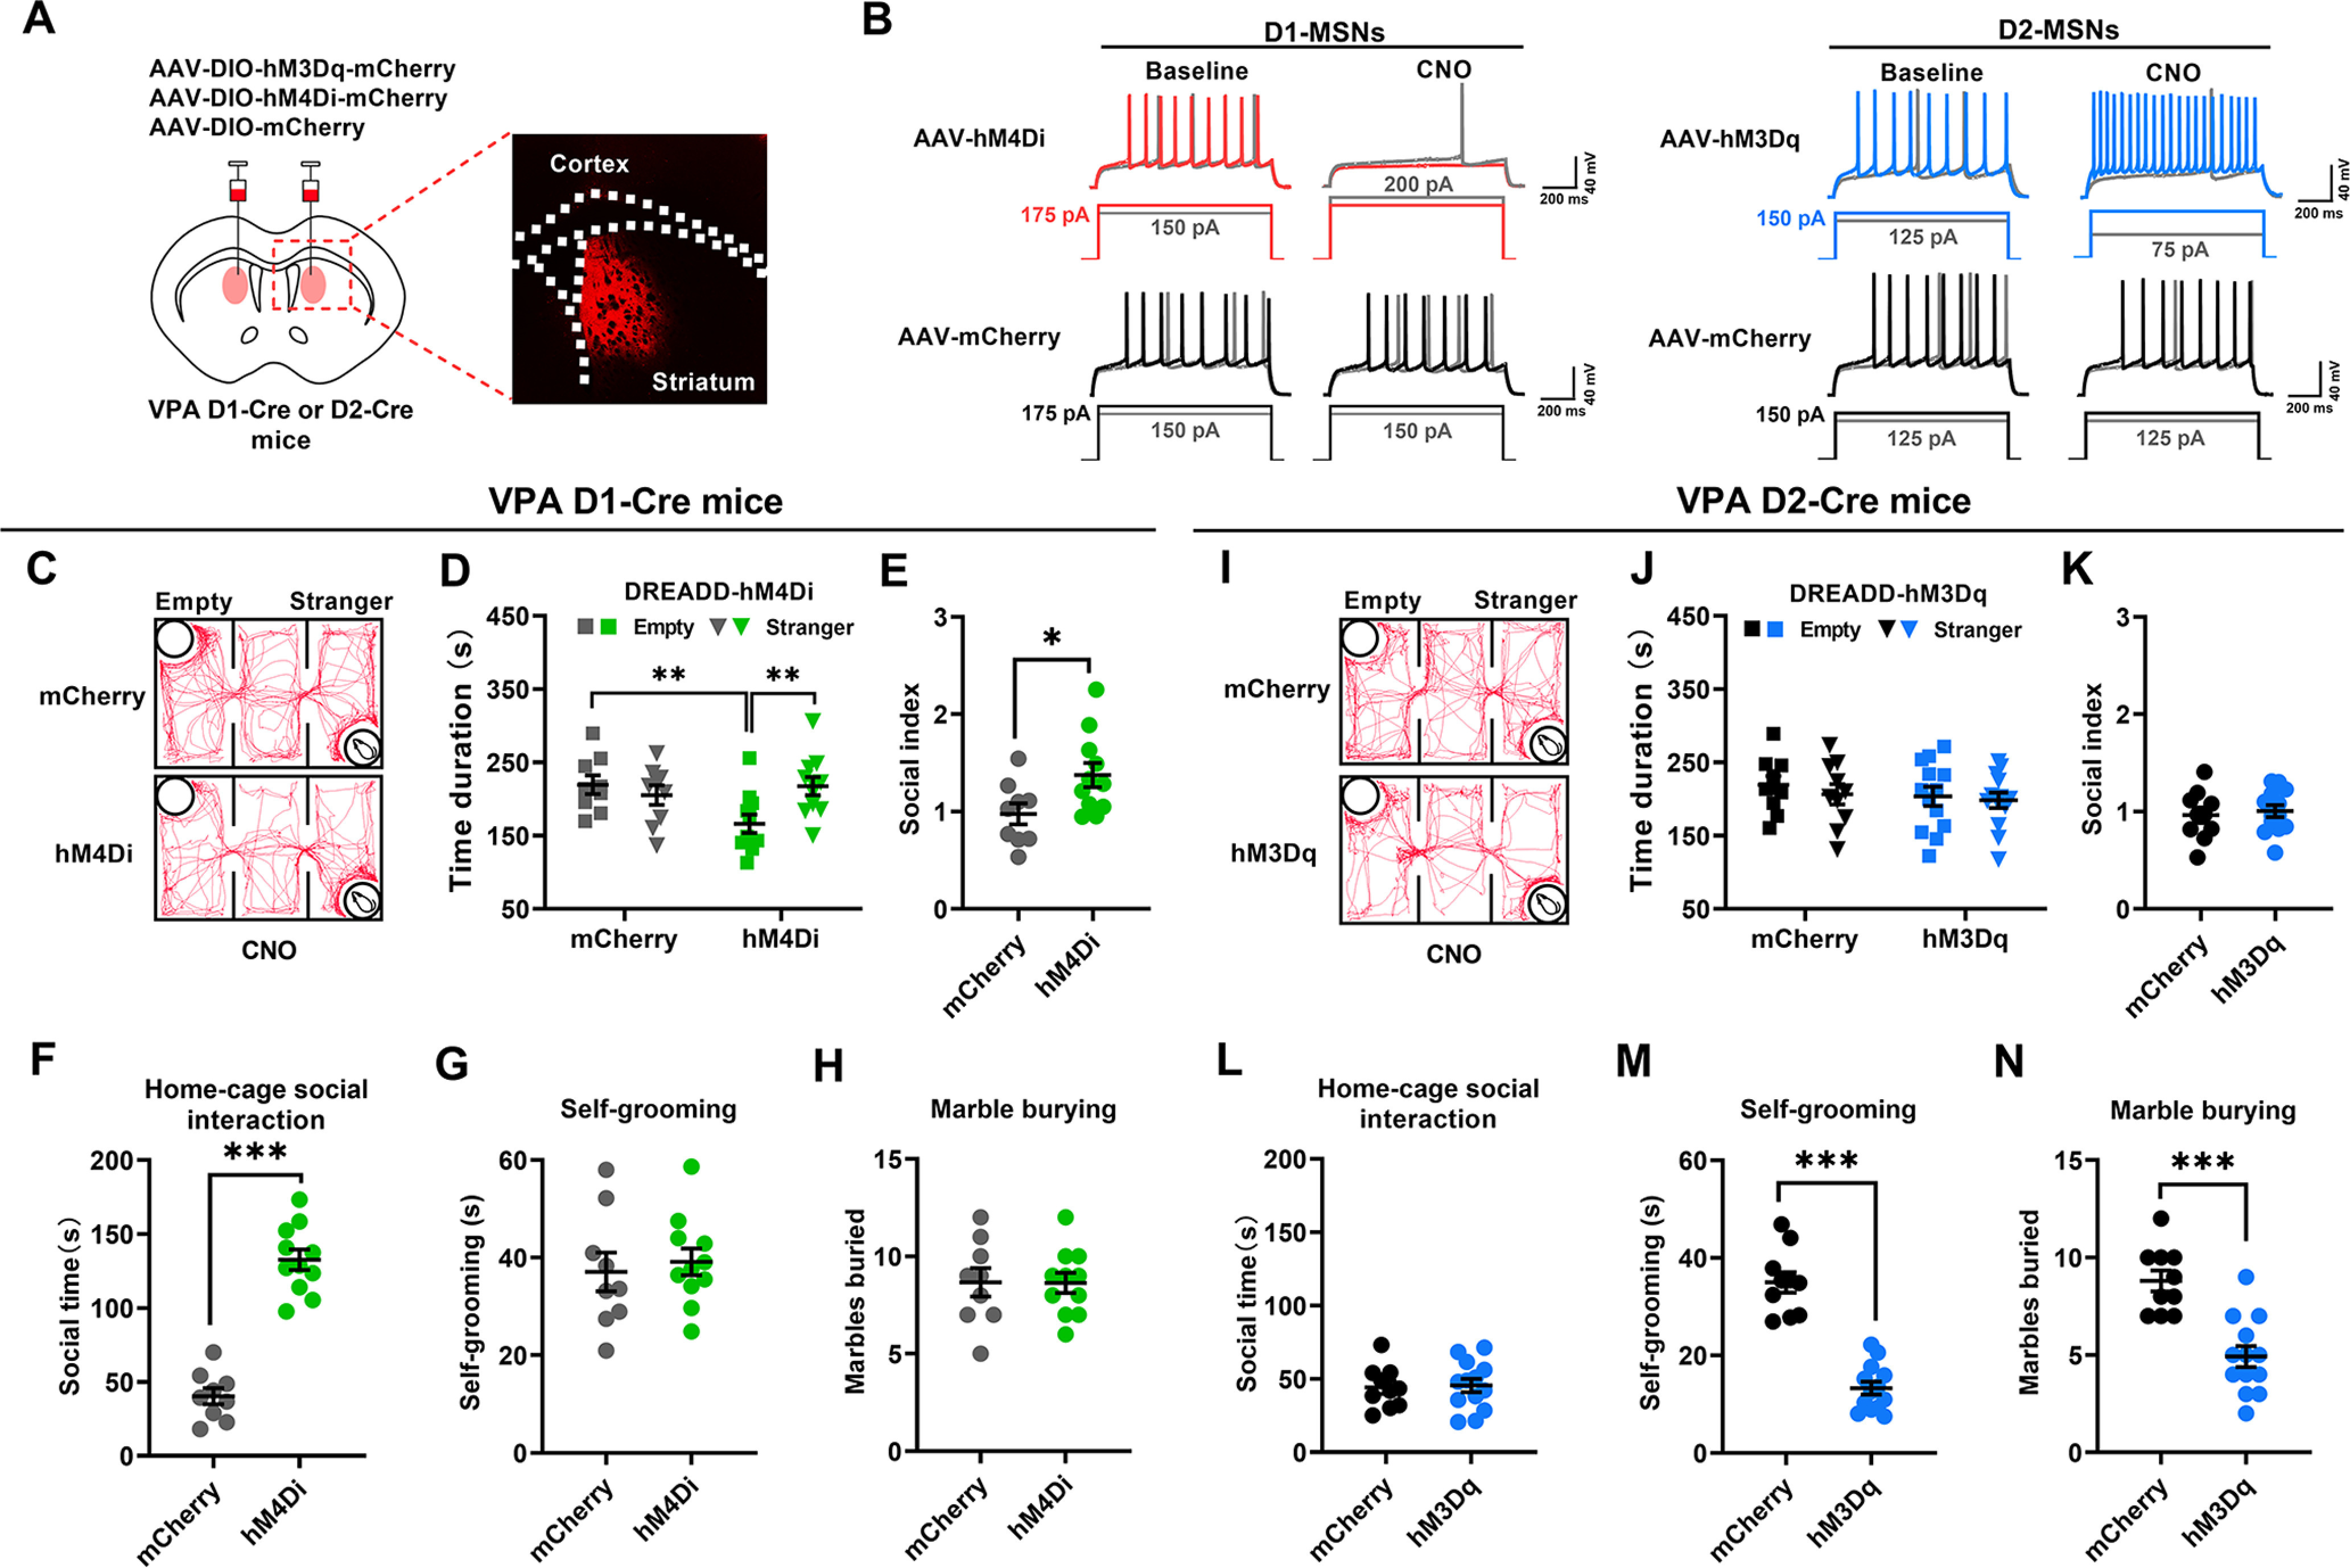
Autism is characterized by two key diagnostic criteria including social deficits and repetitive behaviors. Although recent studies implicated ventral striatum in social deficits and dorsal striatum in repetitive behaviors, here we revealed coexisting and opposite morphologic and functional alterations in the dorsostriatal direct and indirect pathways, and such alterations in these two pathways were found to be responsible, respectively, for the two abovementioned different autism-like behaviors exhibited by male mice prenatally exposed to valproate. The alteration in direct pathway was characterized by a potentiated state of basal activity, with impairment in transient responsiveness of D1-MSNs during social exploration. Concurrent alteration in indirect pathway was a depressed state of basal activity, with enhancement in transient responsiveness of D2-MSNs during repetitive behaviors. A causal relationship linking such differential alterations in these two pathways to the coexistence of these two autism-like behaviors was demonstrated by the cell type-specific correction of abnormal basal activity in the D1-MSNs and D2-MSNs of valproate-exposed mice. The findings support those differential alterations in two striatal pathways mediate the two coexisting autism-like behavioral abnormalities, respectively. This result will help in developing therapeutic options targeting these circuit alterations.SIGNIFICANCE STATEMENT Autism is characterized by two key diagnostic criteria including social deficits and repetitive behaviors. Although a number of recent studies have implicated ventral striatum in social deficits and dorsal striatum in repetitive behaviors, but social behaviors need to be processed by a series of actions, and repetitive behaviors, especially the high-order repetitive behaviors such as restrictive interests, have its scope to cognitive and emotional domains. The current study, for the first time, revealed that prenatal valproate exposure induced coexisting and differential alterations in the dorsomedial striatal direct and indirect pathways, and that these alterations mediate the two coexisting autism-like behavioral abnormalities, respectively. This result will help in developing therapeutic options targeting these circuit alterations to address the behavioral abnormalities.
Keywords: D1-MSNs; D2-MSNs; autism; striatum; valproate.
Copyright © 2022 the authors.
Figures


Similar articles
-
Potentiation of Nigra-Striatal Dopaminergic Projection Underpins Core Autism-Like Behaviors in Valproate-Exposed Mice.J Neurosci. 2025 Sep 3;45(36):e0382252025. doi: 10.1523/JNEUROSCI.0382-25.2025. J Neurosci. 2025. PMID: 40769723
-
Role of Striatal Direct Pathway 2-Arachidonoylglycerol Signaling in Sociability and Repetitive Behavior.Biol Psychiatry. 2018 Aug 15;84(4):304-315. doi: 10.1016/j.biopsych.2017.11.036. Epub 2017 Dec 28. Biol Psychiatry. 2018. PMID: 29458998 Free PMC article.
-
Ventrolateral Striatal Medium Spiny Neurons Positively Regulate Food-Incentive, Goal-Directed Behavior Independently of D1 and D2 Selectivity.J Neurosci. 2017 Mar 8;37(10):2723-2733. doi: 10.1523/JNEUROSCI.3377-16.2017. Epub 2017 Feb 6. J Neurosci. 2017. PMID: 28167674 Free PMC article.
-
Striatal Circuits as a Common Node for Autism Pathophysiology.Front Neurosci. 2016 Feb 9;10:27. doi: 10.3389/fnins.2016.00027. eCollection 2016. Front Neurosci. 2016. PMID: 26903795 Free PMC article. Review.
-
Reappraising striatal D1- and D2-neurons in reward and aversion.Neurosci Biobehav Rev. 2016 Sep;68:370-386. doi: 10.1016/j.neubiorev.2016.05.021. Epub 2016 May 24. Neurosci Biobehav Rev. 2016. PMID: 27235078 Review.
Cited by
-
Striatal insights: a cellular and molecular perspective on repetitive behaviors in pathology.Front Cell Neurosci. 2024 Mar 27;18:1386715. doi: 10.3389/fncel.2024.1386715. eCollection 2024. Front Cell Neurosci. 2024. PMID: 38601025 Free PMC article. Review.
-
Editorial: Cellular and molecular mechanisms in social and repetitive behaviours: a focus on cortico-striatal circuitry.Front Cell Neurosci. 2024 Aug 8;18:1470882. doi: 10.3389/fncel.2024.1470882. eCollection 2024. Front Cell Neurosci. 2024. PMID: 39175505 Free PMC article. No abstract available.
-
Transcutaneous auricular vagus nerve stimulation alleviates anxiety-like behaviors in mice with post-traumatic stress disorder by regulating glutamatergic neurons in the anterior cingulate cortex.Transl Psychiatry. 2025 Aug 23;15(1):313. doi: 10.1038/s41398-025-03535-9. Transl Psychiatry. 2025. PMID: 40849423 Free PMC article.
-
Striatal Interneuron Imbalance in a Valproic Acid-Induced Model of Autism in Rodents Is Accompanied by Atypical Somatosensory Processing.eNeuro. 2024 Dec 13;11(12):ENEURO.0326-24.2024. doi: 10.1523/ENEURO.0326-24.2024. Print 2024 Dec. eNeuro. 2024. PMID: 39572246 Free PMC article.
-
Disrupted functional connectome in a rodent model of autism during social isolation.Front Neural Circuits. 2025 May 14;19:1525130. doi: 10.3389/fncir.2025.1525130. eCollection 2025. Front Neural Circuits. 2025. PMID: 40438462 Free PMC article.
References
-
- American Psychiatric Association (2013) Diagnostic and statistical manual of mental disorders, Ed 5. Arlington: American Psychiatric Association.
Publication types
MeSH terms
Substances
LinkOut - more resources
Full Text Sources
Molecular Biology Databases