Review
. 2023 Mar;1878(2):188839.
doi: 10.1016/j.bbcan.2022.188839. Epub 2022 Nov 19.

Unfolded protein response and angiogenesis in malignancies

Affiliations
Review

Unfolded protein response and angiogenesis in malignancies

Amin Izadpanah et al. Biochim Biophys Acta Rev Cancer. 2023 Mar.

Abstract

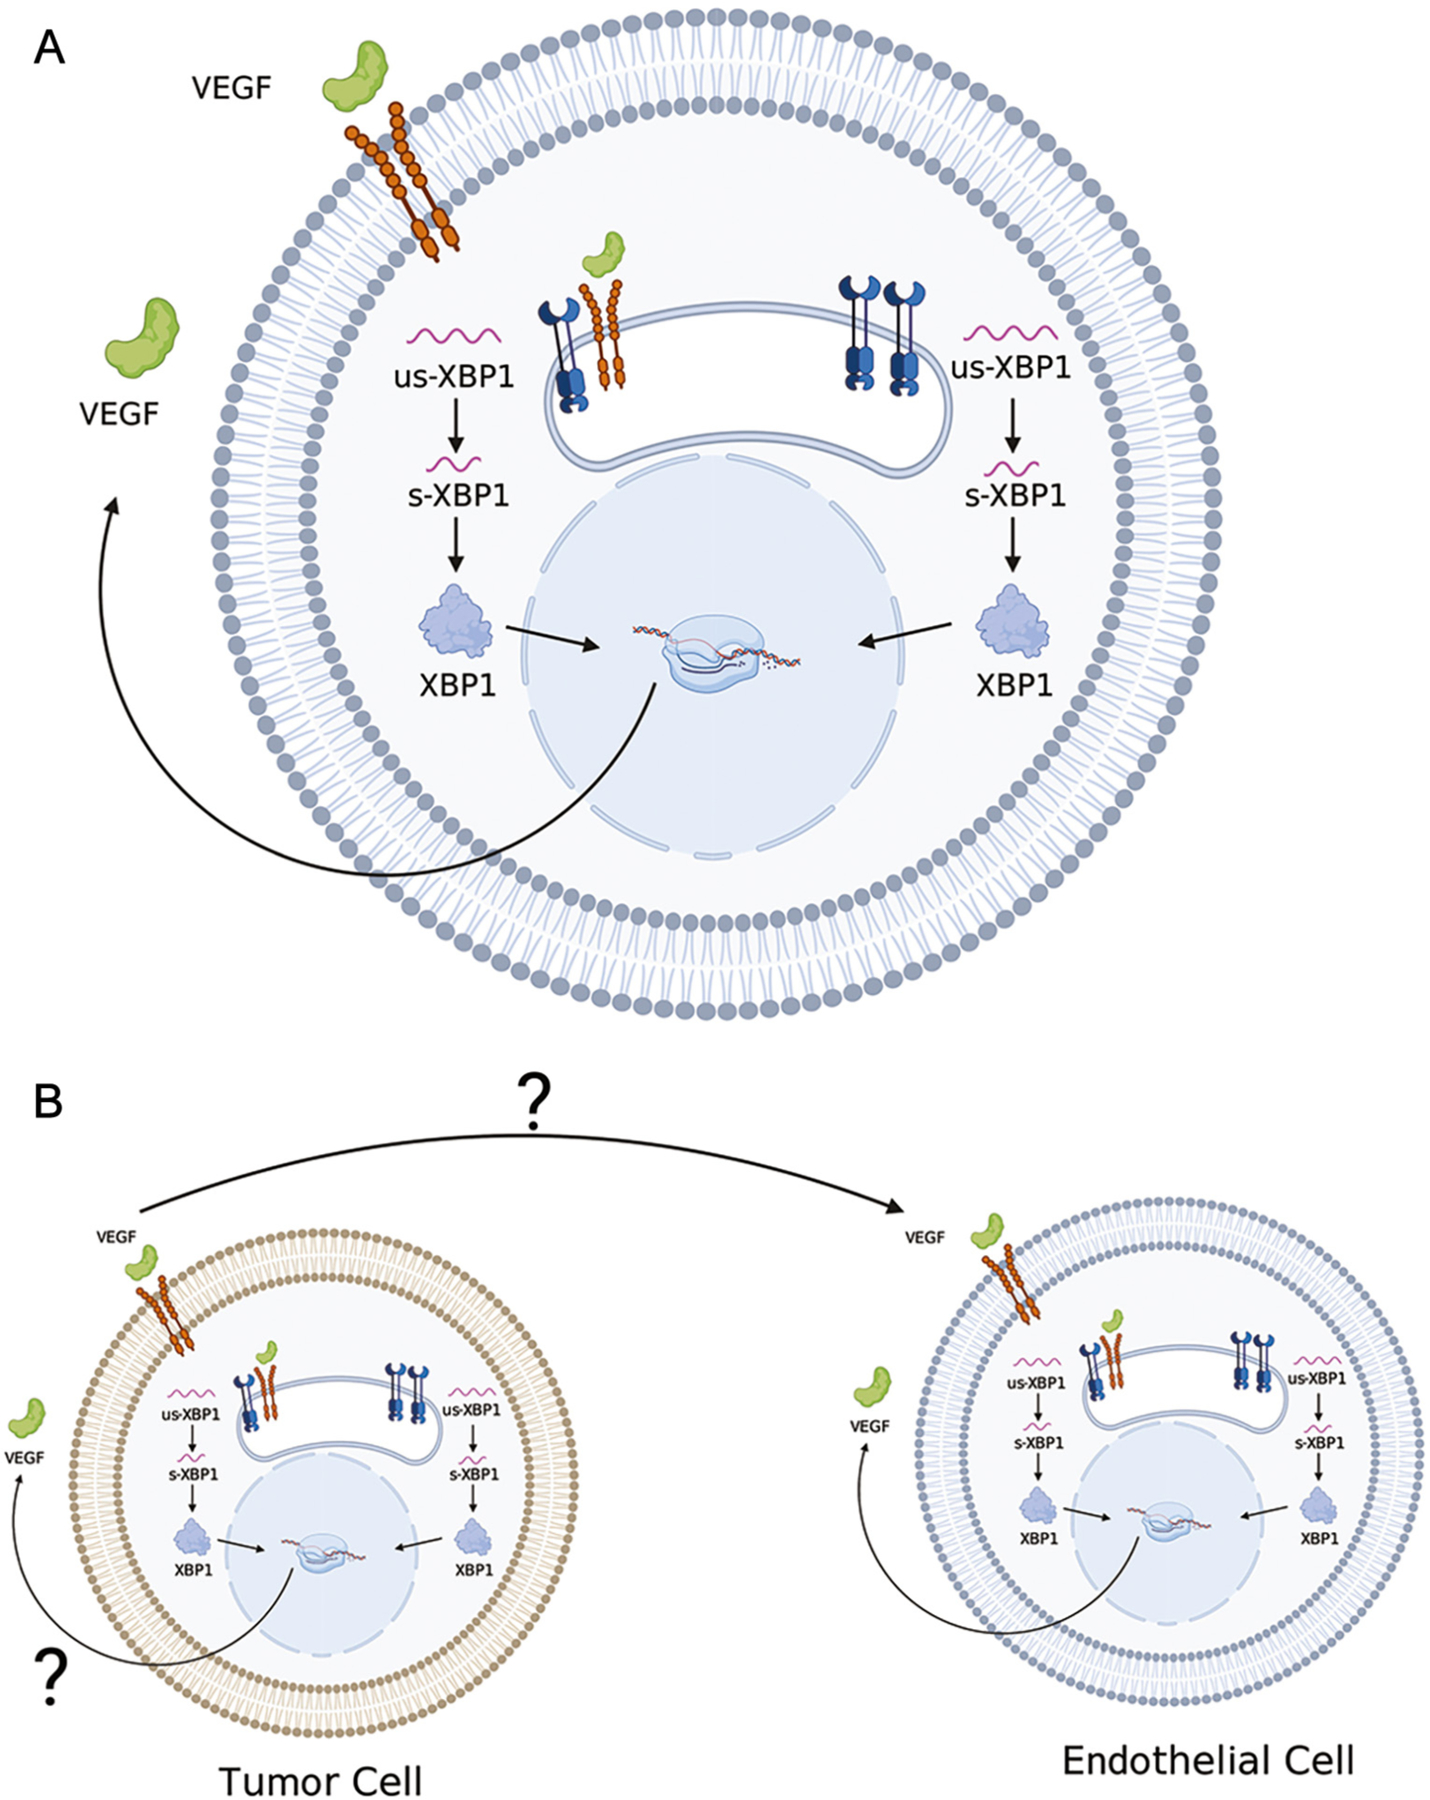
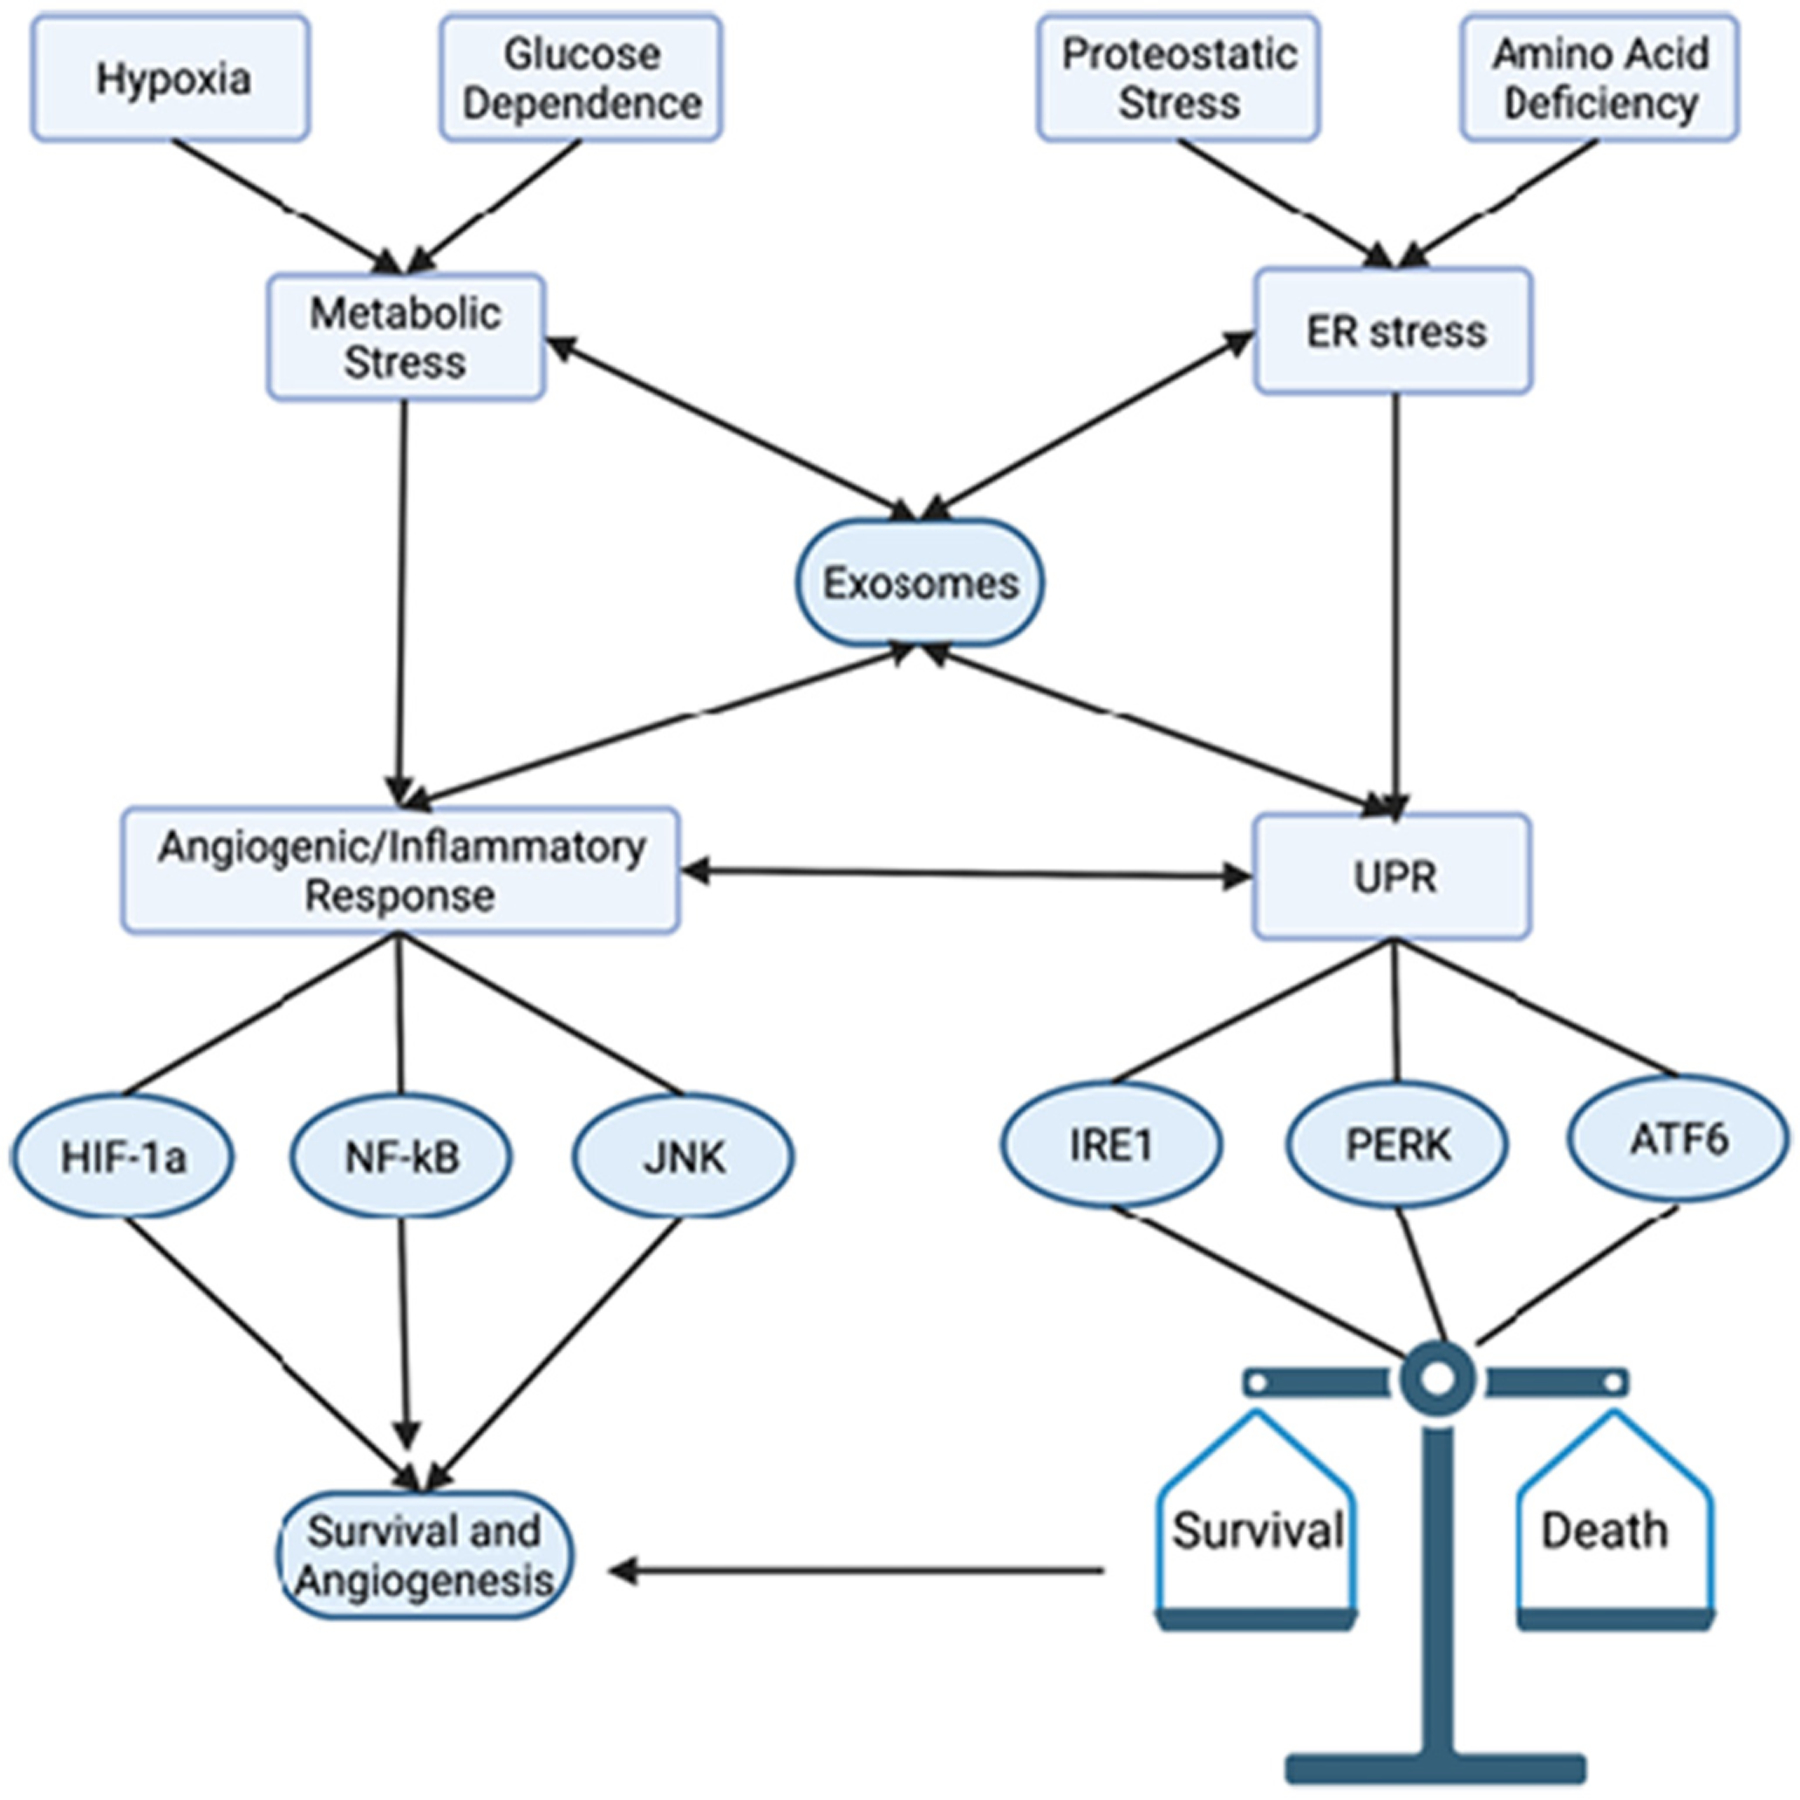
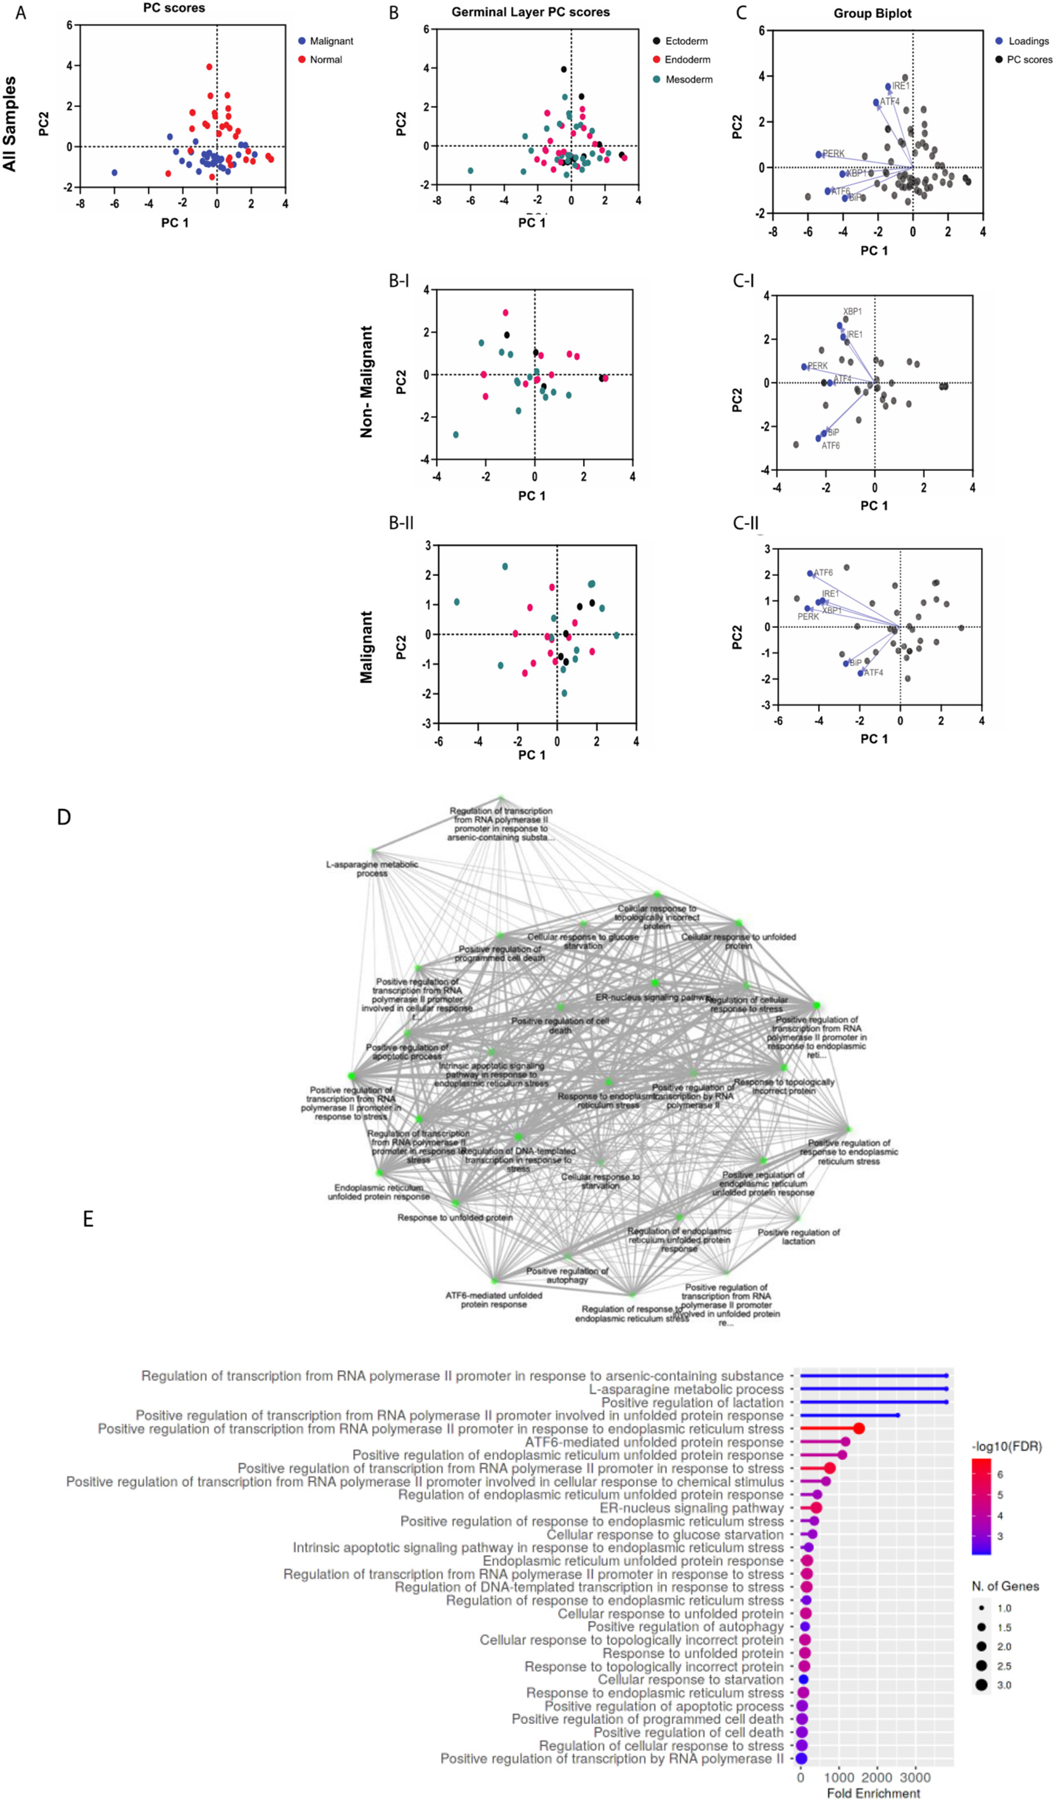
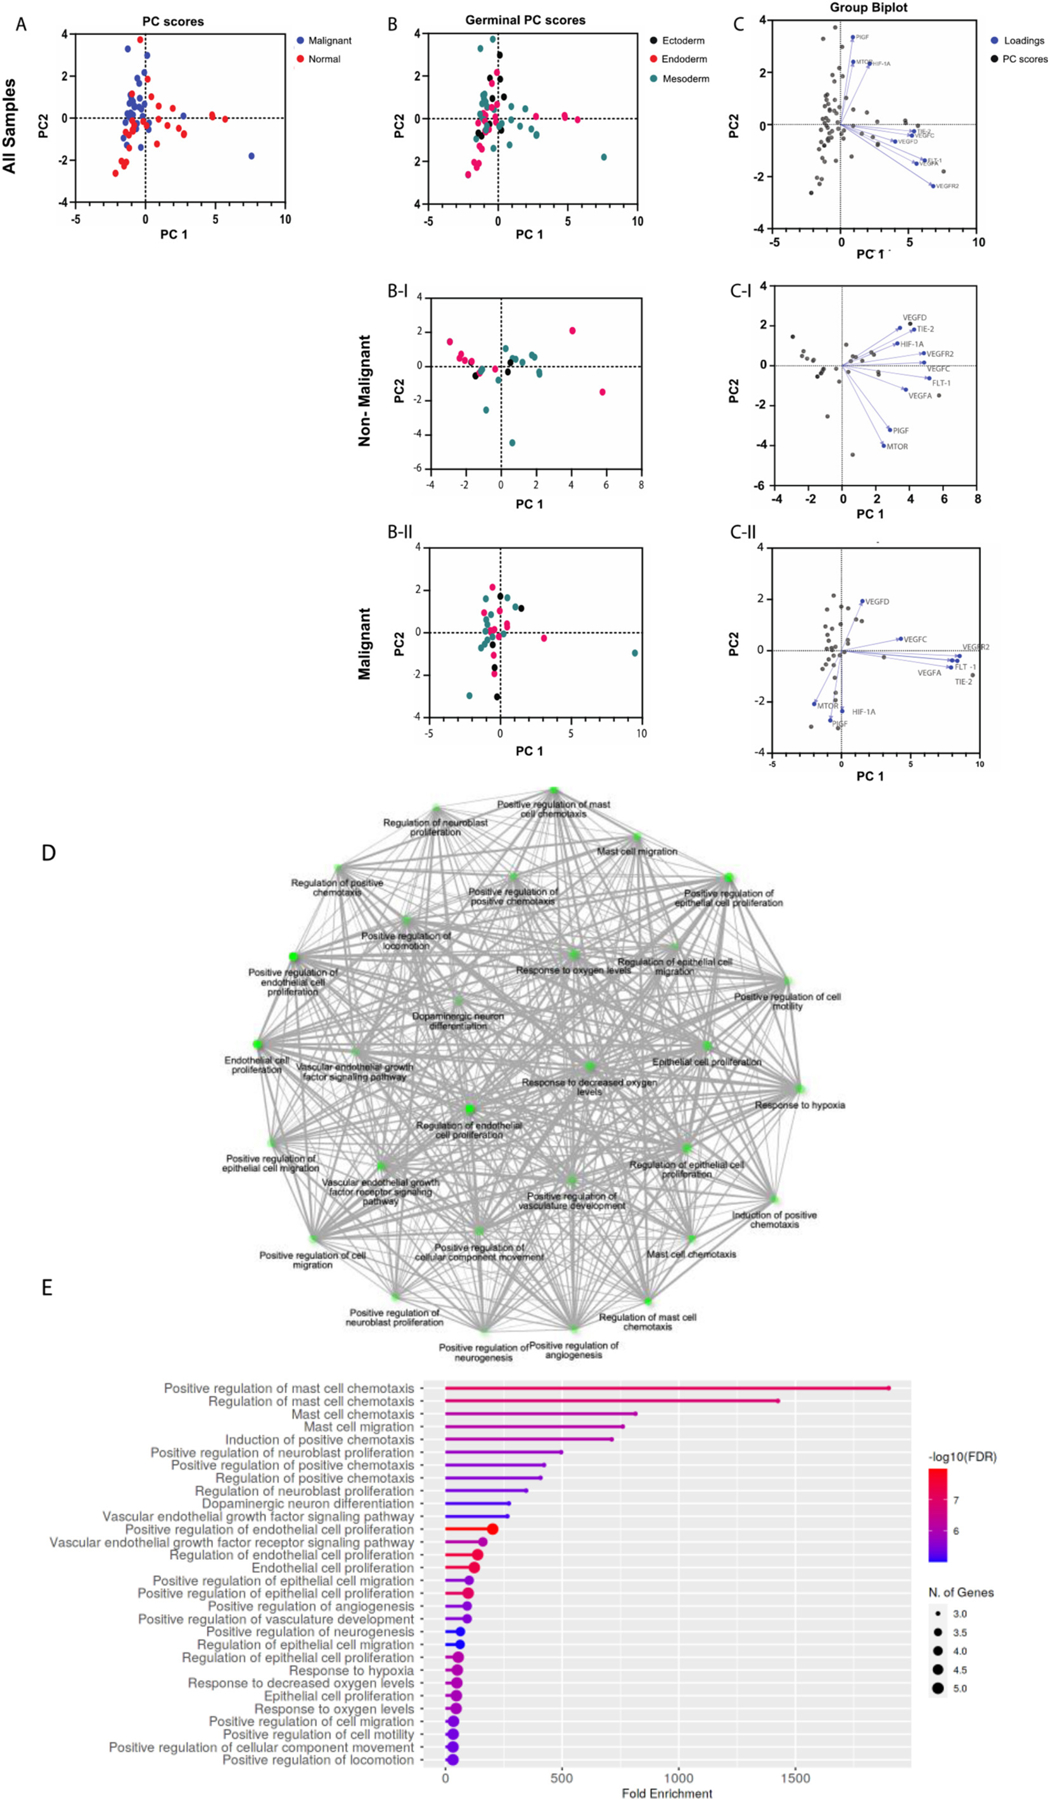
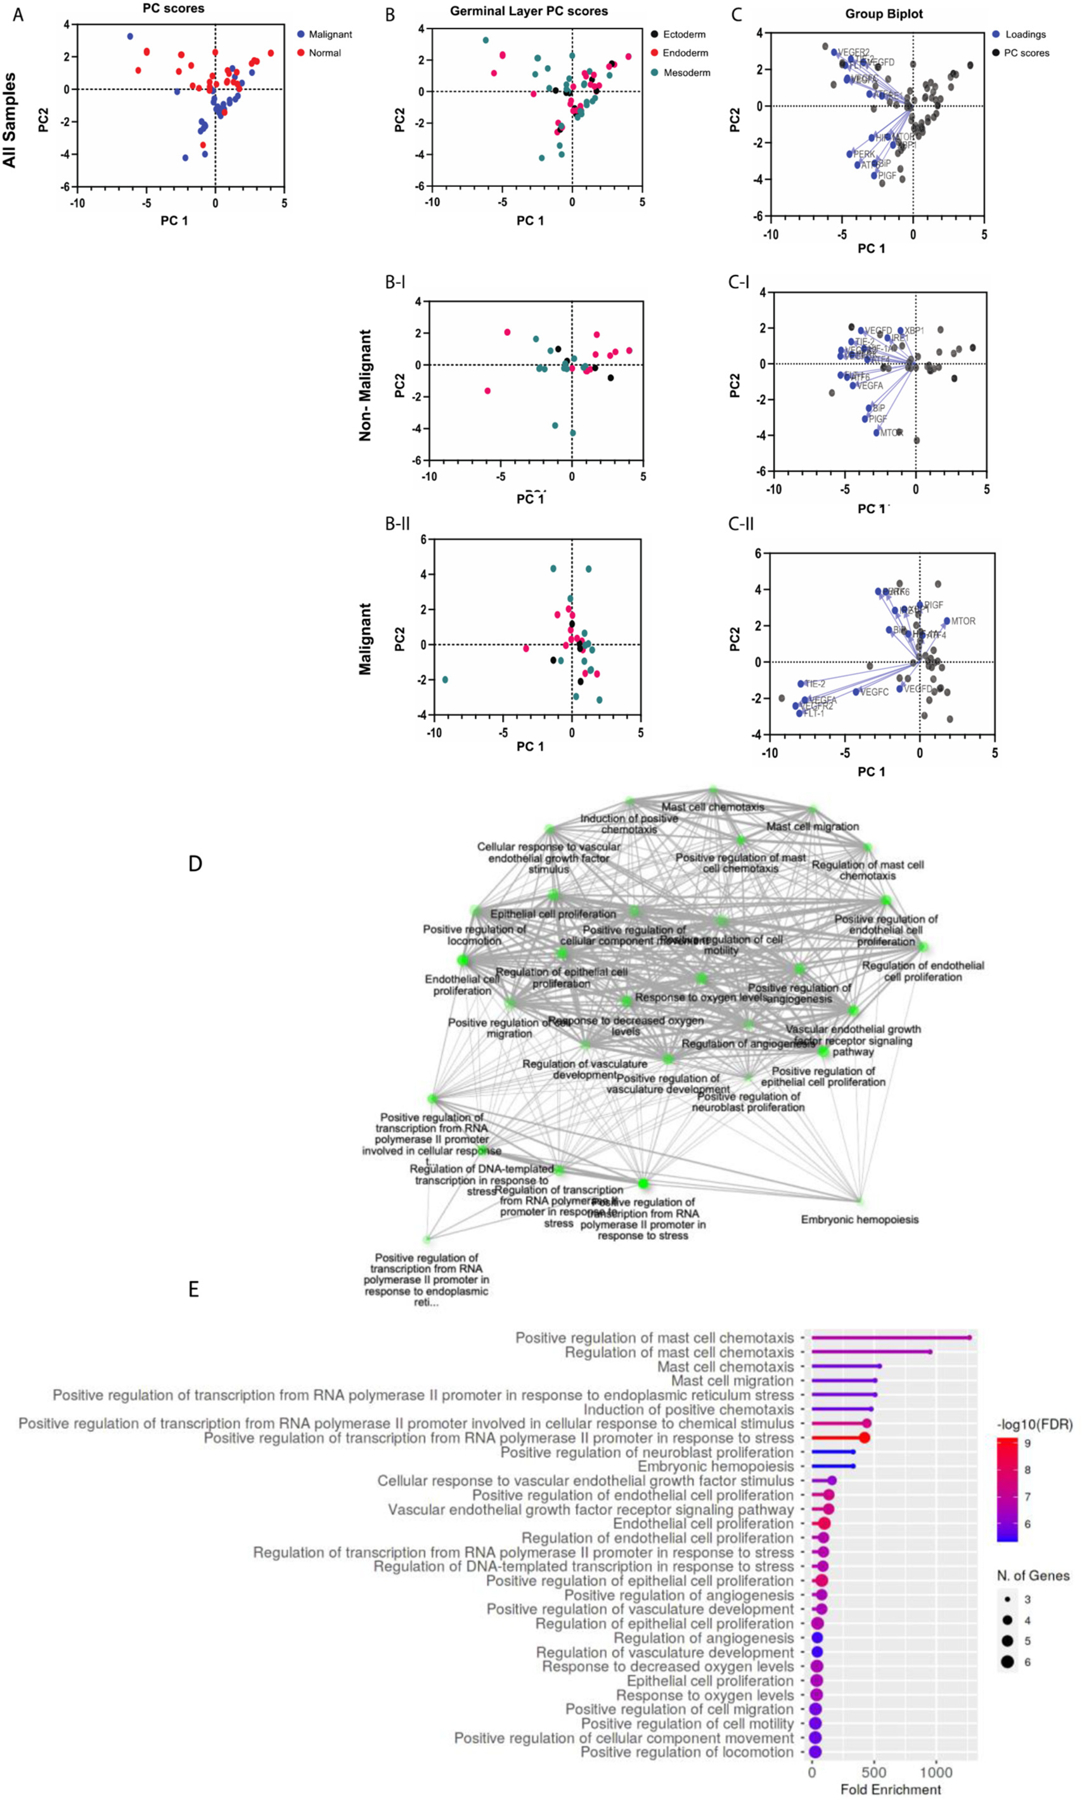
Cellular stress, arising from accumulation of unfolded proteins, occurs frequently in rapidly proliferating cancer cells. This cellular stress, in turn, activates the unfolded protein response (UPR), an interconnected set of signal transduction pathways that alleviate the proteostatic stress. The UPR is implicated in cancer cell survival and proliferation through upregulation of pro-tumorigenic pathways that ultimately promote malignant metabolism and neoangiogenesis. Here, we reviewed mechanisms of signaling crosstalk between the UPR and angiogenesis pathways, as well as transmissible ER stress and the role in tumor growth and development. To characterize differences in UPR and UPR-mediated angiogenesis in malignancy, we employed a data mining approach using patient tumor data from The Cancer Genome Atlas (TCGA). The analysis of TCGA revealed differences in UPR between malignant samples versus their non-malignant counterparts.

Keywords: ATF6; IRE1α; PERK; Tumor microenvironment; Unfolded protein response; XBP1.


Conflict of interest statement

Declaration of Competing Interest The authors declare that they have no known competing financial interests or personal relationships that could have appeared to influence the work reported in this paper.

Figures

Fig. 1.
Fig. 1.
VEGF-IRE1α interactions in UPR. (A) In endothelial cells, binding of VEGF to the VEGF2R causes internalization of VEGFR2 [1]. Internalized VEGFR2 then heterodimerizes with IRE1α at the ER membrane and activates the XBP-1 splicing complex [1]. XBP1 also activates the Akt/GSK/bcatenin axis to drive cell proliferation and growth, and increased VEGF transcription, translation and secretion [1]. VEGF via membrane VEGFR2 activates signaling pathways that rapidly enhance angiogenesis. (B) Both tumor cell-derived VEGF and endothelial cell-derived VEGF may act via paracrine and autocrine mechanisms to promote vascularization (65, 66).
Fig. 2.
Fig. 2.
ER stress and Angiogenesis in Cancer. Due to their rapid growth, cancer cells encounter several cellular stresses including hypoxia, low availability of glucose, proteostatic stress, and amino acid deficiencies. These stresses activate a generalized inflammatory response, leading to HIF-1a, NF-kB, and JNK (among other pro-inflammatory transcription factors) activation. This increases angiogenesis, nutrient delivery, and initiates survival signaling. Proteostatic (ER) stress and amino acid deficiency lead to activation of the UPR, which may lead to cell survival or death. Importantly, these cellular stress events may be communicated between cancer cells and non-malignant stromal cells in various mechanisms involving exosomes (discussed in text). Typically, the pro-survival outcome of the UPR corresponds to increased angiogenic signaling and exhibits significant synergy and crosstalk with the generalized inflammatory response.
Fig. 3.
Fig. 3.
Principal Component Analysis of UPR genes. Gene expression data from The Cancer Genome Atlas (TCGA) was accessed through GEPIA (http://gepia.cancer-pku.cn). Gene expression levels are the median of the cohort, and both tumor samples and matched normal samples were analyzed. (A) PC score plot for malignant versus normal samples (normal samples = red dots; malignant samples = blue dots). PC score plots for non-malignant (B–I) and malignant (B-II) samples based on embryological origin (germinal layer; ectoderm = black dots, endoderm = red dots, mesoderm = green dots). Biplots with PC scores (black dots) and loadings (blue dots) for genes from non-malignant (C–I) and malignant (C-II) samples. Gene ontology enrichment analysis was performed on each gene list to verify that the gene signatures represented UPR pathways (Shiny GO v0.741; bioinformatics.sdstate.edu) (D and E).
Fig. 4.
Fig. 4.
Principal Component Analysis of Angiogenesis genes. Gene expression data from The Cancer Genome Atlas (TCGA) was accessed through GEPIA (http://gepia.cancer-pku.cn). Gene expression levels are the median of the cohort, and both tumor samples and matched normal samples were analyzed. (A) PC score plot for malignant versus normal samples (normal samples = red dots; malignant samples = blue dots). PC score plots for non-malignant (B–I) and malignant (B-II) samples based on embryological origin (germinal layer; (germinal layer; ectoderm = black dots, endoderm = red dots, mesoderm = green dots). Biplots with PC scores (black dots) and loadings (blue dots) for genes from non-malignant (C–I) and malignant (C-II) samples. Gene ontology enrichment analysis was performed on each gene list to verify that the gene signatures represented angiogenesis pathways (Shiny GO v0.741; bioinformatics.sdstate.edu) (D and E).
Fig. 5.
Fig. 5.
Principal Component Analysis of UPR and Angiogenesis genes. Gene expression data from The Cancer Genome Atlas (TCGA) was accessed through GEPIA (http://gepia.cancer-pku.cn). Gene expression levels are the median of the cohort, and both tumor samples and matched normal samples were analyzed. (A) PC score plot for malignant versus normal samples (normal samples = red dots; malignant samples = blue dots). PC score plots for non-malignant (B–I) and malignant (B-II) samples based on embryological origin (germinal layer; ectoderm = black dots, endoderm = red dots, mesoderm = green dots)). Biplots with PC scores (black dots) and loadings (blue dots) for genes from non-malignant (C–I) and malignant (C-II) samples. Gene ontology enrichment analysis was performed on each gene list to verify that the gene signatures represented UPR and angiogenesis pathways (Shiny GO v0.741; bioinformatics.sdstate.edu) (D and E).

References

    1. Zeng L, Xiao Q, Chen M, Margariti A, Martin D, Ivetic A, Xu H, Mason J, Wang W, Cockerill G, Mori K, Li JY, Chien S, Hu Y, Xu Q, Vascular endothelial cell growth-activated XBP1 splicing in endothelial cells is crucial for angiogenesis, Circulation 127 (16) (2013) 1712–1722. - PubMed
    1. Chevet E, Hetz C, Samali A, Endoplasmic reticulum stress-activated cell reprogramming in oncogenesis, Cancer Discov. 5 (6) (2015) 586–597. - PubMed
    1. Urra H, Dufey E, Avril T, Chevet E, Hetz C, Endoplasmic reticulum stress and the hallmarks of cancer, Trends Cancer 2 (5) (2016) 252–262. - PubMed
    1. Li H, Korennykh AV, Behrman SL, Walter P, Mammalian endoplasmic reticulum stress sensor IRE1 signals by dynamic clustering, Proc. Natl. Acad. Sci. U. S. A 107 (37) (2010) 16113–16118. - PMC - PubMed
    1. Hetz C, Papa FR, The unfolded protein response and cell fate control, Mol. Cell 69 (2) (2018) 169–181. - PubMed

Publication types