Comparative Study
. 2022 Nov 22;10(1):e200059.
doi: 10.1212/NXI.0000000000200059. Print 2023 Jan.

More Efficient Complement Activation by Anti-Aquaporin-4 Compared With Anti-Myelin Oligodendrocyte Glycoprotein Antibodies

Affiliations
Comparative Study

More Efficient Complement Activation by Anti-Aquaporin-4 Compared With Anti-Myelin Oligodendrocyte Glycoprotein Antibodies

Magdalena Lerch et al. Neurol Neuroimmunol Neuroinflamm. .

Abstract

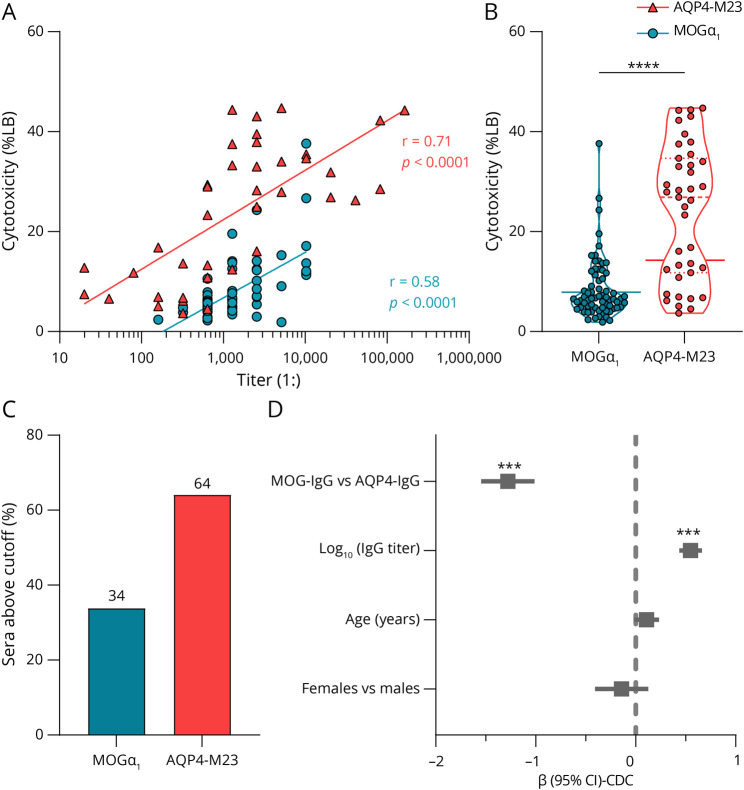
Background and objectives: The objective was to study complement-mediated cytotoxicity induced by immunoglobulin G (IgG) anti-aquaporin-4 antibodies (AQP4-IgG) and anti-myelin oligodendrocyte glycoprotein antibodies (MOG-IgG) in human serum samples from patients suffering from the rare demyelinating diseases of the CNS neuromyelitis optica spectrum disorder (NMOSD) and MOG-IgG-associated disease (MOGAD).

Methods: A cell-based assay with HEK293A cells expressing different MOG isoforms (MOGα1-3β1-3) or AQP4-M23 was used. Cells were incubated with human MOG-IgG or AQP4-IgG-positive serum samples together with active or heat-inactivated human complement, and complement-dependent cytotoxicity (CDC) was measured with a lactate dehydrogenase assay. To further quantify antibody-mediated cell damage, formation of the terminal complement complex (TCC) was analyzed by flow cytometry. In addition, immunocytochemistry of the TCC and complement component 3 (C3) was performed.

Results: AQP4-IgG-positive serum samples induced higher CDC and TCC levels than MOG-IgG-positive sera. Notably, both showed a correlation between antibody titers and CDC and also between titers and TCC levels. In addition, all 6 MOG isoforms tested (MOGα1-3β1-3) could induce at least some CDC; however, the strongest MOG-IgG-induced CDC levels were found on MOGα1, MOGα3, and MOGβ1. Different MOG-IgG binding patterns regarding recognition of different MOG isoforms were investigated, and it was found that MOG-IgG recognizing all 6 isoforms again induced highest CDC levels on MOGα1 and MOGβ1. Furthermore, surface staining of TCC and C3 revealed positive staining on all 6 MOG isoforms tested, as well as on AQP4-M23.

Discussion: Both MOG-IgG and AQP4-IgG are able to induce CDC in a titer-dependent manner. However, AQP4-IgG showed markedly higher levels of CDC compared with MOG in vitro on target cells. This further highlights the role of complement in AQP4-IgG-mediated disease and diminishes the importance of complement activation in MOG-IgG-mediated autoimmune disease.


Figures

Figure 1
Figure 1. AQP4-IgG–Positive Serum Samples Show Stronger Complement Activation Than MOG-IgG–Positive Serum Samples
(A) CDC (shown as percentage of lysis buffer determined by the LDH assay) of 68 MOG-IgG–positive human serum samples (blue circles; MOGα1-EGFP–transfected cells) and 39 AQP4-IgG–positive human serum samples (red triangles; AQP4-M23-EmGFP–transfected cells) is plotted against the antibody titers. Semi-log linear regression lines are shown. Spearman correlation: MOG: r = 0.58, p < 0.0001; AQP4: r = 0.71, p < 0.0001. (B) Violin plot (dashed line: median, dotted lines: quartiles) of all MOG-IgG (blue; n = 68) and AQP4-IgG (red; n = 39) positive serum samples tested is shown. Asterisks indicate the statistical difference of a Mann-Whitney test: ****p < 0.0001. The solid lines indicate the cutoff levels (mean + 2SD of cells treated with complement alone). (C) Percentage of MOG-IgG (blue) or AQP4-IgG (red) positive samples above the cutoff level (mean + 2SD of cells treated with complement alone) is demonstrated as bar graph. (D) The predictive role of MOG-IgG and AQP4-IgG antibody titers and status, age, and sex on complement-dependent cell lysis were analyzed by multivariate regression (R = 0.827, R2 = 0.684, F = 53.1, p < 0.001). Standardized regression coefficient beta is shown with 95% CI. ***p < 0.001. AQP4 = aquaporin-4; CDC = complement-dependent cytotoxicity; LB = lysis buffer; MOG = myelin oligodendrocyte glycoprotein.
Figure 2
Figure 2. Complement Activation on Different MOG Isoforms
(A) Comparison of CDC (as percentage of lysis buffer) of MOG-IgG–positive serum samples (n = 68) with 6 different MOG isoforms (MOGα1-3 and MOGβ1-3) is shown as a scatter dot plot. Bars indicate medians with interquartile range (Friedman test with post hoc Dunn: *p < 0.05, ***p < 0.001, and ****p < 0.0001). The solid line indicates the cutoff level (mean + 2SD of cells treated with complement alone). (B) Shows the percentage of MOG-IgG–positive serum samples above the cutoff value (mean + 2SD of cells treated with complement alone) for the 6 MOG isoforms. The percentages are plotted according to their respective binding patterns (α1β1, α1-3β1, and α1-3β1-3; values are given within the bars). AQP4 = aquaporin-4; LB = lysis buffer; MOG = myelin oligodendrocyte glycoprotein.
Figure 3
Figure 3. Quantification of TCC Deposition
TCC deposition after complement activation of either MOGα1-EGFP (blue) or AQP4-EmGFP (red) transfected HEK293A cells by MOG-IgG or AQP4-IgG–positive serum samples together with human complement was quantified using an flow cytometry assay. (A) Mean fluorescence intensity (MFI) values are plotted against the antibody titers. The lines show semi-log linear regression. Spearman correlation: MOG: r = 0.56, p < 0.05, n = 19; AQP4: r = 0.77, p < 0.001, n = 19. (B) Comparison of MFI values between MOG (n = 19) and AQP4 (n = 19) is shown as violin plot (dashed line: median, dotted lines: quartiles). Mann-Whitney test: **p = 0.002. (C) The MFI values of TCC deposition of human sera are plotted against the respective values from the LDH assay (see Figure 1). Spearman correlation: MOG: r = 0.48, p < 0.05, n = 19; AQP4: r = 0.57, p < 0.05, n = 19. AQP4 = aquaporin-4; LDH = lactate dehydrogenase; MFI = mean fluorescence intensity; MOG = myelin oligodendrocyte glycoprotein; TCC = terminal complement complex.

References

    1. Prüss H. Autoantibodies in neurological disease. Nat Rev Immunol. 2021;21(12):798-813. doi: 10.1038/s41577-021-00543-w - DOI - PMC - PubMed
    1. Wingerchuk DM, Banwell B, Bennett JL, et al. . International consensus diagnostic criteria for neuromyelitis optica spectrum disorders. Neurology. 2015;85(2):177-189. doi: 10.1212/WNL.0000000000001729 - DOI - PMC - PubMed
    1. Jarius S, Paul F, Weinshenker BG, Levy M, Kim HJ, Wildemann B. Neuromyelitis optica. Nat Rev Dis Primers. 2020;6(1):85. doi: 10.1038/s41572-020-0214-9 - DOI - PubMed
    1. Reindl M, Waters P. Myelin oligodendrocyte glycoprotein antibodies in neurological disease. Nat Rev Neurol. 2019;15(2):89-102. doi: 10.1038/s41582-018-0112-x - DOI - PubMed
    1. Marignier R, Hacohen Y, Cobo-Calvo A, et al. . Myelin-oligodendrocyte glycoprotein antibody-associated disease. Lancet Neurol. 2021;20(9):762-772. doi: 10.1016/S1474-4422(21)00218-0 - DOI - PubMed

Publication types