. 2023 Jan 1;324(1):G78-G88.
doi: 10.1152/ajpgi.00213.2022. Epub 2022 Nov 22.

Manganese efflux transporter SLC30A10 missense polymorphism T95I associated with liver injury retains manganese efflux activity

Affiliations

Manganese efflux transporter SLC30A10 missense polymorphism T95I associated with liver injury retains manganese efflux activity

Kerem C Gurol et al. Am J Physiol Gastrointest Liver Physiol. .

Abstract

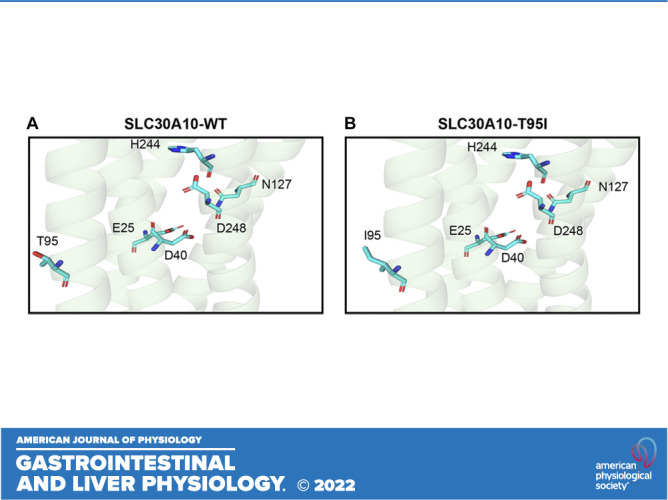
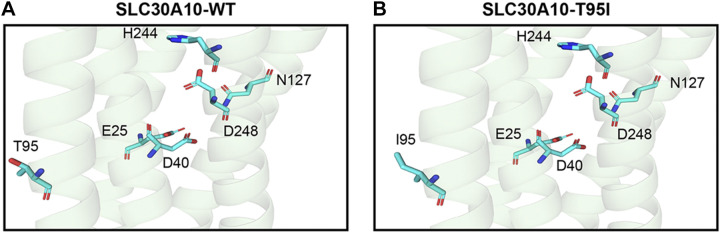
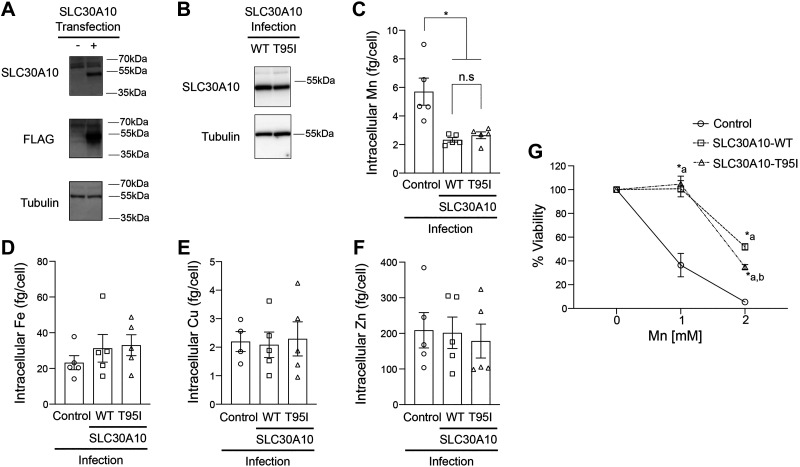
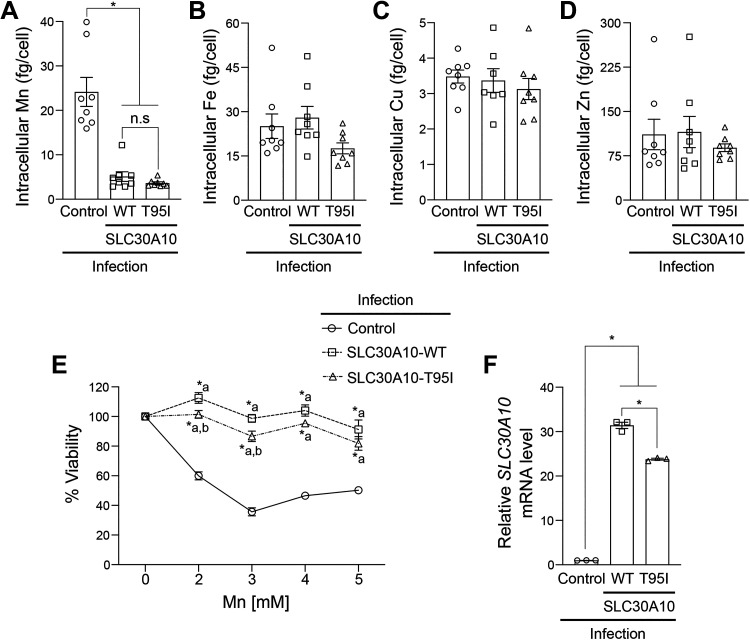
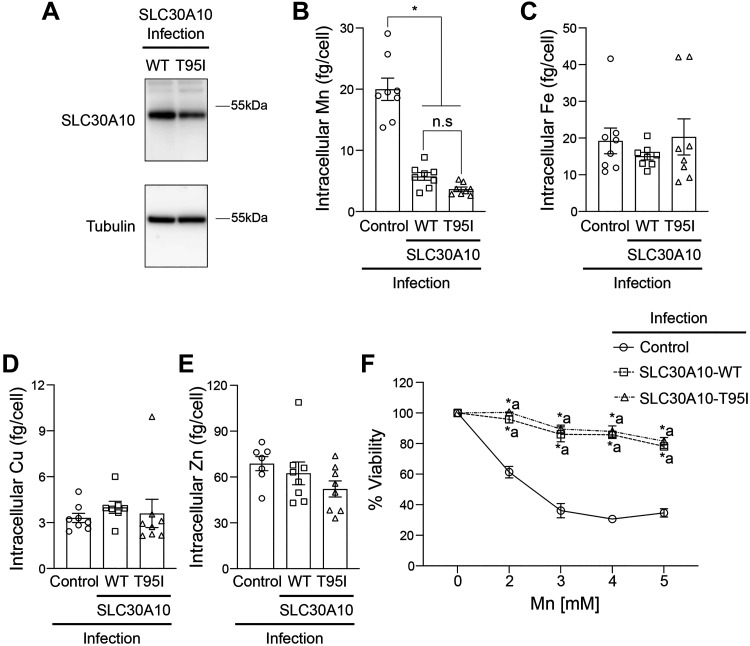
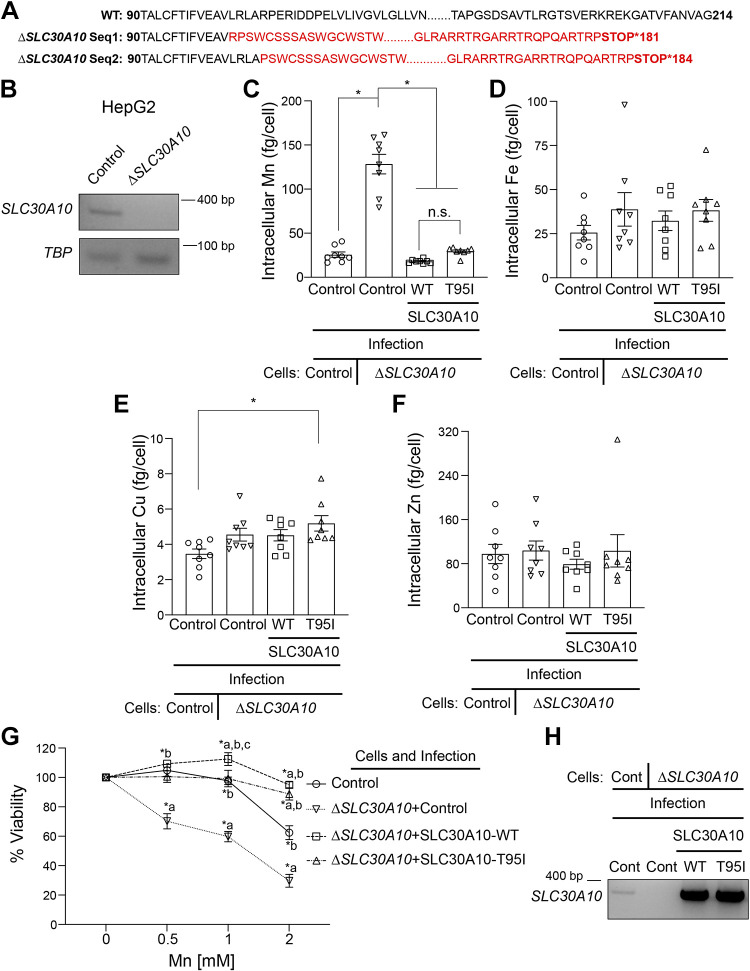
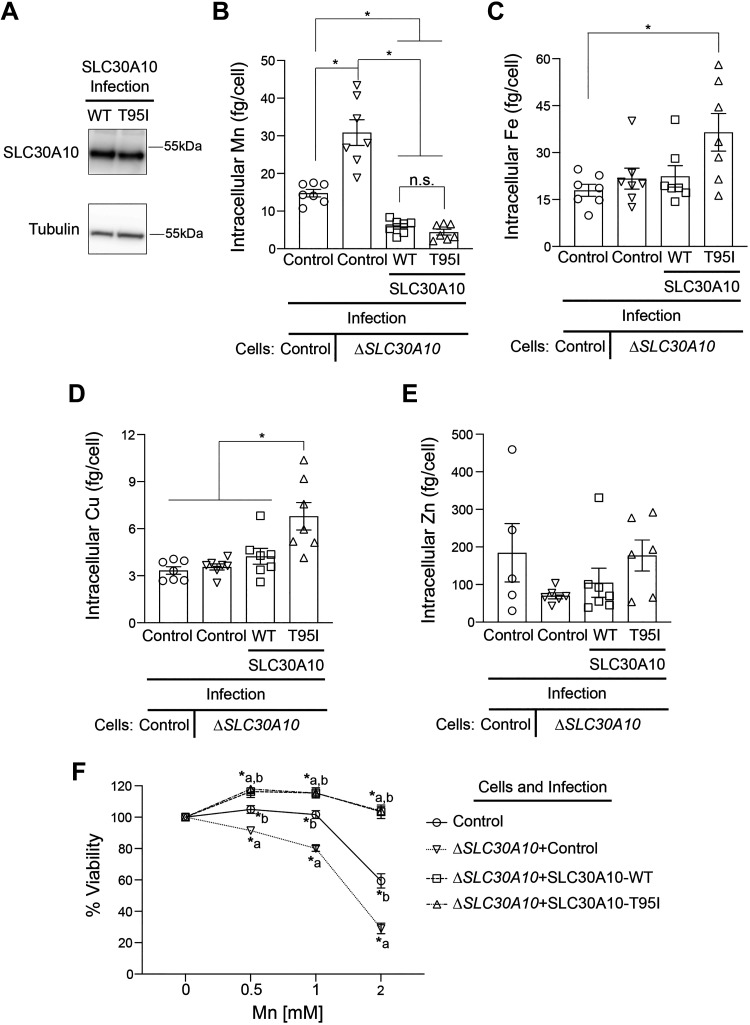
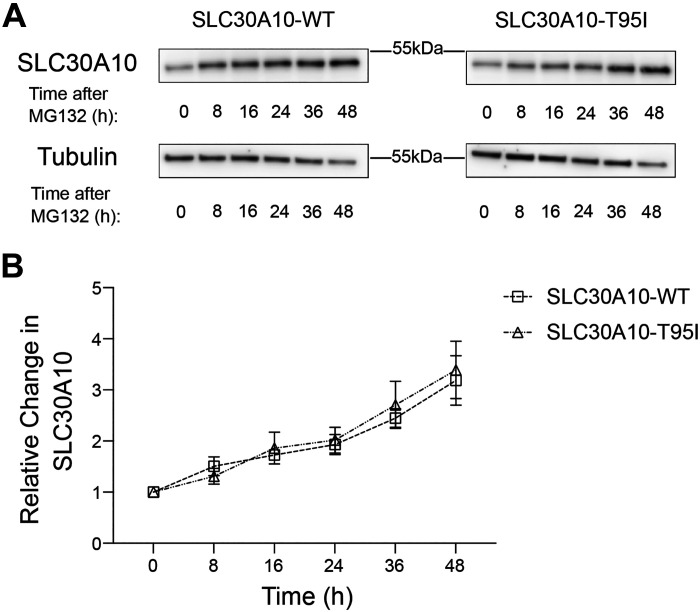
The activity of the manganese (Mn) efflux transporter SLC30A10 in the liver and intestines is critical for Mn excretion and preventing Mn toxicity. Homozygous loss-of-function mutations in SLC30A10 are a well-established cause of hereditary Mn toxicity. But, the relationship between more common SLC30A10 polymorphisms, Mn homeostasis, and disease is only recently emerging. In 2021, the first coding SNP in SLC30A10 (T95I) was associated with liver disease raising the hypothesis that the T95I substitution may induce disease by inhibiting the Mn efflux function of SLC30A10. Here, we test this hypothesis using structural, viability, and metal quantification approaches. Analyses of a predicted structure of SLC30A10 revealed that the side chain of T95 pointed away from the putative Mn-binding cavity, raising doubts about the impact of the T95I substitution on SLC30A10 function. In HeLa or HepG2 cells, overexpression of SLC30A10-WT or T95I resulted in comparable reductions of intracellular Mn levels and protection against Mn-induced cell death. Furthermore, ΔSLC30A10 HepG2 cells, generated using CRISPR/Cas9, exhibited elevated Mn levels and heightened sensitivity to Mn-induced cell death, and these phenotypic changes were similarly rescued by expression of SLC30A10-WT or T95I. Finally, turnover rates of SLC30A10-WT or T95I were also comparable. In summary, our results indicate that the Mn transport activity of SLC30A10-T95I is essentially comparable to the WT protein. Our findings imply that SLC30A10-T95I either has a complex association with liver injury that extends beyond the simple reduction in SLC30A10 activity or alternatively the T95I mutation lacks a causal role in liver disease.NEW & NOTEWORTHY This study demonstrates that the T95I polymorphism in the manganese transporter SLC30A10, which has been associated with liver disease in human GWAS studies, does not impact transporter function in cell culture. These findings raise doubts about the causal relationship of the T95I polymorphism with human disease and highlight the importance of validating GWAS findings using mechanistic approaches.

Keywords: ZnT10; excretion; homeostasis; metal; transporter.


Conflict of interest statement

No conflicts of interest, financial or otherwise, are declared by the authors.

Figures

None
Graphical abstract
Figure 1.
Figure 1.
Structural prediction of SLC30A10-WT or SLC30A10-T95I. A and B: cartoon representation of the predicted structure of SLC30A10-WT (A) or SLC30A10-T95I (B) is depicted. Amino acid residues are shown as cyan sticks with nitrogen atoms colored in blue and oxygen atoms colored in red. WT, wild type.
Figure 2.
Figure 2.
Overexpression of SLC30A10-WT or SLC30A10-T95I in HeLa cells reduces Mn levels and protects against Mn toxicity. A: HeLa cells were either left untransfected (−) or transiently transfected with FLAG-SLC30A10-WT construct (+) and harvested 48 h after transfection. Immunoblots were performed to detect SLC30A10 (using the custom anti-SLC30A10 antibody), FLAG or tubulin. B: immunoblots were performed to detect SLC30A10 (using the anti-SLC30A10 antibody) or tubulin from HeLa clones expressing SLC30A10-WT or SLC30A10-T95I. Relative expression of SLC30A10-WT or T95I, normalized to tubulin, respectively is 1.00 ± 0.008 and 0.655 ± 0.096 (means ± SE; n = 3; P < 0.05 by t test). CF: mock-infected HeLa cells (control) or clonal HeLa cells expressing SLC30A10-WT or SLC30A10-T95I were treated with 250 µM Mn for 16 h. Intracellular levels of Mn (C), Fe (D), Cu (E), or Zn (F) were measured by inductively coupled plasma-mass spectrometry (ICP-MS) and normalized to total cell counts (means ± SE; n = 4–5; *P < 0.05 and n.s. denotes not significant for indicated comparisons by one-way ANOVA and Tukey’s post hoc test). G: viability of cells infected as described in CF was assessed 16 h after treatment with indicated Mn doses. For each infection condition, viability at 0 mM Mn was independently set to 100 (means ± SE; n = 4, *P < 0.05 by two-way ANOVA and Tukey’s post hoc test with a and b indicating differences in comparison with control or SLC30A10-WT infection conditions, respectively, at each Mn concentration). WT, wild type.
Figure 3.
Figure 3.
Effect of overexpression of SLC30A10-WT or SLC30A10-T95I in HepG2 cells on intracellular Mn levels and Mn-induced cell death is essentially similar. AD: intracellular Mn (A), Fe (B), Cu (C), or Zn (D) levels were measured in mock-infected HepG2 cells (control) or mixed population of HepG2 cells infected with SLC30A10-WT or SLC30A10-T95I after 16 h of 125 µM Mn treatment. Values were normalized to total cell counts (means ± SE; n = 7–8, *P < 0.05 and n.s. denotes not significant for indicated comparisons by one-way ANOVA and Tukey’s post hoc test). E: cell viability was analyzed after 16 h treatment with indicated Mn doses. Infection conditions are identical to AD. For each infection condition, viability at 0 mM Mn was independently set to 100 (means ± SE; n = 5, *P < 0.05 using two-way ANOVA and Tukey’s post hoc test with a and b indicating differences in comparison with control or SLC30A10-WT infection conditions, respectively, at each Mn concentration). F: qRT-PCR analyses were performed under infection conditions identical to AD. Relative expression of SLC30A10 in the control infection group was normalized to 1 (n = 3, *P < 0.05 using one-way ANOVA and Tukey’s post hoc test for indicated comparisons). WT, wild type.
Figure 4.
Figure 4.
In clonal HepG2 cells, overexpression of SLC30A10-WT or SLC30A10-T95I has a comparable effect on intracellular Mn levels and Mn-induced cell death. A: immunoblot analyses were performed to detect SLC30A10 (using the custom anti-SLC30A10 antibody) or tubulin in HepG2 clones expressing SLC30A10-WT or SLC30A10-T95I. Relative expression of SLC30A10-WT or T95I, normalized to tubulin, respectively is 1.00 ± 0.136 and 0.541 ± 0.021 (means ± SE; n = 3, P < 0.05 by t test). Intracellular Mn (B), Fe (C), Cu (D), or Zn (E) levels were assayed in mock-infected HepG2 cells (control) or HepG2 clones expressing SLC30A10-WT or SLC30A10-T95I after 16 h treatment with 125 µM Mn. Metal values were normalized to total cell counts (means ± SE; n = 7–8, *P < 0.05 and n.s. denotes not significant for indicated comparisons by one-way ANOVA and Tukey’s post hoc test). F: viability of cells infected as described in BE was assayed after 16 h treatment with indicated Mn doses. For each infection condition, viability at 0 mM Mn was set to 100 (means ± SE; n = 5, *P < 0.05 using two-way ANOVA and Tukey’s post hoc test with a indicating differences in comparison with the control group at each Mn dose. There were no differences between SLC30A10-WT or SLC30A10-T95I infection groups at any of the Mn doses by two-way ANOVA (P > 0.05). WT, wild type.
Figure 5.
Figure 5.
Expression of SLC30A10-WT or SLC30A10-T95I in ΔSLC30A10 HepG2 cells rescues changes in Mn levels and cell viability. A: amino acid sequence of the wild-type (WT) SLC30A10 protein or the SLC30A10 protein sequence translated from the genomic DNA sequence of the ΔSLC30A10 HepG2 clone. There are two sequences (Seq1 and 2) for the ΔSLC30A10 clone because CRISPR/Cas9 introduced two independent mutations in the corresponding genomic DNA, likely one for each chromosome. Differences between the sequences obtained from the ΔSLC30A10 clone and the WT protein are shown in red. Numbers indicate amino acid residue. B: RT-PCR analyses were performed to detect SLC30A10 or TBP mRNA in control or ΔSLC30A10 HepG2 cells. CF: intracellular metal measurements were performed after 125 µM Mn treatment for 16 h in mock-infected HepG2 cells (control) or ΔSLC30A10 HepG2 cells that underwent a second mock, SLC30A10-WT or SLC30A10-T95I infection (ΔSLC30A10 + control; ΔSLC30A10+SLC30A10-WT; or ΔSLC30A10+SLC30A10-T95I, respectively). Clonal selection was not performed after SLC30A10-WT or SLC30A10-T95I infection. Metal values were normalized to total cell counts (means ± SE; n = 8, *P < 0.05 and n.s. denotes not significant for indicated comparisons by one-way ANOVA and Tukey’s post hoc test). G: viability of cells infected as described in CF was assayed after 16 h of treatment with indicated Mn doses. For each infection condition, viability at 0 mM Mn was set to 100 (means ± SE; n = 5, *P < 0.05 using two-way ANOVA and Tukey’s post hoc test with a, b, and c indicating differences in comparison with control, ΔSLC30A10 + control, or ΔSLC30A10+SLC30A10-T95I infection groups, respectively at each Mn concentration). H: RT-PCR analyses were performed in cells infected as described in CF to detect SLC30A10 or TBP mRNA. Cont., control.
Figure 6.
Figure 6.
After clonal selection of SLC30A10-WT or SLC30A10-T95I expression in ΔSLC30A10 HepG2 cells, rescue activity of the SLC30A10-T95I mutant is comparable to SLC30A10-WT. A: immunoblot analyses were performed to detect SLC30A10 (using the custom anti-SLC30A10 antibody) or tubulin in ΔSLC30A10 HepG2 cells infected a second time with SLC30A10-WT or SLC30A10-T95I. Cells were clonally selected after the second infection. Relative expression of SLC30A10-WT or T95I, normalized to tubulin, respectively is 1.00 ± 0.239 and 0.835 ± 0.085 (means ± SE; n = 3; P > 0.05 by t test). BE: intracellular metal measurements were performed in mock-infected HepG2 cells (control) or ΔSLC30A10 HepG2 cells that underwent a second mock, SLC30A10-WT or SLC30A10-T95I infection (ΔSLC30A10 + control; ΔSLC30A10+SLC30A10-WT; or ΔSLC30A10+SLC30A10-T95I, respectively). ΔSLC30A10 cells infected with SLC30A10-WT or SLC30A10-T95I underwent clonal selection. Cells were treated with 125 µM Mn for 16 h before analyses. Metal levels were normalized to total cell counts (means ± SE; n = 5–7, *P < 0.05 and n.s. denotes not significant by one-way ANOVA and Tukey’s post hoc test). F: viability of cells infected and clonally selected as described in BE was assayed after 16 h treatment with indicated Mn doses. For each cell line, viability at 0 mM Mn was set to 100 (means ± SE; n = 5, *P < 0.05 using two-way ANOVA and Tukey’s post hoc test with a and b indicating differences in comparison with control or ΔSLC30A10 + control groups, respectively at each Mn dose. There were no differences between ΔSLC30A10+SLC30A10-WT or ΔSLC30A10+SLC30A10-T95I groups at any Mn concentration by two-way ANOVA). WT, wild type.
Figure 7.
Figure 7.
Turnover of SLC30A10-WT and SLC30A10-T95I is comparable. A: HepG2 clones overexpressing SLC30A10-WT or SLC30A10-T95I (identical to Fig. 4) were treated with 0.5 µM MG132 for indicated times. Cell lysates were collected and SLC30A10 or tubulin were detected by immunoblot. The custom antibody against SLC30A10 was used. B: quantification of SLC30A10 levels from A. At each time point, SLC30A10 expression is normalized to tubulin. For each infection condition, normalized SLC30A10 expression at 0 h is set to 1 (n = 3; there were no differences between SLC30A10-WT or SLC30A10-T95I groups at any time-point using two-way ANOVA and Sidak’s post hoc test). WT, wild type.

Similar articles

Cited by

References

    1. Aschner M, Erikson KM, Herrero Hernández E, Tjalkens R. Manganese and its role in Parkinson's disease: from transport to neuropathology. Neuromolecular Med 11: 252–266, 2009. [Erratum in Neuromolecular Med 11: 267, 2009]. doi: 10.1007/s12017-009-8083-0. - DOI - PMC - PubMed
    1. Balachandran RC, Mukhopadhyay S, McBride D, Veevers J, Harrison FE, Aschner M, Haynes EN, Bowman AB. Brain manganese and the balance between essential roles and neurotoxicity. J Biol Chem 295: 6312–6329, 2020. doi: 10.1074/jbc.REV119.009453. - DOI - PMC - PubMed
    1. Kwakye GF, Paoliello MM, Mukhopadhyay S, Bowman AB, Aschner M. Manganese-induced Parkinsonism and Parkinson's disease: shared and distinguishable features. Int J Environ Res Public Health 12: 7519–7540, 2015. doi: 10.3390/ijerph120707519. - DOI - PMC - PubMed
    1. Bowman AB, Aschner M. Considerations on manganese (Mn) treatments for in vitro studies. Neurotoxicology 41: 141–142, 2014. doi: 10.1016/j.neuro.2014.01.010. - DOI - PMC - PubMed
    1. Guilarte TR, Gonzales KK. Manganese-induced Parkinsonism is not idiopathic Parkinson's disease: environmental and genetic evidence. Toxicol Sci 146: 204–212, 2015. doi: 10.1093/toxsci/kfv099. - DOI - PMC - PubMed

Publication types

LinkOut - more resources