. 2022 Nov 22;13(1):6523.
doi: 10.1038/s41467-022-34101-2.

Gut to lung translocation and antibiotic mediated selection shape the dynamics of Pseudomonas aeruginosa in an ICU patient

Affiliations

Gut to lung translocation and antibiotic mediated selection shape the dynamics of Pseudomonas aeruginosa in an ICU patient

Rachel M Wheatley et al. Nat Commun. .

Abstract

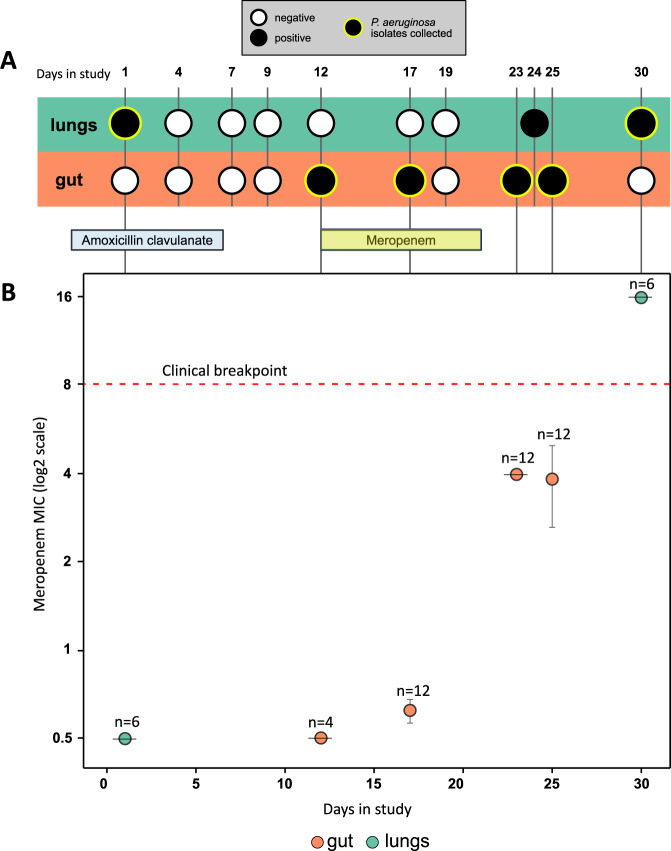
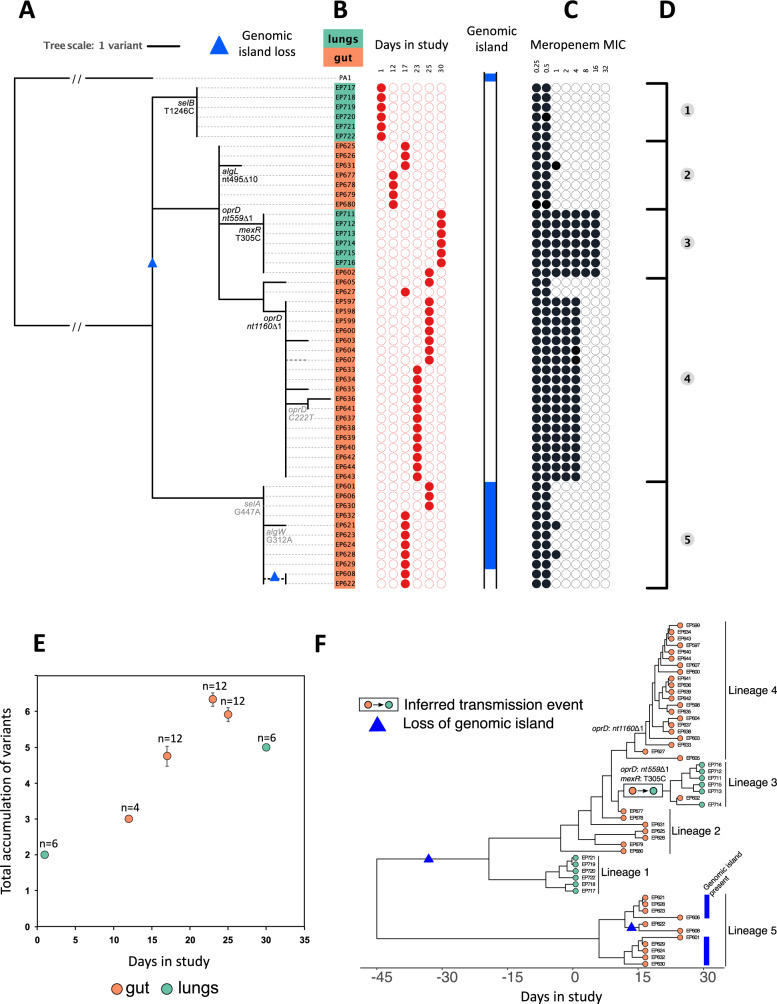
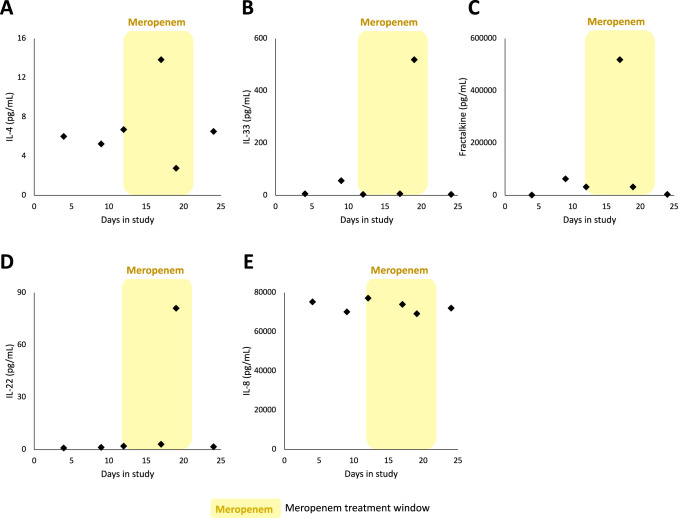
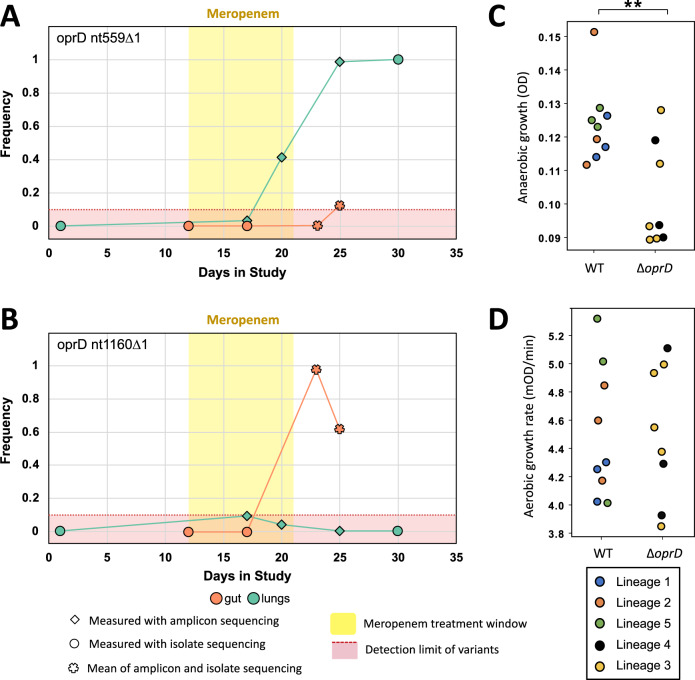
Bacteria have the potential to translocate between sites in the human body, but the dynamics and consequences of within-host bacterial migration remain poorly understood. Here we investigate the link between gut and lung Pseudomonas aeruginosa populations in an intensively sampled ICU patient using a combination of genomics, isolate phenotyping, host immunity profiling, and clinical data. Crucially, we show that lung colonization in the ICU was driven by the translocation of P. aeruginosa from the gut. Meropenem treatment for a suspected urinary tract infection selected for elevated resistance in both the gut and lung. However, resistance was driven by parallel evolution in the gut and lung coupled with organ specific selective pressures, and translocation had only a minor impact on AMR. These findings suggest that reducing intestinal colonization of Pseudomonas may be an effective way to prevent lung infections in critically ill patients.


Conflict of interest statement

The authors declare no competing interests.

Figures

Fig. 1
Fig. 1. Clinical timeline and resistance phenotyping.
A Timeline of patient sampling, showing samples that tested positive or negative for P. aeruginosa colonisation by culturing. Sampling points from which isolates were collected are highlighted with a green ring. The patient was treated with amoxicillin clavulanate from 2 days prior to enrolment until day 6 and with meropenem from day 12 to day 21. B Meropenem minimum inhibitory concentration (MIC) (mean ± s.e.m μg/mL) for isolates (n = 4–12, as labelled on plot) from each sampling point from the gut (orange) and lung (green). Each isolate had a median meropenem MIC calculated from n = 3 biologically independent replicates. Meropenem resistance increased over time, and P. aeruginosa isolates from the final lung sample were above the EUCAST clinical breakpoint for meropenem resistance (red dashed line). Amoxicillin clavulanate resistance was not measured as this antibiotic is not active against P. aeruginosa. Source data are provided as a Source Data file.
Fig. 2
Fig. 2. Genome sequencing and phylogenetic analysis.
A Phylogenetic reconstruction of lung (n = 12) and gut (n = 40) isolates rooted using P. aeruginosa PA1, another ST782 clinical isolate sampled from a respiratory tract infection, as the outgroup. Putatively adaptive polymorphisms in genes or pathways showing parallel evolution are annotated on the phylogeny. Protein altering mutations are shown in black and silent mutations are shown in light grey. A polymorphism in a known multi-drug efflux pump regulator (mexR) is also highlighted. Variation in the presence/absence of a 190kB genomic island is shown, and inferred losses of the genomic island are identified with blue triangles in the tree. B Isolate name, lung (green) or gut (orange) origin, and day in study of collection. C Susceptibility to meropenem for each isolate is presented with filled black circles in log2 scale of the minimum inhibitory concentration (MIC). D The topology of the tree suggested five distinct groups based on the identification of small polymorphisms. E The accumulation of variants over time (mean ± s.e for isolates (n = 4–12, as labelled on plot) from each sampling point from the gut (orange) and lung (green) suggests within-host evolution of a clone rather than recurrent episodes of colonisation. F Dated genealogy of isolates constructed with BactDating. The inferred instance of gut to lung transmission and the acquisition of meropenem resistance mutations have been annotated on the genealogy. Source data are provided as a Source Data file.
Fig. 3
Fig. 3. Cytokine concentrations were measured in ETA samples collected over the course of the study at days 4, 9, 12, 17, 19 and 24.
The following cytokines were measured: A IL-4, B IL-33, C Fractalkine, D IL-22, E IL-8. Yellow shading indicates meropenem treatment window on timeline (day 12 to day 21). Source data are provided as a Source Data file.
Fig. 4
Fig. 4. Evolution and transmission of meropenem resistance.
A, B Dynamics of oprD variants, as determined by isolate (circle) and oprD amplicon (diamond) sequencing data. For the two sampling points (gut day 23 and gut day 25) where both amplicon and isolate sequencing was carried out, the mean of the two frequencies is shown (star). Measurements of SNP frequency from isolate sequencing and amplicon sequencing were strongly correlated (R2 = 0.9963; Supplementary Fig. 3). The yellow area shows the window of meropenem treatment and the red area shows a conservative minimum detection limit of variants from amplicon sequencing due to the error rate of nanopore sequencing. C, D Growth of isolates with an oprD variant (Δ oprD) compared to isolates with the wild-type oprD background. Anaerobic growth (C) was measured as OD595 after 72 hours growth in anaerobic broth. Values plotted for each point (i.e. isolate) are calculated from n = 3 biologically independent replicates (Source Data), and at least three isolates from each lineage were measured. Aerobic growth (D) was measured as exponential growth rate in standard culture conditions. Isolates are colour coded according to phylogenetic lineage, as defined in Fig. 2. Values plotted for each point (i.e. isolate) are calculated from n = 7 biologically independent replicates (Source Data), and at least three isolates from each lineage were measured. oprD mutations were associated with impaired growth under anaerobic conditions (P = 0.010), but not aerobic conditions (P = 0.950), as judged by a nested ANOVA. Data from isolates from different lineages are shown together because fitness measures did not differ between lineages nested within oprD genotype (P > 0.5). All statistical tests for this analysis are two-tailed. Source data are provided as a Source Data file.

References

    1. Jorth P, et al. Regional isolation drives bacterial diversification within cystic fibrosis lungs. Cell Host Microbe. 2015;18:307–319. doi: 10.1016/j.chom.2015.07.006. - DOI - PMC - PubMed
    1. Chung, H. et al. Global and local selection acting on the pathogen Stenotrophomonas maltophilia in the human lung. Nat. Commun.8, 14078 (2017). - PMC - PubMed
    1. Didelot X, Walker AS, Peto TE, Crook DW, Wilson DJ. Within-host evolution of bacterial pathogens. Nat. Rev. Microbiol. 2016;14:150–162. doi: 10.1038/nrmicro.2015.13. - DOI - PMC - PubMed
    1. Dickson RP, et al. Enrichment of the lung microbiome with gut bacteria in sepsis and the acute respiratory distress syndrome. Nat. Microbiol. 2016;1:1–9. doi: 10.1038/nmicrobiol.2016.113. - DOI - PMC - PubMed
    1. Stanley D, et al. Translocation and dissemination of commensal bacteria in post-stroke infection. Nat. Med. 2016;22:1277–1284. doi: 10.1038/nm.4194. - DOI - PubMed

Publication types