

Thresholds for the presence of glacial megafauna in central Europe during the last 60,000 years
- PMID: 36414639
- PMCID: PMC9681729
- DOI: 10.1038/s41598-022-22464-x
Thresholds for the presence of glacial megafauna in central Europe during the last 60,000 years
Abstract
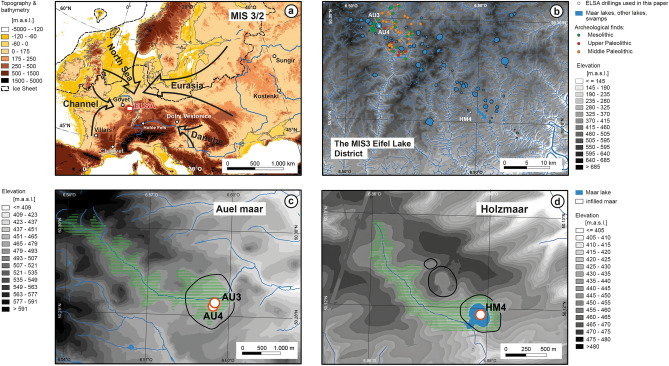
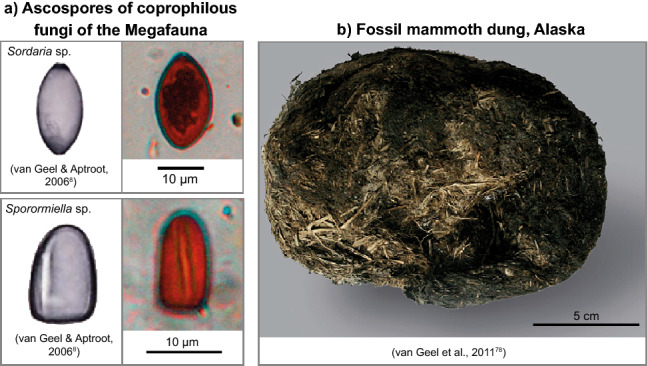
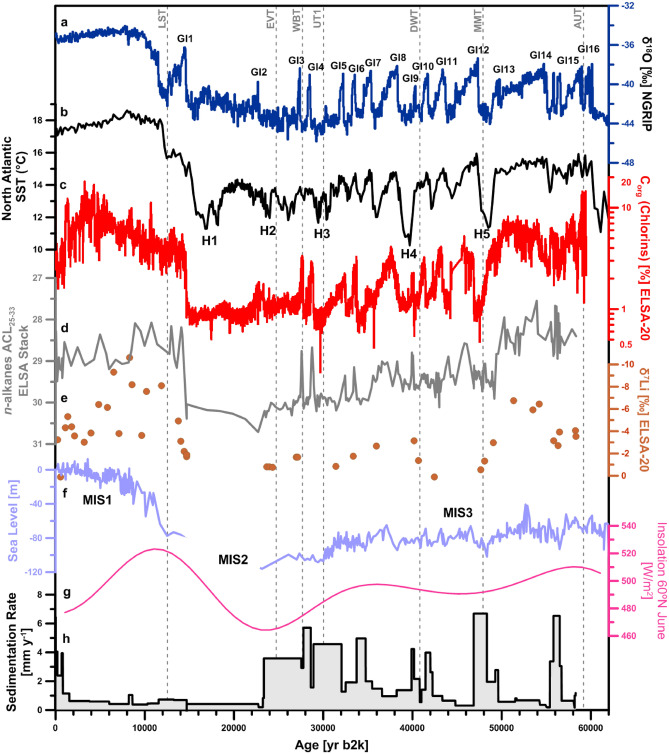
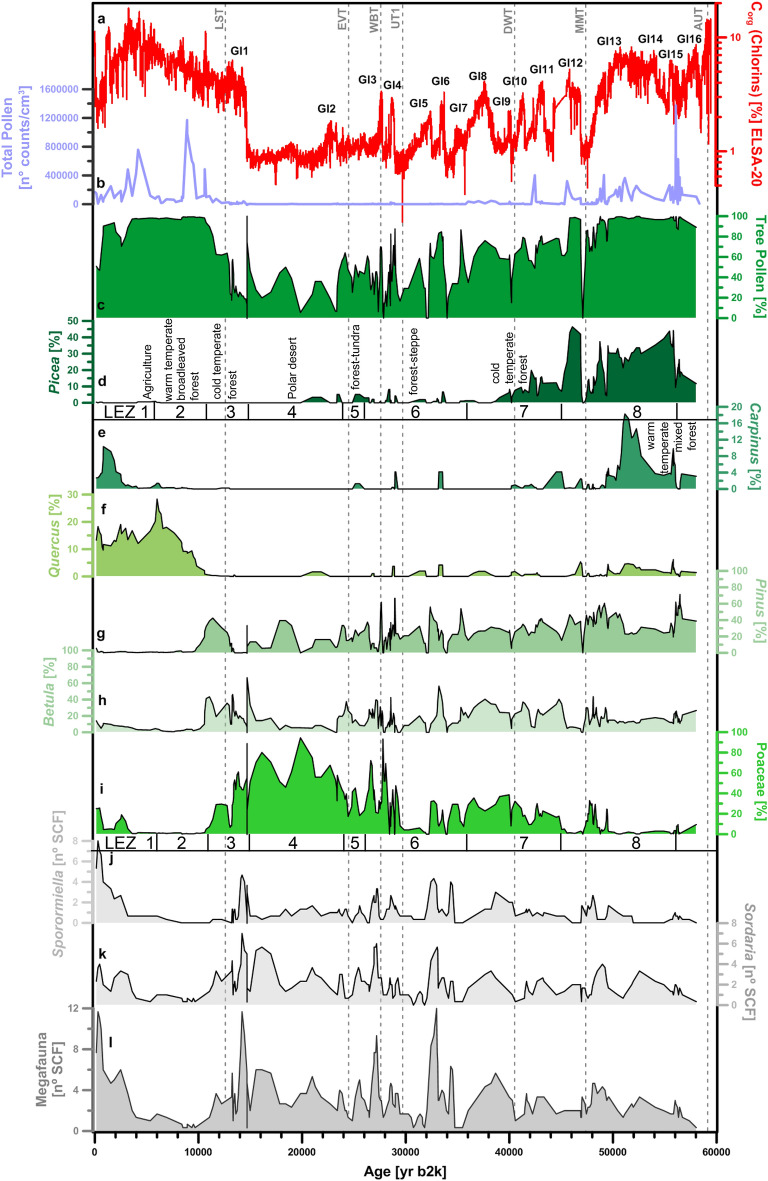
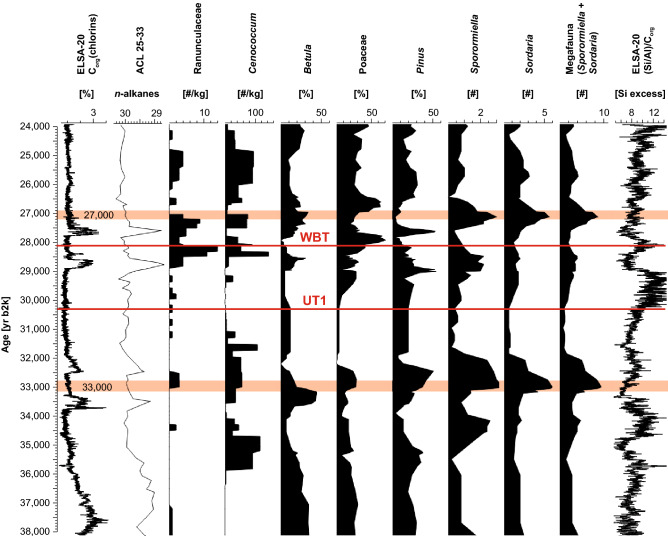
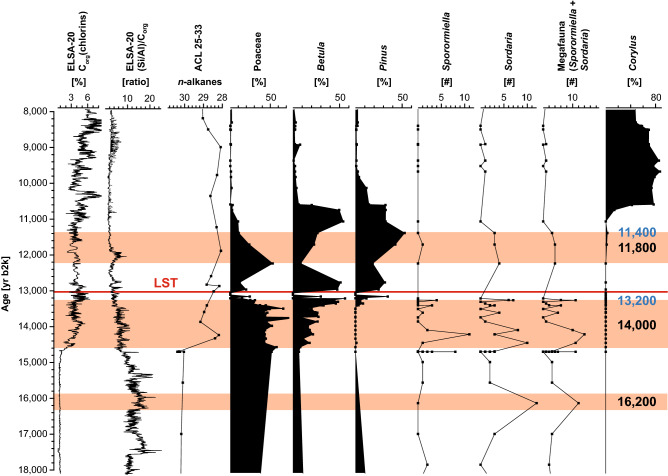
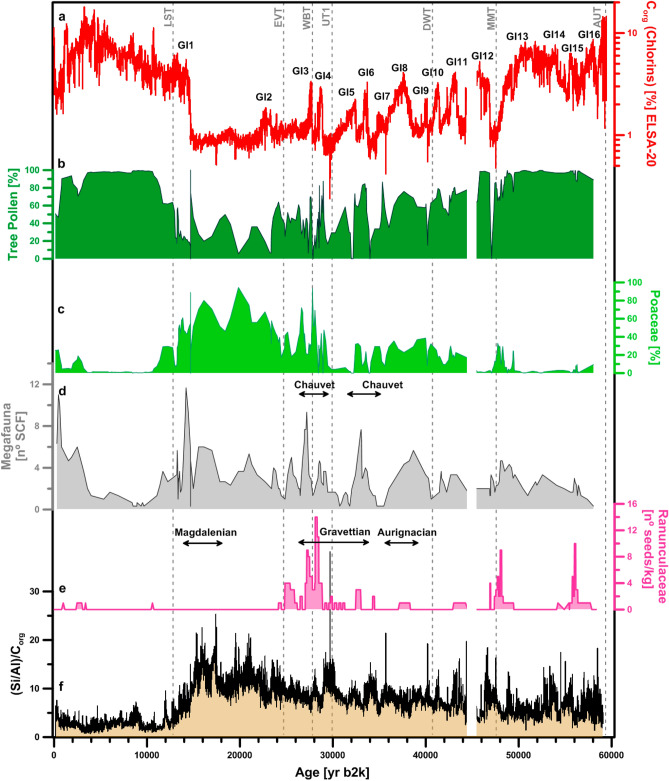
Lake sediment records from Holzmaar and the infilled maar of Auel (Eifel, Germany) are used to reconstruct landscape changes and megafauna abundances. Our data document a forested landscape from 60,000 to 48,000 yr b2k and a stepwise vegetation change towards a glacial desert after 26,000 yr b2k. The Eifel landscape was continuously inhabited from 48,000 to 9000 yr b2k by large mammals, documented by the presence of spores of coprophilous fungi from Sordaria and Sporormiella fungi that grow on fecal remains of the megafauna. Megafauna reached higher numbers during cold stadial climates but was present also during the warmer interstadials. Highest abundance was at 56,500/48,500/38,500/33,000/27,000/21,000/16,200/14,000 yr b2k, i.e. under different climate regimes. Some of these dates were associated with clear human presence, which indicates that megafauna was not overkilled by humans. In contrast, human presence could quite likely have been stimulated by the abundant food supply. Megafauna presence decreased significantly when tree abundance increased during interstadials. The Megafauna disappeared finally at 11,400 yr b2k with the development of the early Holocene forest cover, which appears to be the most important threshold for megafauna presence.
© 2022. The Author(s).
Conflict of interest statement
The authors declare no competing interests.
Figures
References
-
- Sirocko F, et al. Muted multidecadal climate variability in central Europe during cold stadial periods. Nat. Geosci. 2021;14:651–658. doi: 10.1038/s41561-021-00786-1. - DOI
-
- Sirocko F, et al. The ELSA-vegetation-stack: reconstruction of landscape evolution zones (LEZ) from laminated Eifel maar sediments of the last 60,000 years. Global Planet. Change. 2016;142:108–135. doi: 10.1016/j.gloplacha.2016.03.005. - DOI
-
- Sirocko F, et al. Multi-proxy dating of Holocene maar lakes and Pleistocene dry maar sediments in the Eifel, Germany. Quat. Sci. Rev. 2013;62:56–76. doi: 10.1016/j.quascirev.2012.09.011. - DOI
-
- Baker AG, Bhagwat SA, Willis KJ. Do dung fungal spores make a good proxy for past distribution of large herbivores? Quatern. Sci. Rev. 2013;62:21–31. doi: 10.1016/j.quascirev.2012.11.018. - DOI
Publication types
MeSH terms
LinkOut - more resources
Full Text Sources
