

Association of miR-144 levels in the peripheral blood with COVID-19 severity and mortality
- PMID: 36414650
- PMCID: PMC9681736
- DOI: 10.1038/s41598-022-23922-2
Association of miR-144 levels in the peripheral blood with COVID-19 severity and mortality
Abstract
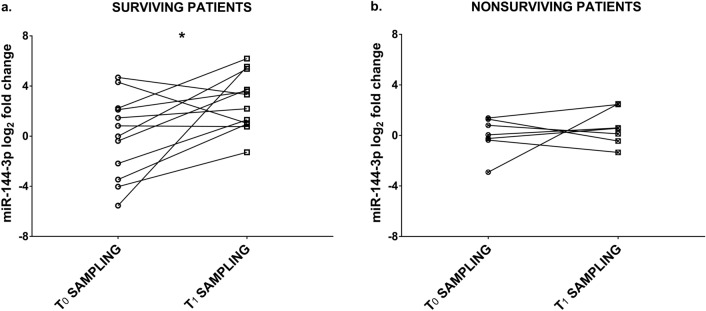
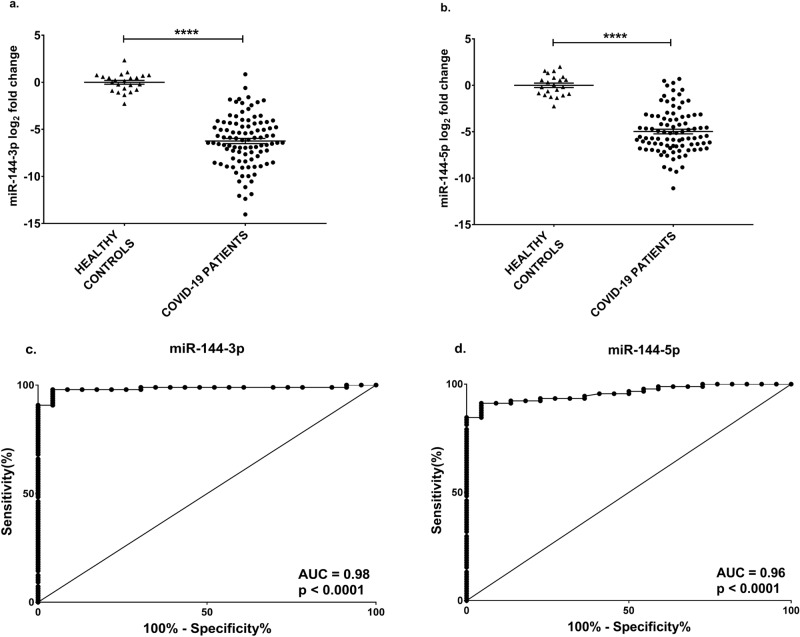
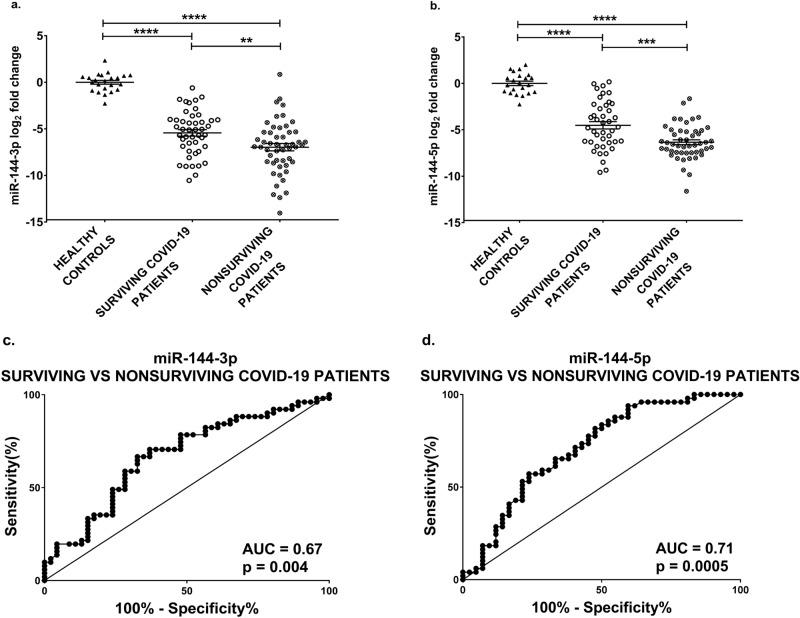
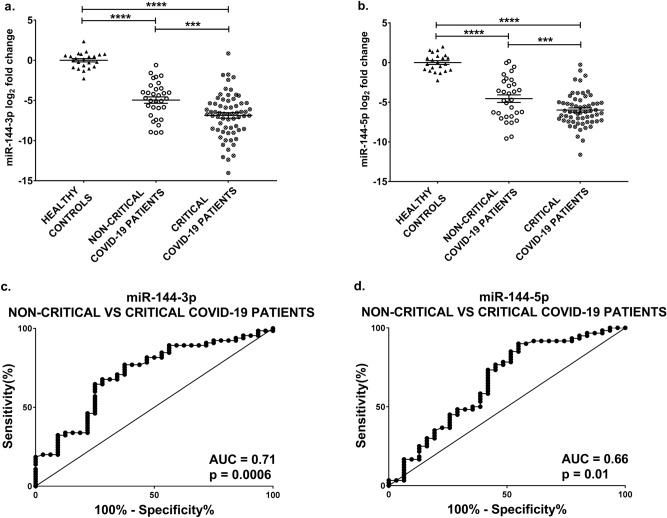
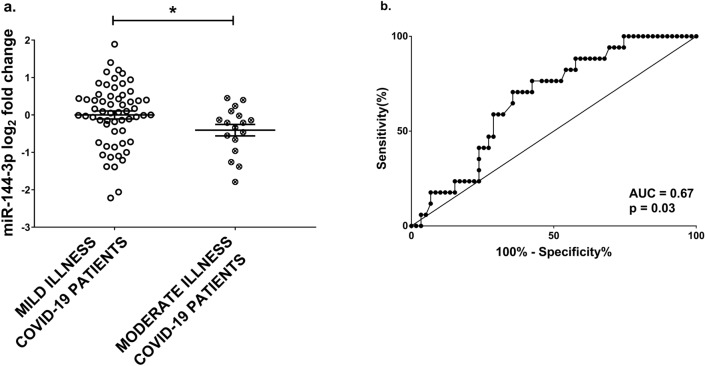
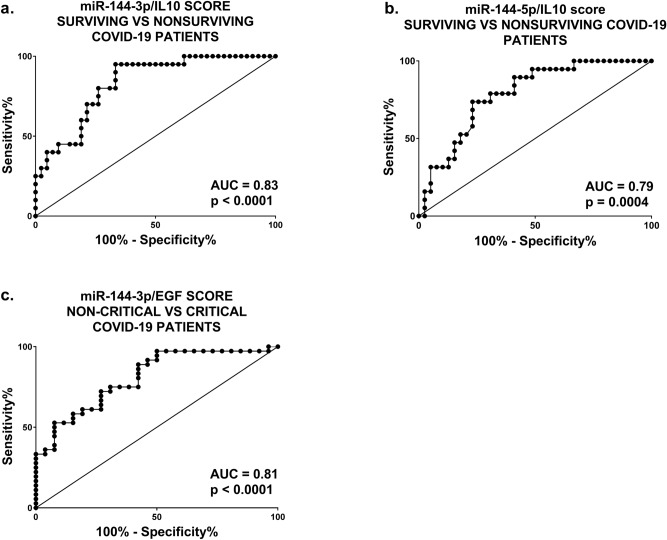
Coronavirus disease-2019 (COVID-19) can be asymptomatic or lead to a wide symptom spectrum, including multi-organ damage and death. Here, we explored the potential of microRNAs in delineating patient condition and predicting clinical outcome. Plasma microRNA profiling of hospitalized COVID-19 patients showed that miR-144-3p was dynamically regulated in response to COVID-19. Thus, we further investigated the biomarker potential of miR-144-3p measured at admission in 179 COVID-19 patients and 29 healthy controls recruited in three centers. In hospitalized patients, circulating miR-144-3p levels discriminated between non-critical and critical illness (AUCmiR-144-3p = 0.71; p = 0.0006), acting also as mortality predictor (AUCmiR-144-3p = 0.67; p = 0.004). In non-hospitalized patients, plasma miR-144-3p levels discriminated mild from moderate disease (AUCmiR-144-3p = 0.67; p = 0.03). Uncontrolled release of pro-inflammatory cytokines can lead to clinical deterioration. Thus, we explored the added value of a miR-144/cytokine combined analysis in the assessment of hospitalized COVID-19 patients. A miR-144-3p/Epidermal Growth Factor (EGF) combined score discriminated between non-critical and critical hospitalized patients (AUCmiR-144-3p/EGF = 0.81; p < 0.0001); moreover, a miR-144-3p/Interleukin-10 (IL-10) score discriminated survivors from nonsurvivors (AUCmiR-144-3p/IL-10 = 0.83; p < 0.0001). In conclusion, circulating miR-144-3p, possibly in combination with IL-10 or EGF, emerges as a noninvasive tool for early risk-based stratification and mortality prediction in COVID-19.
© 2022. The Author(s).
Conflict of interest statement
All authors have read the journal's authorship agreement and policy on disclosure of potential conflicts of interest. The manuscript has been reviewed by and approved by all authors.
Figures
Similar articles
-
Possible relation between expression of circulating microRNA and plasma cytokine levels in cases of pulmonary tuberculosis.J Infect Dev Ctries. 2022 Jul 28;16(7):1166-1173. doi: 10.3855/jidc.15831. J Infect Dev Ctries. 2022. PMID: 35905021
-
Bronchial Aspirate-Based Profiling Identifies MicroRNA Signatures Associated With COVID-19 and Fatal Disease in Critically Ill Patients.Front Med (Lausanne). 2022 Feb 3;8:756517. doi: 10.3389/fmed.2021.756517. eCollection 2021. Front Med (Lausanne). 2022. PMID: 35186962 Free PMC article.
-
Circulating miRNAs: Potential diagnostic role for coronavirus disease 2019 (COVID-19).Infect Genet Evol. 2021 Oct;94:105020. doi: 10.1016/j.meegid.2021.105020. Epub 2021 Jul 31. Infect Genet Evol. 2021. PMID: 34343725 Free PMC article.
-
Association of the peripheral blood levels of circulating microRNAs with both recurrent miscarriage and the outcomes of embryo transfer in an in vitro fertilization process.J Transl Med. 2018 Jul 4;16(1):186. doi: 10.1186/s12967-018-1556-x. J Transl Med. 2018. PMID: 29973278 Free PMC article.
-
Circulating Levels of Interleukin-6 and Interleukin-10, But Not Tumor Necrosis Factor-Alpha, as Potential Biomarkers of Severity and Mortality for COVID-19: Systematic Review with Meta-analysis.J Clin Immunol. 2021 Jan;41(1):11-22. doi: 10.1007/s10875-020-00899-z. Epub 2020 Oct 31. J Clin Immunol. 2021. PMID: 33128665 Free PMC article.
Cited by
-
Blood Features Associated with Viral Infection Severity: An Experience from COVID-19-Pandemic Patients Hospitalized in the Center of Iran, Yazd.Int J Clin Pract. 2024 Mar 12;2024:7484645. doi: 10.1155/2024/7484645. eCollection 2024. Int J Clin Pract. 2024. PMID: 38505695 Free PMC article.
-
Cardiovascular complications of diabetes: role of non-coding RNAs in the crosstalk between immune and cardiovascular systems.Cardiovasc Diabetol. 2023 May 24;22(1):122. doi: 10.1186/s12933-023-01842-3. Cardiovasc Diabetol. 2023. PMID: 37226245 Free PMC article. Review.
-
Circulating miRNA profiles in COVID-19 patients and meta-analysis: implications for disease progression and prognosis.Sci Rep. 2023 Dec 8;13(1):21656. doi: 10.1038/s41598-023-48227-w. Sci Rep. 2023. PMID: 38065980 Free PMC article.
-
Clinical and Molecular Barriers to Understanding the Pathogenesis, Diagnosis, and Treatment of Complex Regional Pain Syndrome (CRPS).Int J Mol Sci. 2025 Mar 11;26(6):2514. doi: 10.3390/ijms26062514. Int J Mol Sci. 2025. PMID: 40141156 Free PMC article.
-
Recent advances in the development and clinical application of miRNAs in infectious diseases.Noncoding RNA Res. 2024 Sep 2;10:41-54. doi: 10.1016/j.ncrna.2024.09.005. eCollection 2025 Feb. Noncoding RNA Res. 2024. PMID: 39296638 Free PMC article. Review.
References
-
- WHO. Coronavirus disease (COVID-19) pandemic. https://www.who.int/emergencies/diseases/novel-coronavirus-2019 (2022).
Publication types
MeSH terms
Substances
Grants and funding
- 101016072/EC | Horizon 2020 Framework Programme (EU Framework Programme for Research and Innovation H2020)
- CA17129/EC | Horizon 2020 Framework Programme (EU Framework Programme for Research and Innovation H2020)
- COVID-19/2020-1/14719577/miRCOVID/Fonds National de la Recherche Luxembourg (National Research Fund)
- 14716273/Fonds National de la Recherche Luxembourg (National Research Fund)
- FEDER, 2018-04-026-21/EC | European Regional Development Fund (Europski Fond za Regionalni Razvoj)
LinkOut - more resources
Full Text Sources
Medical
Molecular Biology Databases
