. 2022 Nov 21;5(1):1277.
doi: 10.1038/s42003-022-04243-6.

Angiopoietin-like 2 is essential to aortic valve development in mice

Affiliations

Angiopoietin-like 2 is essential to aortic valve development in mice

Pauline Labbé et al. Commun Biol. .

Abstract

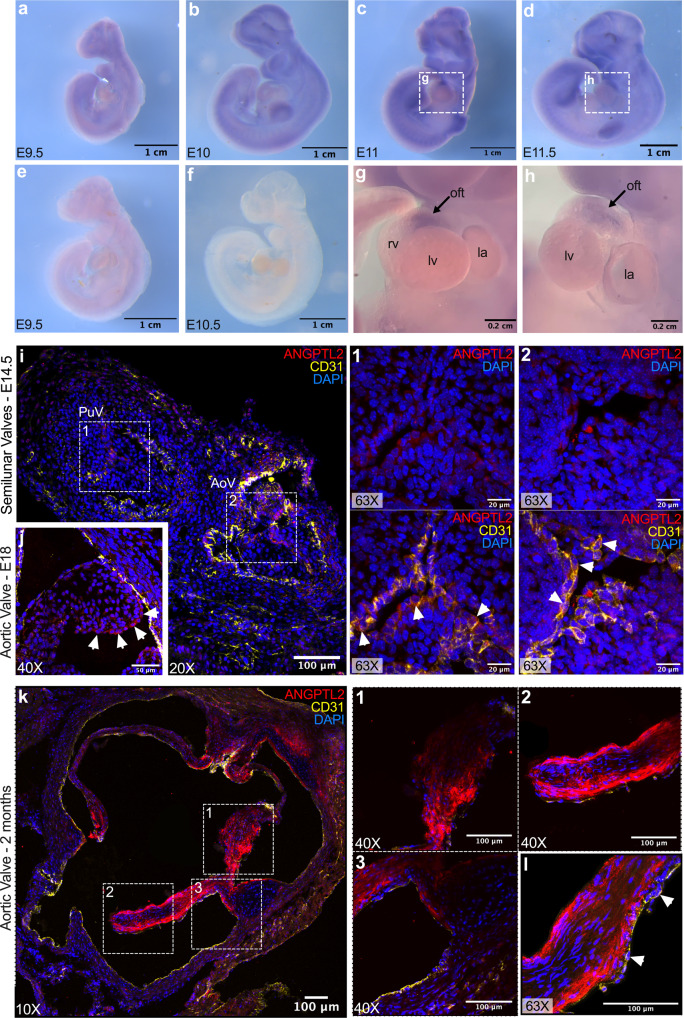
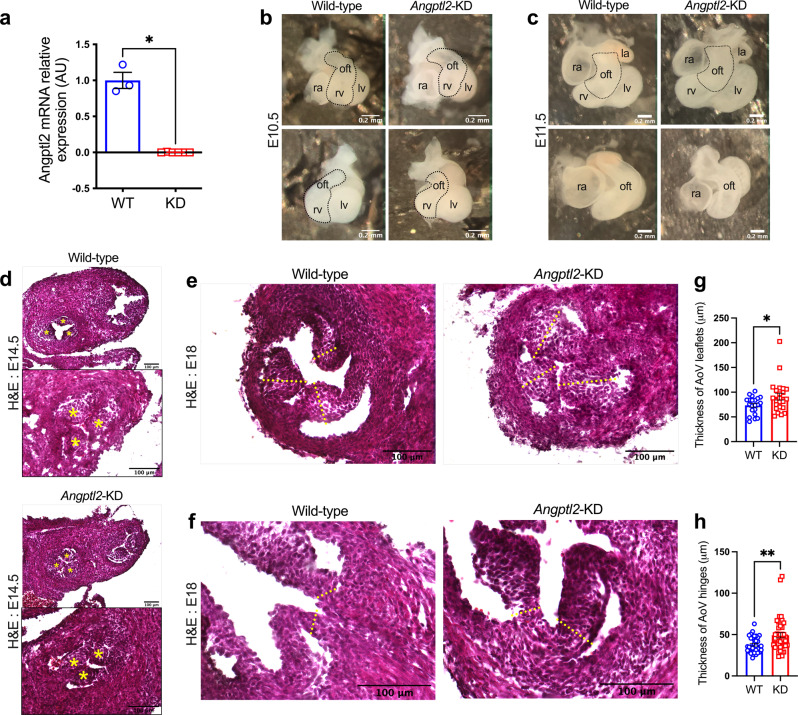
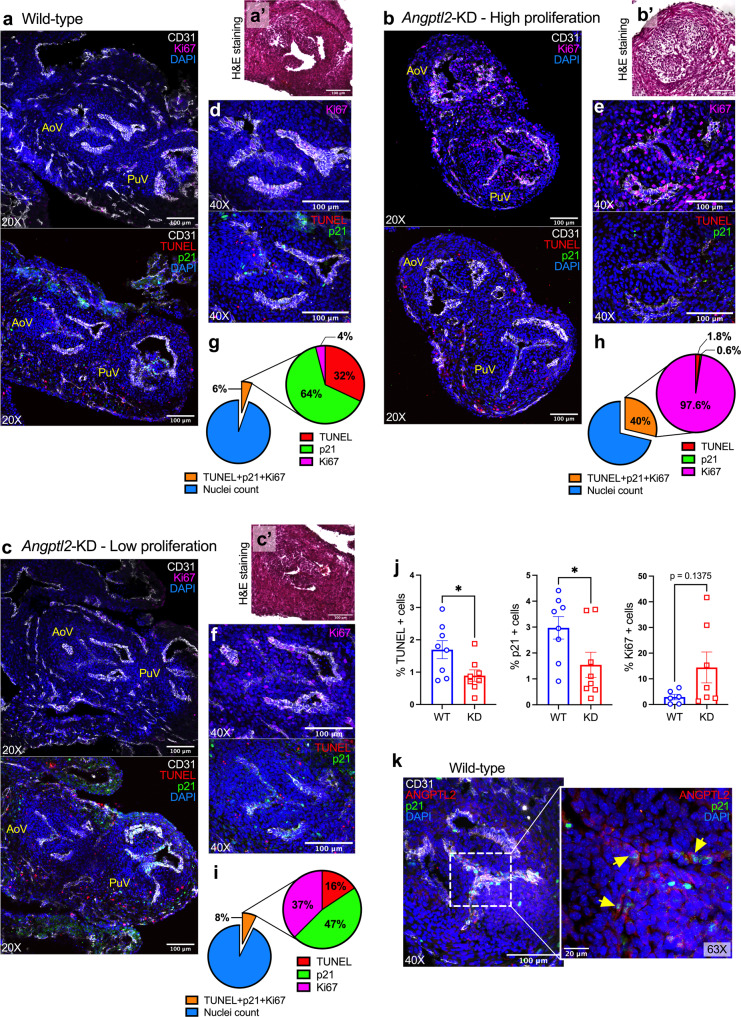
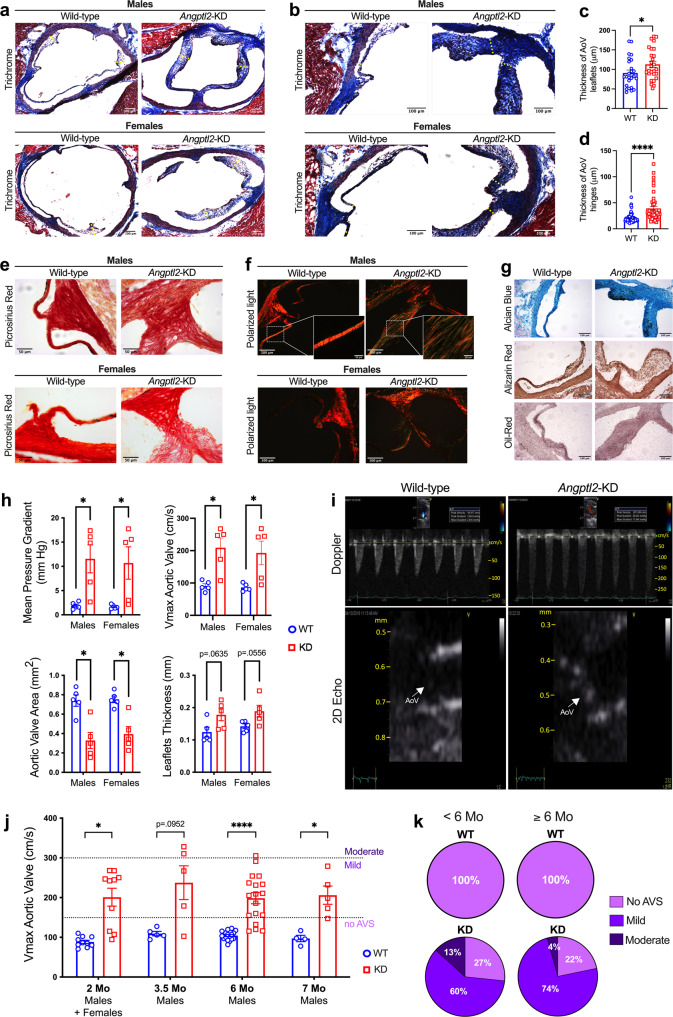
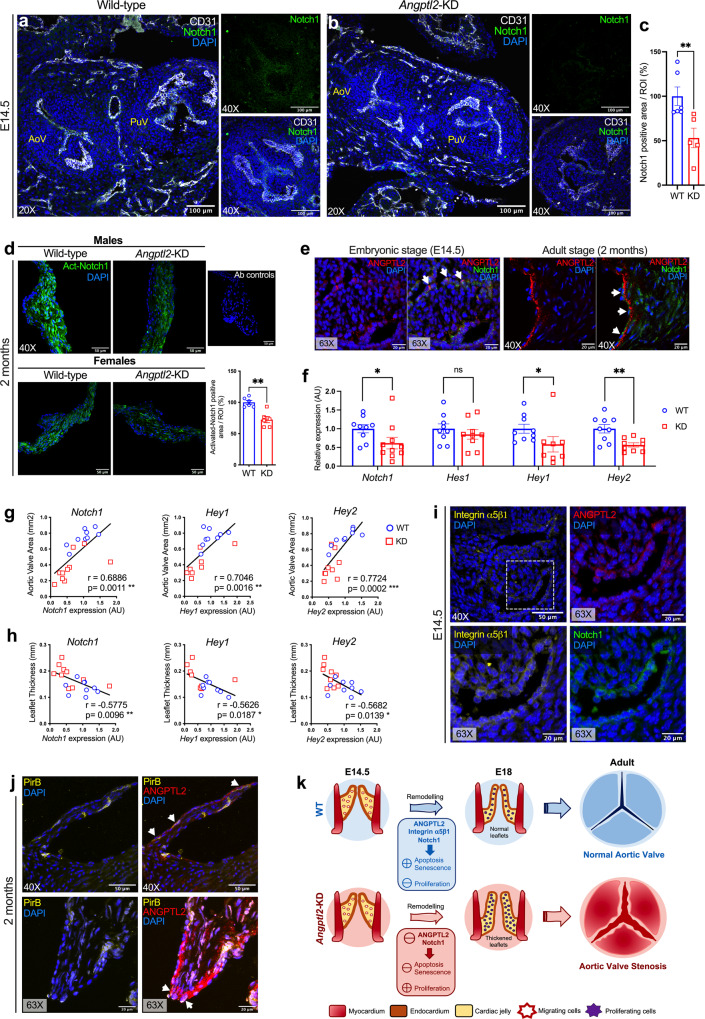
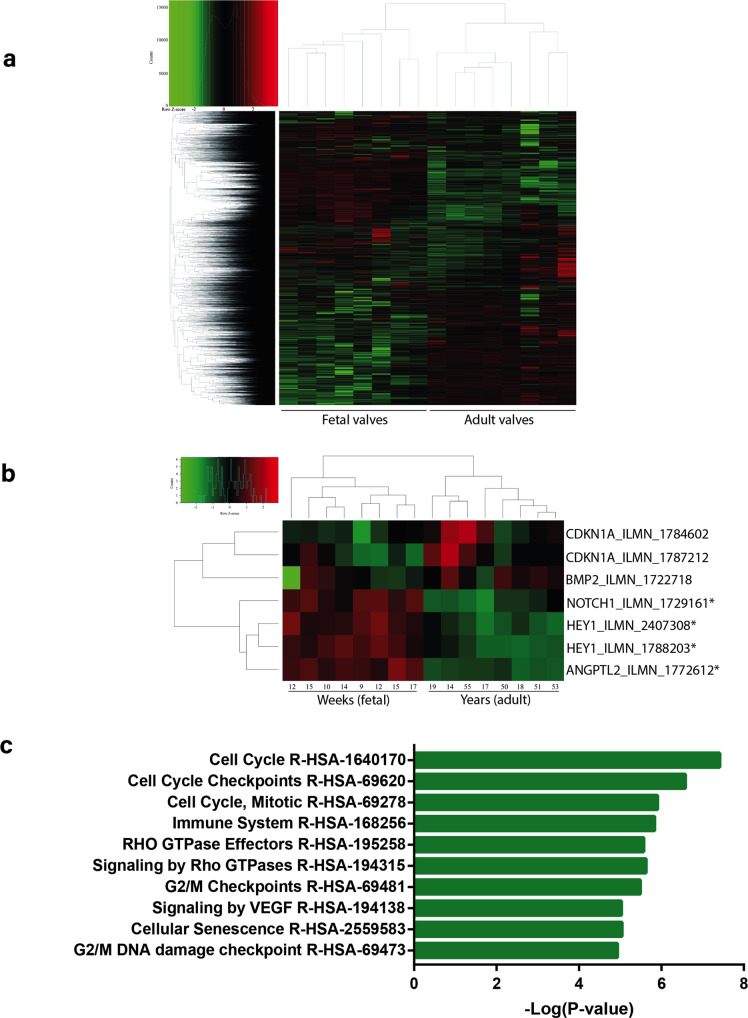
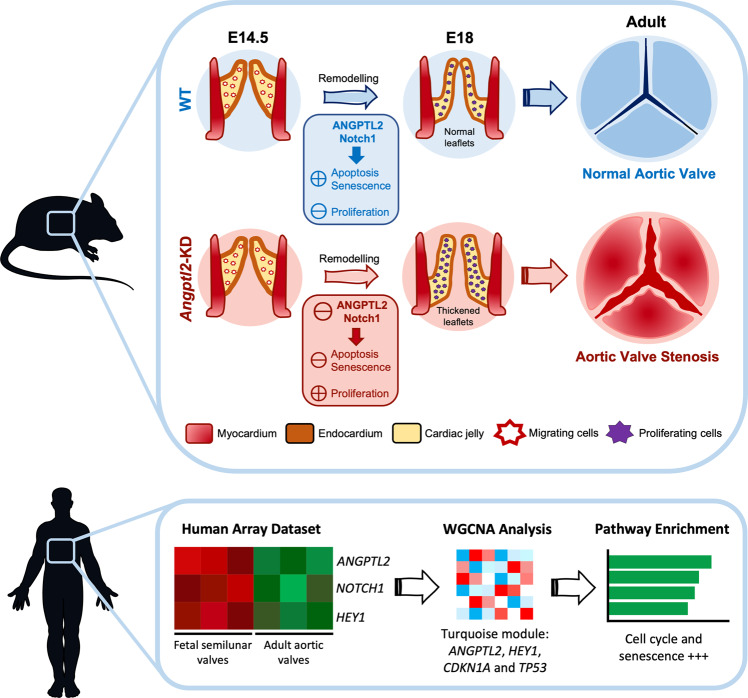
Aortic valve (AoV) abnormalities during embryogenesis are a major risk for the development of aortic valve stenosis (AVS) and cardiac events later in life. Here, we identify an unexpected role for Angiopoietin-like 2 (ANGPTL2), a pro-inflammatory protein secreted by senescent cells, in valvulogenesis. At late embryonic stage, mice knocked-down for Angptl2 (Angptl2-KD) exhibit a premature thickening of AoV leaflets associated with a dysregulation of the fine balance between cell apoptosis, senescence and proliferation during AoV remodeling and a decrease in the crucial Notch signalling. These structural and molecular abnormalities lead toward spontaneous AVS with elevated trans-aortic gradient in adult mice of both sexes. Consistently, ANGPTL2 expression is detected in human fetal semilunar valves and associated with pathways involved in cell cycle and senescence. Altogether, these findings suggest that Angptl2 is essential for valvulogenesis, and identify Angptl2-KD mice as an animal model to study spontaneous AVS, a disease with unmet medical need.


Conflict of interest statement

The authors declare no competing interests.

Figures

Fig. 1
Fig. 1. ANGPTL2 is expressed at early stages of AoV development in WT mice.
ad Representative views of in situ hybridizations with Angptl2 RNA probes on WT mice embryos at E9.5, E10, E11 and E11.5. e, f Representative views of in situ hybridizations with Angptl2 RNA probes on Angptl2-KD mice embryos at E9.5 and E10.5. g, h Higher magnifications of the heart region at E11 and E11.5; The outflow tract (oft) is indicated by black arrows. i, j Representative ANGPTL2 and CD31 protein expression by immunofluorescence in cardiac sections from (i) E14.5 and from (j) E18 embryo from WT mice. At a higher magnification (×63), white arrows show the expression of ANGPTL2 on the edge of the leaflet and indicate cells co-expressing ANGPTL2 and CD31 in E14.5 embryo. k Representative ANGPTL2 and CD31 protein expression by immunofluorescence in cardiac sections from 2-month old WT mice. l Higher magnification (×63) of ANGPTL2 and CD31 expression in AoV leaflets of WT mice: ANGPTL2 is not co-expressed with CD31-positive cells (indicated by white arrows). All images are representative of n = 3 independent experiments. DAPI staining was used to visualize cell nuclei.
Fig. 2
Fig. 2. Angptl2-KD mice exhibit AoV defects at embryonic stage.
a Angptl2 gene expression measured by quantitative RT-qPCR in AoV leaflets from adult male WT and Angptl2-KD mice. Data are mean ± SEM of n = 3 for WT and n = 6 for Angptl2-KD mice; *: p < 0.05 determined with Mann–Whitney U test. b, c Front and side views of representative hearts from E10.5 and E11.5 embryos from WT and Angptl2-KD mice. Images are representative of n = 3 independent experiments. d Representative heart sections from E14.5 embryos from WT and Angptl2-KD mice stained with Hematoxylin and Eosin. Higher magnification of AoV at E14.5 is shown in the bottom panel; the 3 leaflets of AoV are indicated by yellow stars. Images are representative of n = 3 independent experiments. e, f Representative AoV sections from E18 embryos from WT and Angptl2-KD mice stained with Hematoxylin and Eosin. The yellow dotted lines represent the regions used for quantification. Quantification of valve thickness shows the enlargement of both (g) the leaflets and (h) the hinges of AoV in E18 embryos from Angptl2-KD mice compared to WT. Data are means ± SEM of n = 8 for WT and n = 9 for Angptl2-KD mice; up to 3 leaflets (n = 21 for WT and n = 23 for Angptl2-KD mice) and 6 hinges (n = 34 for WT and n = 42 for Angptl2-KD mice) were quantified per section; *: p < 0.05 and **: p < 0.01 determined with unpaired t-test.
Fig. 3
Fig. 3. AoV defects in Angptl2-KD mouse embryos are associated with an impairment in the balance between embryonic apoptosis, senescence and proliferation.
Representative images (of n = 3 independent experiments) of TUNEL assay and Ki67, p21 and CD31 protein expression by immunofluorescence in cardiac sections from E14.5 embryos from WT (a) and Angptl2-KD mice (b, example of High proliferation; c example of Low proliferation), showing both aortic valve (AoV) and pulmonary valve (PuV). In the same WT or Angptl2-KD embryo AoV section, H&E staining (a’–b’–c’) and its corresponding TUNEL assay, Ki67 and p21 protein expression (df) are shown. Pie charts illustrate the percentage of marked cells of the total nuclei, and the corresponding proportion (%) of TUNEL, p21 and Ki67-positive cells within the marked cells (gi). j For TUNEL/p21: The graphs represent means ± SEM of n = 4 embryos per genotype (2 sections analyzed/embryo; *: p < 0.05 determined with unpaired t-test); For Ki67: The graph represents means ± SEM of n = 6 embryos for WT and n = 7 embryos for Angptl2-KD (1 section analyzed/embryo; p = 0.1375 determined with Mann–Whitney U test). k Representative images (of n = 3 independent experiments) of ANGPTL2 and p21 protein expression by immunofluorescence in AoV from E14.5 embryos from WT mice. Higher magnification (×63) shows cells co-expressing ANGPTL2 and p21 (indicated by yellow arrows). DAPI staining was used to visualize cell nuclei.
Fig. 4
Fig. 4. Adult Angptl2-KD mice develop spontaneous AVS.
a, b Representative AoV sections (of n = 11–13 independent experiments per genotype) from 2-month old male and female WT and Angptl2-KD mice stained using Masson’s Trichrome. The yellow dotted lines show the regions used for the quantification. Quantification of valve thickness shows the enlargement of both (c) the leaflets and (d) the hinges of AoV in male and female Angptl2-KD mice compared to WT. Data are means ± SEM of n = 13 for WT mice, 7 males and 6 females; n = 11 for Angptl2-KD mice, 5 males and 6 females; up to 3 leaflets (n = 25 for WT and n = 27 for Angptl2-KD mice) and 6 hinges (n = 64 for WT and n = 51 for Angptl2-KD mice) were quantified per section. *: p < 0.05 determined with unpaired t-test. e Representative AoV sections (of n = 3 independent experiments) from 2-month old male and female WT and Angptl2-KD mice stained using Picrosirius red under white light and (f) Picrosirius red under polarized light. g Representative AoV sections (of n = 3 independent experiments) from 2-month old male WT and Angptl2-KD mice stained using alcian blue, alizarin red and oil-red. h Echocardiographic measurements of the mean pressure gradient, the peak aortic jet velocity (Vmax), the leaflets thickness and the AoV area in male (n = 5) and female (n = 5) WT and Angptl2-KD mice at 2 month-old (n = 10 mice per genotype). Data are means ± SEM of n mice. *: p < 0.05 determined with Mann–Whitney U test. i Pulsed-wave Doppler velocity tracings illustrating the increased cross AoV velocity in an Angptl2-KD male mouse compared to a WT littermate and 2D images of AoV (indicated by white arrows) in the long-axis view from WT and Angptl2-KD mice. j Echocardiographic measurements of the maximal trans-aortic velocity (Vmax) in Angptl2-KD mice compared to WT littermates from 2 months to 7 months. Data are means ± SEM of: n = 10 mice per genotype at 2 months; n = 5 mice per genotype at 3.5 months; n = 18 mice per genotype at 6 months; n = 4 WT mice and n = 5 Angptl2-KD mice at 7 months. *: p < 0.05 determined with unpaired t-test or Mann–Whitney U test according to the normality of distribution. k Pie charts illustrating the repartition of the phenotype severity for the AVS (defined according to Vmax: a Vmax ≥150 cm/s corresponds to a mild AVS, while a Vmax ≥300 cm/s corresponds to a moderate AVS) in young (<6-month-old) and older (≥6-month-old) WT and Angptl2-KD mice.
Fig. 5
Fig. 5. AoV defects in Angptl2-KD mice are associated with reduced Notch1 signalling.
a, b Representative images (of n = 3–4 independent experiments per genotype) of Notch1 and CD31 protein expression by immunofluorescence in cardiac sections showing both aortic valve (AoV) and pulmonary valve (PuV); Higher magnification (×40; right panels) showing AoV from E14.5 embryos of WT and Angptl2-KD mice. c The total Notch1 positive area/ROI was quantified. Data are means ± SEM of n = 3 WT and n = 4 Angptl2-KD embryos (1 to 2 sections analyzed/embryo); **: p < 0.01 determined with Mann–Whitney U test. d Representative images (of n = 6 independent experiments) of activated Notch1 (Act-Notch1) protein expression by immunofluorescence in cardiac histological sections from adult 2-month old WT and Angptl2-KD male and female mice. The total Act-Notch1 positive area/ROI was quantified. Data are means ± SEM; n = 6 mice per genotype, males and females were pooled; **: p < 0.01 determined with Mann–Whitney U test. e Representative images (of n = 3 independent experiments) of ANGPTL2 and Notch1 protein expression by immunofluorescence in AoV from E14.5 embryos and 2-month old WT mice. Cells co-expressing ANGPTL2 and Notch1 are indicated by white arrows in AoV leaflets of WT mice. f Gene expression by quantitative RT-qPCR in AoV leaflets from 4-month old males and females Angptl2-KD mice compared to their WT littermates. Data are means ± SEM of n = 9 WT and n = 8–10 Angptl2-KD mice; *: p < 0.05 and **: p < 0.01 determined with t-test or Mann–Whitney U test according to the normality of distribution. g, h Linear correlations between Notch1, Hey1 and Hey2 mRNA levels in AoV leaflets and AoV area (g) and leaflet thickness (h) in male and female 4-month old WT and Angptl2-KD mice. Data are means ± SEM of n = 17–19 mice; *: p < 0.05 determined with Spearman or Pearson correlation tests according to the normality of distribution. i Representative images (of n = 3 independent experiments) of Integrin α5β1 receptor, ANGPTL2 and Notch1 protein expression by immunofluorescence in AoV from E14.5 embryo from WT mice. Higher magnification shows that Integrin α5β1, ANGPTL2 and Notch1 are expressed in the border of the leaflet. j Representative images (of n = 3 independent experiments) of PirB receptor and ANGPTL2 protein expression by immunofluorescence in AoV from 2-month old WT mice. Higher magnification shows that PirB and ANGPTL2 are co-expressed in some cells in the border of the leaflet (indicated by white arrows). DAPI staining was used to visualize cell nuclei. k Proposed mechanism for AVS pathogenesis in adult Angptl2-KD mice; At E14.5 during semilunar valve remodelling, the KD of Angptl2 induces a decrease in Notch1 signalling via Integrin α5β1 receptors in AoV leaflets, which in turn deregulates the fine balance between cell apoptosis, senescence and proliferation. Lower apoptosis and senescence combined with higher cellular proliferation induce inadequate AoV maturation, and lead to thickened AoV leaflets at E18. These structural, cellular and molecular dysfunctions observed at embryonic stage progress to AVS in adult Angptl2-KD mice, in both male and female mice. k Was adapted from Lin et al..
Fig. 6
Fig. 6. ANGPTL2 is enriched in human fetal semilunar valves and associated with cell cycle and senescence pathways.
a Heatmap of genes expressed in human fetal semilunar valves and adult AoV leaflets. b Close-up view of the heatmap showing significant enrichment of ANGPTL2, HEY1 and NOTCH1 in fetal semilunar valves; *significantly expressed genes (FDR < 0.05 and log2 FC > 1.5). c Pathway enrichment for the turquoise heart valve gene module obtained from WGCNA.
Fig. 7
Fig. 7. Summarized evidence for a role of ANGPTL2 as a potentially new essential player in valvulogenesis in mice and human.
At E14.5 during semilunar valve remodelling in mice, the KD of Angptl2 induces a decrease in Notch1 signalling via Integrin α5β1 receptors in AoV leaflets, which in turn deregulates the fine balance between cell apoptosis, senescence and proliferation. Lower apoptosis and senescence combined with higher cellular proliferation induce inadequate AoV maturation, and lead to thickened AoV leaflets at E18. The thickened AoV leaflets during embryogenesis are associated with the development of AVS in adult mice. ANGPTL2 is also enriched in human fetal semilunar valves compared to adult AoV and is associated with pathways related to cell cycle and senescence. Parts of the figure were drawn by using pictures from Servier Medical Art. Servier Medical Art by Servier is licensed under a Creative Commons Attribution 3.0 Unported License (https://creativecommons.org/licenses/by/3.0/). The upper panel was adapted from Lin et al..

References

    1. Osnabrugge RL, et al. Aortic stenosis in the elderly: disease prevalence and number of candidates for transcatheter aortic valve replacement: a meta-analysis and modeling study. J. Am. Coll. Cardiol. 2013;62:1002–1012. doi: 10.1016/j.jacc.2013.05.015. - DOI - PubMed
    1. Yadgir S, et al. Global, Regional, and National Burden of Calcific Aortic Valve and Degenerative Mitral Valve Diseases, 1990-2017. Circulation. 2020;141:1670–1680. doi: 10.1161/CIRCULATIONAHA.119.043391. - DOI - PubMed
    1. LaHaye S, Lincoln J, Garg V. Genetics of valvular heart disease. Curr. Cardiol. Rep. 2014;16:487. doi: 10.1007/s11886-014-0487-2. - DOI - PMC - PubMed
    1. Virani SS, et al. Heart Disease and Stroke Statistics-2020 Update: A Report From the American Heart Association. Circulation. 2020;141:e139–e596. doi: 10.1161/CIR.0000000000000757. - DOI - PubMed
    1. Eisenberg LM, Markwald RR. Molecular Regulation of Atrioventricular Valvuloseptal Morphogenesis. Circ. Res. 1995;77:1–6. doi: 10.1161/01.RES.77.1.1. - DOI - PubMed

Publication types

Substances

LinkOut - more resources