. 2022 Nov 21;5(1):1276.
doi: 10.1038/s42003-022-04214-x.

Brain sex-dependent alterations after prolonged high fat diet exposure in mice

Affiliations

Brain sex-dependent alterations after prolonged high fat diet exposure in mice

Valentina Murtaj et al. Commun Biol. .

Abstract

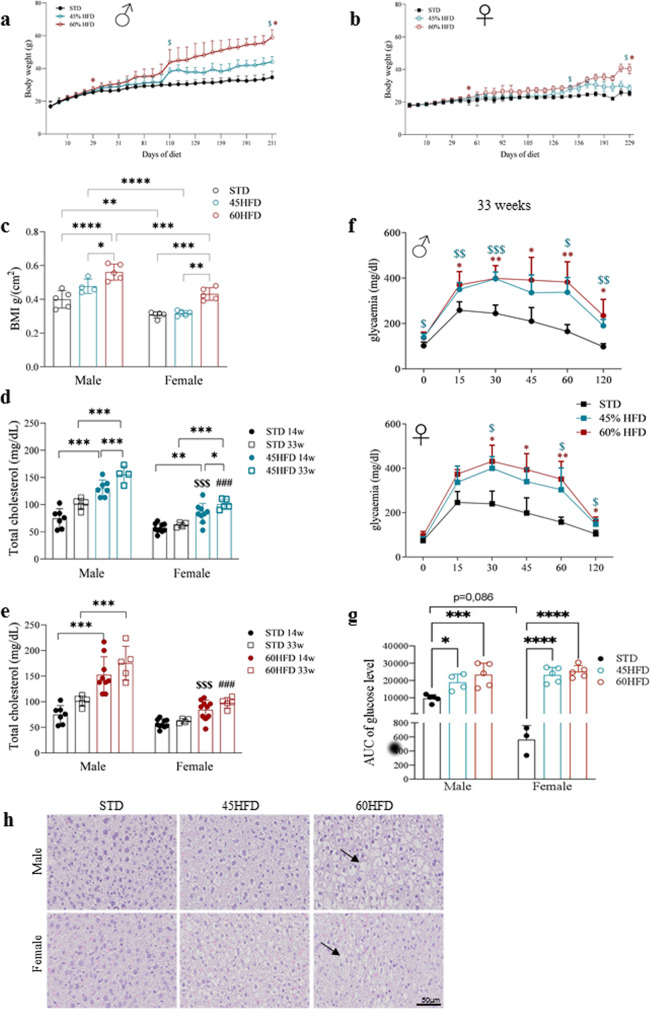
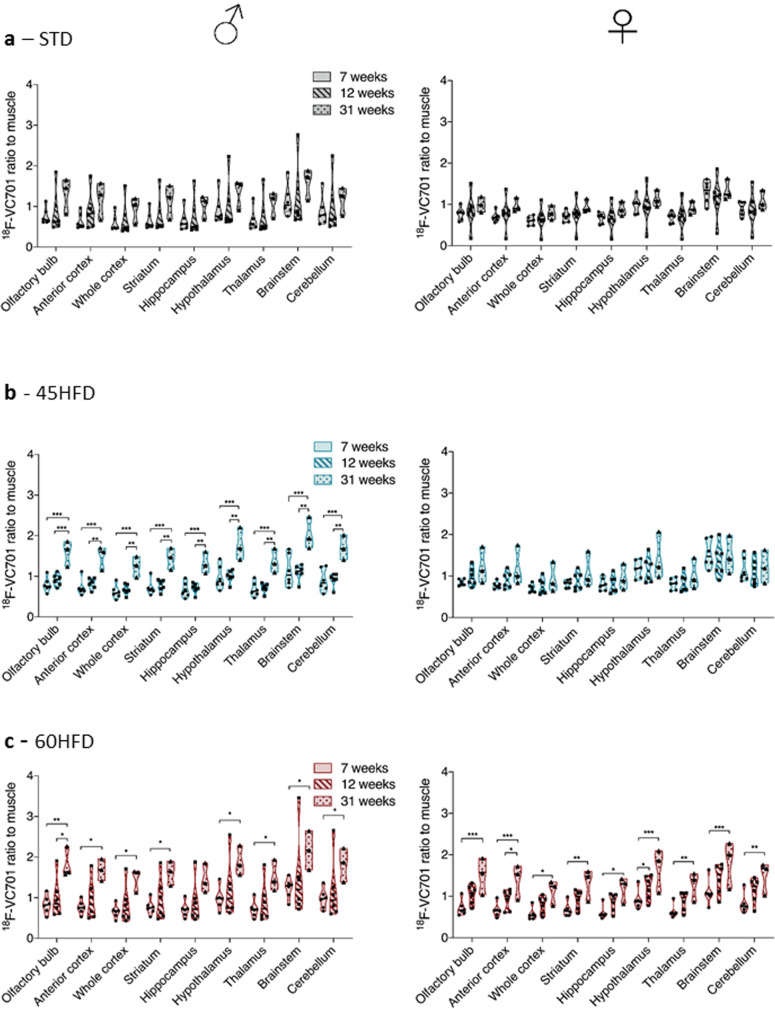
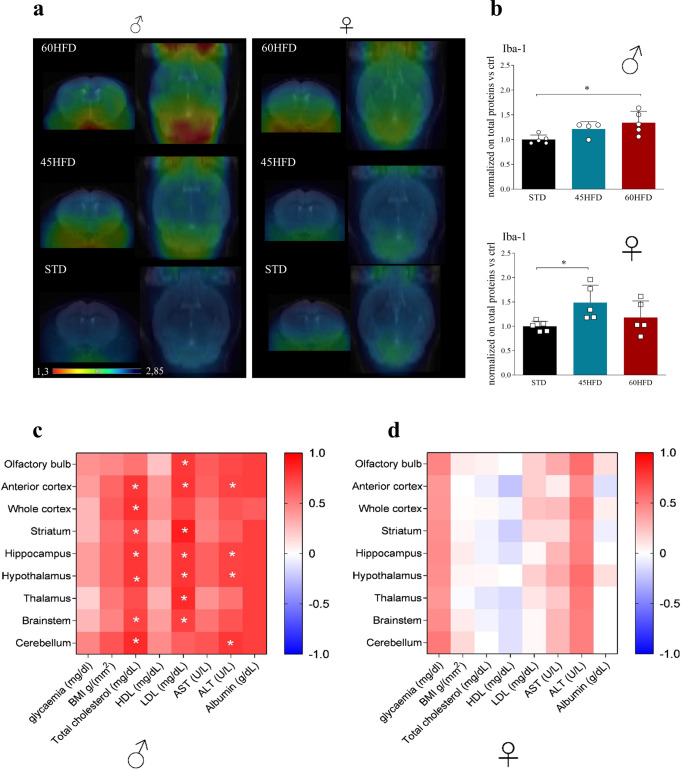
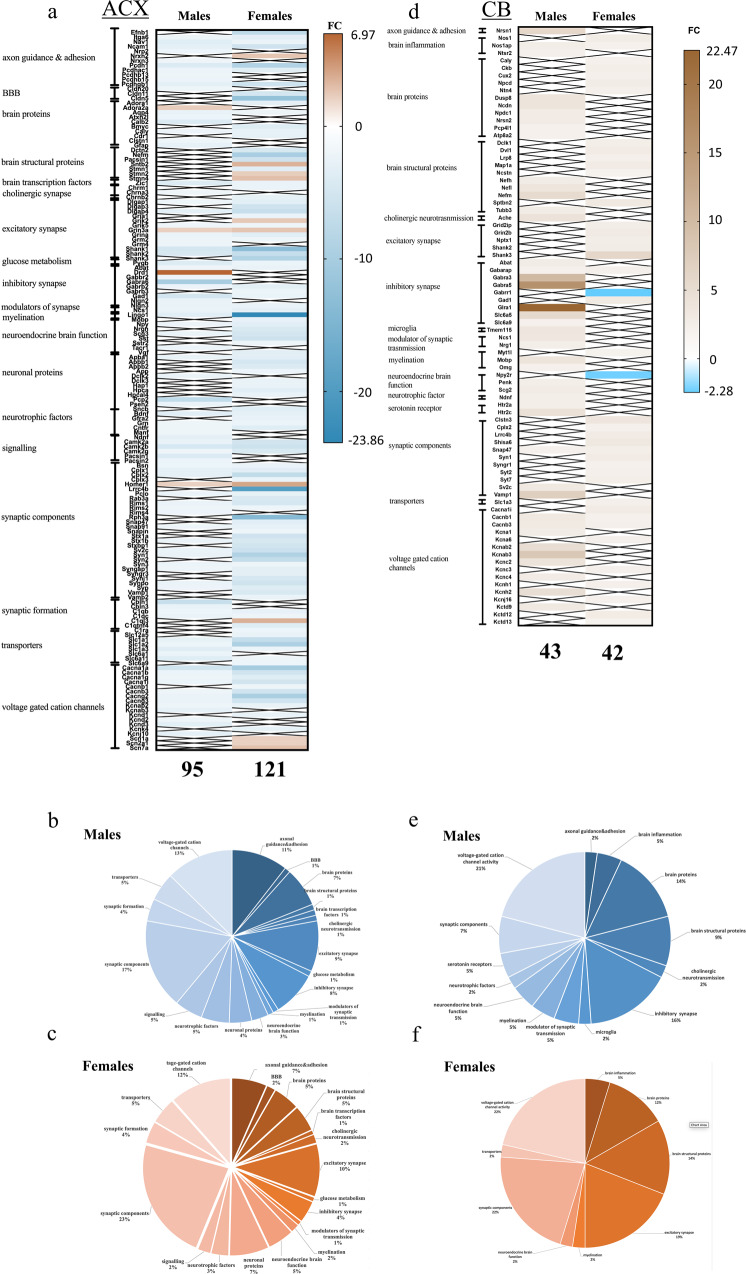
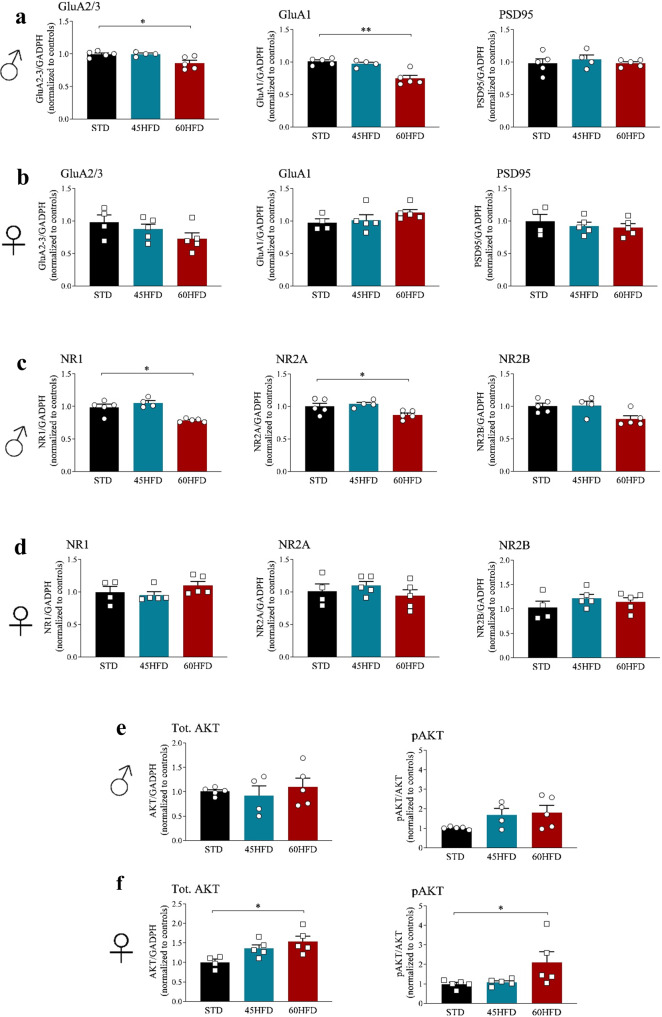
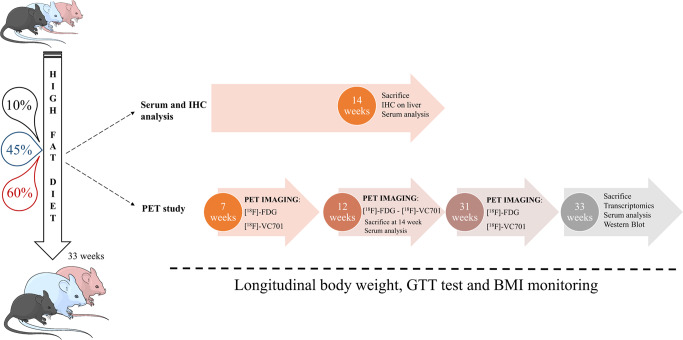
We examined effects of exposing female and male mice for 33 weeks to 45% or 60% high fat diet (HFD). Males fed with either diet were more vulnerable than females, displaying higher and faster increase in body weight and more elevated cholesterol and liver enzymes levels. Higher glucose metabolism was revealed by PET in the olfactory bulbs of both sexes. However, males also displayed altered anterior cortex and cerebellum metabolism, accompanied by a more prominent brain inflammation relative to females. Although both sexes displayed reduced transcripts of neuronal and synaptic genes in anterior cortex, only males had decreased protein levels of AMPA and NMDA receptors. Oppositely, to anterior cortex, cerebellum of HFD-exposed mice displayed hypometabolism and transcriptional up-regulation of neuronal and synaptic genes. These results indicate that male brain is more susceptible to metabolic changes induced by HFD and that the anterior cortex versus cerebellum display inverse susceptibility to HFD.


Conflict of interest statement

The authors declare no competing interests.

Figures

Fig. 1
Fig. 1. High-fat diet mouse model characterization and sex differences.
Body weight (a males; b females), *p ≤ 0.05 60% HFD vs STD, $p ≤ 0.05 45% HFD vs STD (statistical significance in a, b was maintained from the indicated time points until sacrifice). c BMI in males and females at 33 weeks of diet. d Total cholesterol serum levels in males and females 45HFD vs STD controls at 14 and 33 weeks of diet. e Total cholesterol serum levels in males and females 60HFD vs STD controls at 14 weeks and 33 weeks of diet; STD controls are the same for 45/60HFD vs STD males analysis and for 45/60HFD vs STD females analysis; for both d, e $$$p ≤ 0.001 14-weeks HFD male vs female; ###p ≤ 0.001 33-weeks HFD male vs female; f glucose tolerance test in male and female mice at 31 weeks of diet; *60HFD vs STD, $45HFD vs STD. g Total area under the curve (AUC) of glucose level at 33 weeks of diet in male and female mice. h Hematoxylin and eosin staining of liver sections in STD, 45% HFD, and 60% HFD in males (upper panels) and females (lower panels) at 14 weeks of diet, black arrow indicates lipid droplets. Data are expressed as mean ± SD. Data in a, b, f were analyzed using one-way ANOVA for repeated measures with diets and time points as variables. Data in c, g were analyzed using two-way ANOVA including sex and diet as variable. Data in d, e were analyzed using three-way ANOVA, in which diet, sex, and time point were considered. Multiple statistical tests were followed by Tukey’s post hoc test for multiple comparison; */$p ≤ 0.05, **/$$p ≤ 0.01, ***/$$$/###p ≤ 0.001, ****p ≤ 0.0001.
Fig. 2
Fig. 2. PET imaging evaluation of glucose metabolism in HFD mice.
a [18F]-FDG total brain glucose uptake, standardized uptake value (SUV), in males (left) and females (right) at 31 weeks; data are expressed as mean ± SD of SUV radiotracer uptake. [18F]-FDG glucose ratio to total brain uptake in males (left) and females (right) olfactory bulb (b), anterior cortex (c), and cerebellum (d) at 31 weeks. Data are expressed as mean ± SD of ratio over total brain radiotracer uptake; All data were analyzed using one-way ANOVA followed by Dunnett’s post hoc test for multiple comparison (*p ≤ 0.05). e, f Heat map of [18F]-FDG brain uptake Spearman’s r correlations with basal glycemia, BMI, and serum parameters at 31 weeks of diet in males (e, left) and females (f, right) mice. The pseudocolor bar represents the values ranging from −1 (blue, negative correlation) to +1 (red, positive correlation). The white asterisk represents correlations that are statistically significant (*p < 0.05).
Fig. 3
Fig. 3. Longitudinal [18F]-VC701 uptake ratio of different brain regions in male (left panels) and female (right panels) mice at 7, 12, and 31 weeks of diet.
a STD (control diet), b 45% HFD (45HFD), c 60% HFD (60HFD). Data are expressed as mean ± SD of ratio to muscle radiotracer uptake. All data were analyzed using two-way ANOVA in which within each row, each column mean was compared, followed by Tukey’s post hoc test for multiple comparison (*p ≤ 0.05; **p ≤ 0.01; ***p ≤ 0.001).
Fig. 4
Fig. 4. Brain neuroinflammation after HFD regimen.
a Representative panel of [18F]-VC701 tracer brain uptake in male (left) and female (right) mice of all groups (STD, 45% HFD and 60% HFD) after 31 weeks. PET images are reported as brain to muscle ratio. b Western blot quantification of Iba-1 protein in male and female anterior cortex at 35 weeks of diet. Data, normalized on total proteins, are analyzed using Kruskal–Wallis test followed by Dunn’s post hoc test and are expressed as mean ± S.E.M. vs STD (*p ≤ 0.05). c, d Heat maps of Spearman’s r correlation coefficients between [18F]-VC701 brain uptake and basal glycemia, BMI, and serum level parameters at 31 weeks of diet in male (c) and female (d) mice. The pseudocolor bars represent the values ranging from −1 (blue, negative correlation) to +1 (red, positive correlation). The white asterisks represent correlations that are statistically significant (*p ≤ 0.05).
Fig. 5
Fig. 5. Anterior cortex and cerebellar transcriptomic profiles after HFD regimen.
af Histograms resuming anterior cortex DEGs in 60% HFD and 45% HFD mice including numbers of up- and down-regulated genes compared to STD control group in males (a) and females (c). Volcano plots representing the DEGs results of 60% HFD (b left) and 45% HFD (b right) compared to STD diet in males. Volcano plots representing the DEGs results of 60% HFD (d left) and 45% HFD (d right) compared to STD diet in females. Red dots indicate up-regulated genes while green dots indicate down-regulated genes that are statistically significant. Venn diagram of common and diet specific DEGs for the 60% and 45% HFD male (e) and female (f) mice. gl) Histograms resuming cerebellar differentially expressed genes (DEGs) in 60% HFD and 45% HFD mice including numbers of up- and down-regulated genes compared to STD control group in males (g) and females (i). Volcano plots representing the DEGs results of 60% HFD (h left) and 45% HFD (h right) compared to STD diet in males. Volcano plots representing the DEGs results of 60% HFD (j left) and 45% HFD (j right) compared to STD diet in females. Venn diagram of common and diet specific DEGs for the 60% and 45% HFD male (k) and female (l) mice. Red dots indicate up-regulated genes while green dots indicate down-regulated genes that are statistically significant. Data were analyzed using one-way ANOVA with the cut-off p value ≤0.05 and fold change ≥2.
Fig. 6
Fig. 6. Differentially expressed neuronal genes in anterior cortex (ACX) and cerebellum (Cb) of females and males.
a Heatmap representing the different functional classes of genes found within neuronal DGEs in ACX of males and females on HFD60 vs STD. b, c Pie diagrams showing the representation of different gene categories among the neuronal DGEs in males (blue) and in females (brown). d Heatmap representing the different classes of neuronal DGEs in Cb of males on HFD45 and females on HFD60 vs STD. e, f Pie diagrams showing the representation of the different gene categories among the neuronal DGEs in males (blue) and in females (brown). The pseudocolor bars shows the fold change: up-regulated (brown, max value 6.97 in a, max value 22.47 in d), down-regulated (light blue, max value −23.86 in a; max value −2.28 in d). The X in the Heatmap indicates the absence of the gene in the list.
Fig. 7
Fig. 7. Post mortem analysis of anterior cortex.
a Western blot analysis of AMPA receptor subunits: GLUA2/3, GLUA1 and PSD95 protein in anterior cortex of male mice and female mice b at 33 weeks of diet. c Western blot analysis of NMDA receptors subunits NR1, NR2A, NR2B, in the anterior cortex of male and female mice d at 33 weeks of diet. e Total AKT and phosphorylated AKT in male and female mice f at 33 weeks of diet. Data are analyzed using Kruskal–Wallis test followed by Dunn’s post hoc test and are expressed as mean ± S.E.M. of normalization on total proteins vs control (*p ≤ 0.05).
Fig. 8
Fig. 8. Schematic representation of the experimental study design showing on the left the three experimental groups fed with three different diets varying in their lipidic contents (10% STD, 45% HFD45, 60% HFD60).
On the right, a diagram represents the studies conducted on the three experimental groups and the time points. Two main sets of experiments were conducted, as indicated by the arrows. In the first experiment, animals on the three diet regimens were sacrificed at 14 weeks and analyzed for biochemical parameters (serum evaluation) and liver immunohistochemistry (IHC); in the second experiment, animals underwent longitudinal PET imaging studies and were sacrificed at 33 weeks of the diet regimen for ex vivo investigation including transcriptomic, biochemical serum evaluation and western blotting. All the animals used in the study were monitored longitudinally for body weight, glucose tolerance and body mass index (BMI).

References

    1. Duan Y, et al. Inflammatory links between high fat diets and diseases. Front. Immunol. 2018;9:2649. - PMC - PubMed
    1. Perry RJ, Samuel VT, Petersen KF, Shulman GI. The role of hepatic lipids in hepatic insulin resistance and type 2 diabetes. Nature. 2014;510:84–91. - PMC - PubMed
    1. Yi, Y. & An, J. Sex differences in risk factors for metabolic syndrome in the Korean population. Int. J. Environ. Res. Public Health17, 9513 (2020). - PMC - PubMed
    1. Balakrishnan M, et al. Women have a lower risk of nonalcoholic fatty liver disease but a higher risk of progression vs men: a systematic review and meta-analysis. Clin. Gastroenterol. Hepatol. 2021;19:61.e15–71.e15. - PMC - PubMed
    1. Beam CR, et al. Differences between women and men in incidence rates of dementia and Alzheimer’s disease. J. Alzheimers Dis. 2018;64:1077–1083. - PMC - PubMed

Publication types