. 2022 Nov 22;12(1):188.
doi: 10.1186/s13578-022-00924-1.

Defb19 regulates the migration of germ cell and is involved in male fertility

Affiliations

Defb19 regulates the migration of germ cell and is involved in male fertility

Jing Jin et al. Cell Biosci. .

Abstract

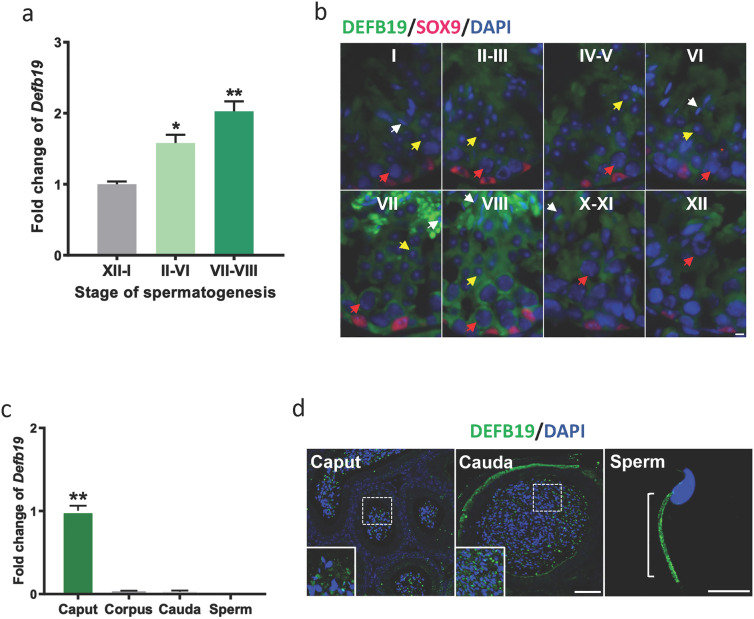
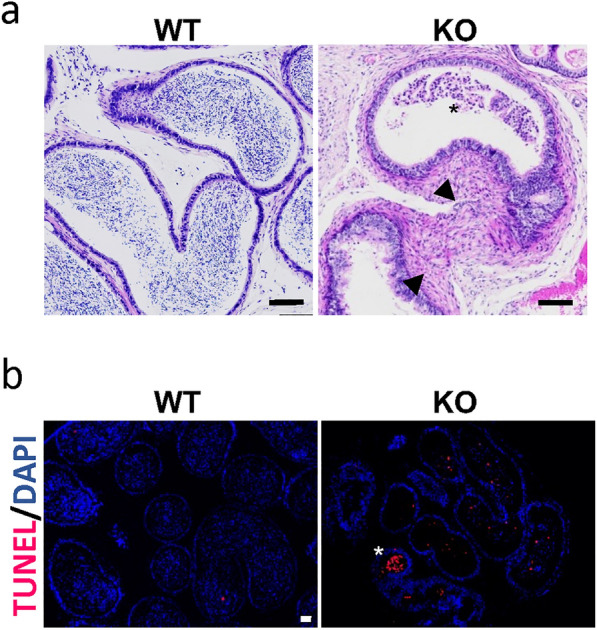
β-defensins are small antimicrobial peptides that play essential roles in male fertility. Although several members of the β-defensin family are preferentially expressed in the testis, their involvement in spermatogenesis remains elusive. In this study, we have characterized the expression and function of Defb19 in mouse testis. Our results showed that Defb19 is expressed in both Sertoli cells and germ cells. Overexpression of Defb19 in the 15P-1 Sertoli cell line decreases the expression of cell junction molecules and promotes the matrix adhesion and migration of Sertoli cells. Recombinant DEFB19 and conditioned medium of Defb19-overexpressed 15P-1 cells promote the migration of GC2-spd spermatocyte cell line. Knockout of Defb19 in mouse by CRISPR/Cas9 resulted in male subfertility with testicular and epididymal atrophy. A marked increase in apoptosis and a significant decrease in the sperm count were observed in the KO mice. Together, our study has uncovered an important role of Defb19 in male fertility by regulating the migration of both the Sertoli cells and the germ cells. Our study has shed new light on the functions of β-defensins in the testis.

Keywords: Cell migration; Male fertility; Spermatogenesis; β-defensin.


Conflict of interest statement

The authors declare that they have no competing interests.

Figures

Fig. 1
Fig. 1
The expression profile of Defb19 in the male reproductive tract of mice. a RT-qPCR analysis comparing the expression of Defb19 in the indicated stages of spermatogenesis (n = 3 mice each with three technical replicates). GAPDH was used as internal control. b Representative images of frozen sections of testis immunofluorescence staining (n = 3 mice) showing the expression of DEFB19 (green) in germ cells and Sertoli cells. SOX9 (red) marks the nuclei of Sertoli cells, DAPI (blue) marks cell nuclei. Red arrowhead indicate spermatocyte, Yellow arrowhead indicate round spermatid, and white arrowhead is spermatid, respectively, Scale bar = 5 μm. c RT-qPCR analysis comparing the expression of Defb19 in three segments, caput, corpus and cauda of epididymis (n = 3 mice each with three technical replicates) and in matured sperm. GAPDH was used as internal control. d Representative immunofluorescence staining images of paraffin-embed epididymis section (n = 3 mice) showing the expression of DEFB19 (green), DAPI (blue) marks cell nuclei, Scale bar = 50 μm in the epididymis, scale bar = 10 μm in the sperm. Data are presented as means ± SD, analysed by One-way ANOVA combined Tukey’s multiple comparisons test. * p < 0.05, ** p < 0.01
Fig. 2
Fig. 2
Overexpression of Defb19 alters cell adhesion and motility of Sertoli cell. a, b RT-qPCR analysis (a) and representative immunofluorescence staining images (b) comparing the expression of Defb19 in Defb19- or vector control-transduced 15P-1 Sertoli cell line. DEFB19 was marked by green. DAPI (blue) marks cell nuclei. Scale bar = 20 μm. c Representative Western blot result of ES proteins (E-Cadherin - CDH1, N-Cadherin – CDH2 and β-Catenin – CTNNB1) and TJ proteins (ZO-1, Occludin - OCLD, Claudin3 – CLDN3, and Claudin11 – CLDN11) in Defb19-overexpressed and vector control transduced 15P-1 lines. GAPDH was used as loading control. d Quantification of Western blot results (n = 3 independent experiments). (e) Representative phase contrast images of adhesion assay showing the attachment of indicated 15P-1 lines on fibronectin (FN) at indicated time points. Attached cells were marked by red dashed line. f MTS assay quantifying the number of attached cells in adhesion assay (e, n = 3 independent experiments). g Representative time-lapse imaging images showing the migration of indicated 15P-1 lines at indicated time points. Red bars indicate the cell boundaries. h Quantitation of the migration rate of 15P-1 cells in the time-lapse migration assay at indicated time points (n = 3 independent experiments). Data are presented as means ± SD, analyzed by Student’s t test (AC). * p < 0.05, ** p < 0.01
Fig. 3
Fig. 3
DEFB19 acts as a chemoattractant for spermatocyte migration. a, b Representative images and corresponding quantification of wound healing assay comparing the closure rate of scratch area both in GC1-Spg (a) and GC2-Spd (b) treated with 400ng/ml rDEFB19 and vehicle control (n = 3 independent experiments). c, d Representative images and corresponding quantitative analyses of transwell migration assay comparing the number of GC1-Spg and GC2-Spd (n = 8 independent experiments) migrating through the transwell in response to 400 ng/ml rDEFB19 treatment or vehicle control. e Schematic diagram showing the setup of GC1-spg/GC2-Spd and 15P-1 co-cultured transwell migration assay. f Representative images showing the migrated GC1-spg co-cultured with Defb19-overexpressed or vector control-transduced 15P-1 lines. Corresponding quantitative analyses is shown on the bottom panel (n = 3 independent experiments). g Representative images showing the migrated GC2-spd after co-cultured with Defb19-overexpressed or vector control-transduced 15P-1 lines. Corresponding quantitative analyses of transwell migration assay is shown on the right (n = 3 independent experiments). Data are presented as means ± SD, analyzed by Student’s t test. ** p < 0.01
Fig. 4
Fig. 4
Knockout of Defb19 leads to male subfertility. a Representative immunofluorescence staining images of paraffin-embed testis section showing the protein expression of DEFB19 (green) in WT and KO mice (n = 5 mice). Sertoli cells were marked by SOX9 (red) and nuclei were counterstained with DAPI (blue). Scale bar = 50 μm. b Representative images of the testis and the epididymis of KO and WT mice. c Tissue to body weight ratio of the testis and epididymis of KO and WT mice (n = 4 mice). d, e Number of sperm isolated from the epididymis and vas deferens (e, n = 6 mice) and the motility of sperm (e, n = 5 mice) in WT and KO mice. f Quantitation of the number of litters sired by WT females after cross breeding with KO or WT male. Data are presented as means ± SD, analysed by Student’s t test. * p < 0.05, ** p < 0.01, *** p < 0.001
Fig. 5
Fig. 5
Spermatogenic defects in Defb19 KO mice. a Representative hematoxylin (nuclei, blue) and eosin (cytoplasm, red) staining images of paraffin-embedded testis showing the cell composition and cell morphology at indicated stage of seminiferous tubules of WT and KO mice (n = 6 mice). Scale bar = 20 μm. b Representative immunofluorescence staining images showing the expression of claudin 11 (CLDN11, green) in the testis of WT and KO mice. DAPI (blue) marks cell nuclei. Scale bar = 10 μm. c Representative images of TUNEL assays showing the apoptotic cells in the WT and KO testes. Corresponding quantitation s shown on the right panel (n = 4 mice). TUNEL (red) marks the apoptotic cell and DAPI (blue) marks cell nuclei. Arrowhead indicates the TUNEL + cells. Scale bar = 50 μm. d Representative specific staining images of paraffin-embedded testis showing the RBs at indicated stages of the testis from indicated groups (n = 4 mice). The cytoplasm is pink. The RB is blue (arrowheads). Scale bar = 10 μm. e Representative PNA-lectin staining images of paraffin-embedded testis showing the acrosome of developing spermatid from indicated groups (n = 6 mice), PNA (green) marks the acrosome of spermatid and DAPI (blue) marks cell nuclei. Scale bar = 20 μm. Data are presented as means ± SD, analysed by Student’s t test. ** p < 0.01
Fig. 6
Fig. 6
Abnormalities in the epididymis of Defb19 KO mice. a Representative hematoxylin (nuclei, blue) and eosin (cytoplasm, red) staining images of paraffin-embedded epididymis showing the accumulation of non-sperm cells (asterisk) in the lumen of KO mice (n = 3). Fibrosis (arrowhead) associated with tissue atrophy was also noted in the epididymis of KO mice. b Representative images of TUNEL assays showing the apoptotic cells in the WT and KO epididymis. TUNEL (red) marks the apoptotic cell and DAPI (blue) marks cell nuclei. Asterisk indicates the TUNEL + cells. a, b Scale bar = 50 μm

Similar articles

Cited by

References

    1. Oakberg EF. A description of spermiogenesis in the mouse and its use in analysis of the cycle of the seminiferous epithelium and germ cell renewal. Am J Anat. 1956;99(3):391–413. doi: 10.1002/aja.1000990303. - DOI - PubMed
    1. Yan HH, Mruk DD, Lee WM, Cheng CY. Cross-talk between tight and anchoring junctions-lesson from the testis. Adv Exp Med Biol. 2008;636:234–54. doi: 10.1007/978-0-387-09597-4_13. - DOI - PMC - PubMed
    1. Mruk DD, Cheng CY. Cell-cell interactions at the ectoplasmic specialization in the testis. Trends Endocrinol Metab. 2004;15(9):439–47. doi: 10.1016/j.tem.2004.09.009. - DOI - PubMed
    1. Chen H, Fok KL, Yu S, Jiang J, Chen Z, Gui Y, et al. CD147 is required for matrix metalloproteinases-2 production and germ cell migration during spermatogenesis. Mol Hum Reprod. 2011;17(7):405–14. doi: 10.1093/molehr/gar013. - DOI - PubMed
    1. Chen H, Fok KL, Jiang X, Jiang J, Chen Z, Gui Y, et al. CD147 regulates apoptosis in mouse spermatocytes but not spermatogonia. Hum Reprod. 2012;27(6):1568–76. doi: 10.1093/humrep/des050. - DOI - PubMed