. 2022 Jan-Dec;14(1):2143218.
doi: 10.1080/19490976.2022.2143218.

Atypical enteropathogenic E. coli are associated with disease activity in ulcerative colitis

Affiliations

Atypical enteropathogenic E. coli are associated with disease activity in ulcerative colitis

Maximilian Baumgartner et al. Gut Microbes. 2022 Jan-Dec.

Abstract

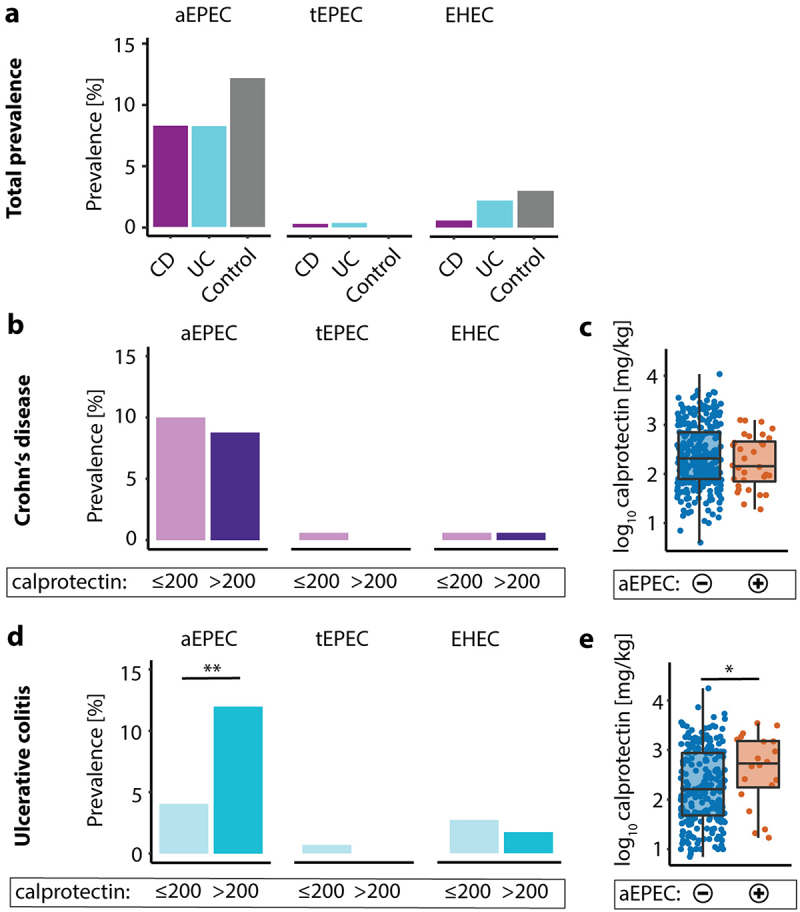
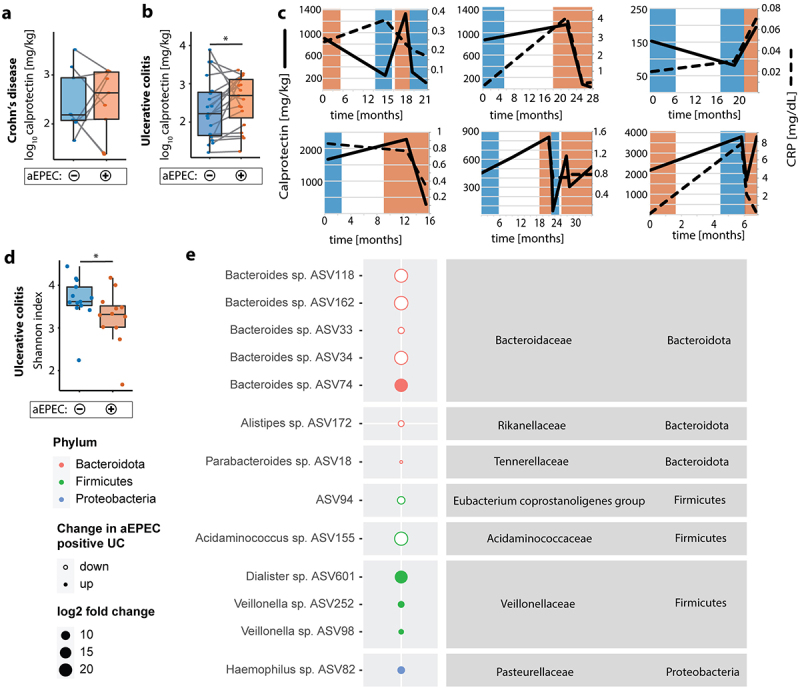
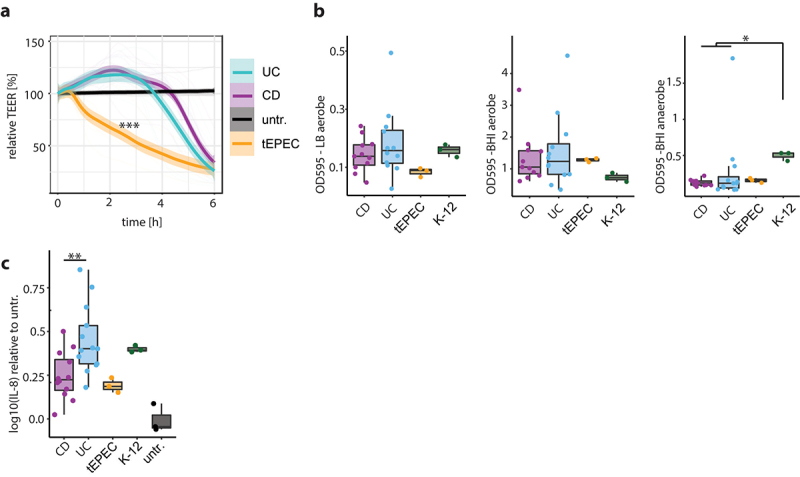
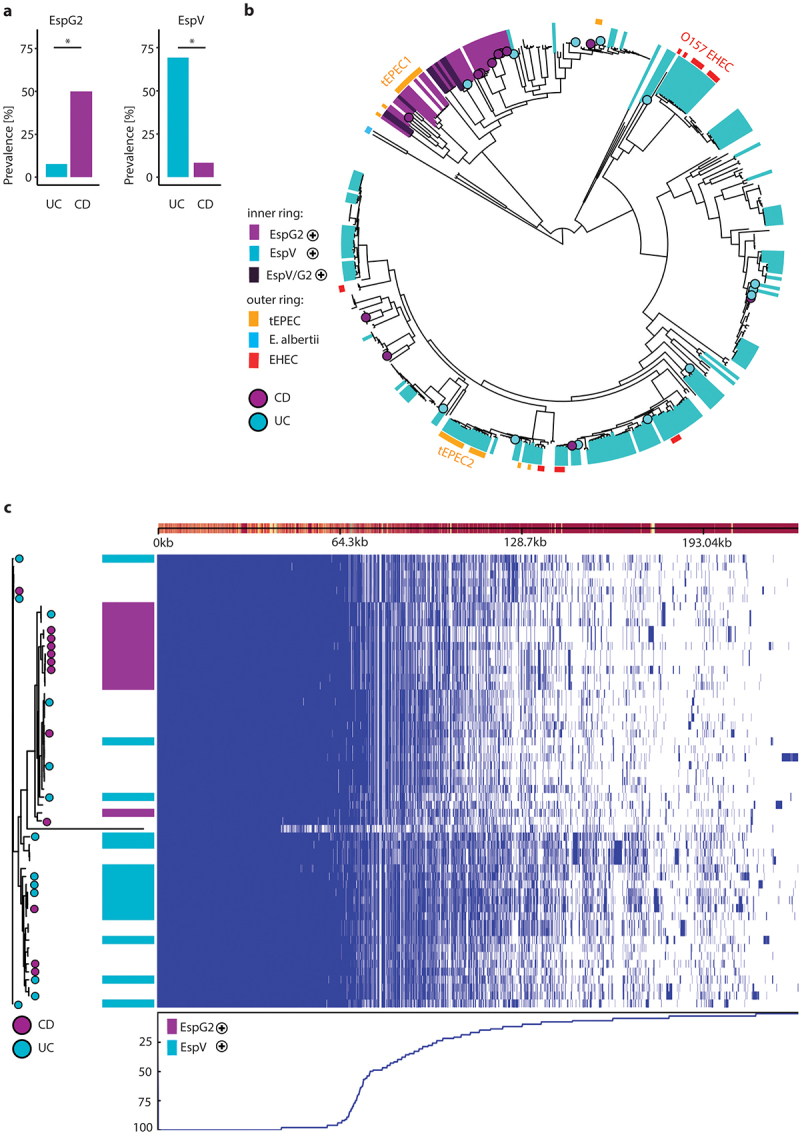
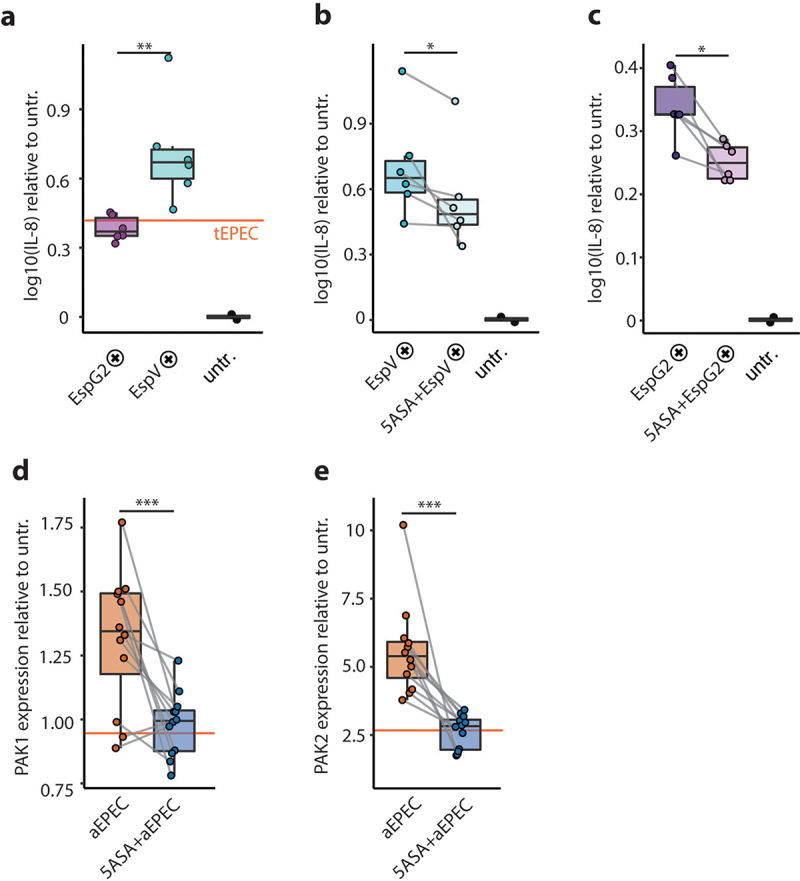
With increasing urbanization and industrialization, the prevalence of inflammatory bowel diseases (IBDs) has steadily been rising over the past two decades. IBD involves flares of gastrointestinal (GI) inflammation accompanied by microbiota perturbations. However, microbial mechanisms that trigger such flares remain elusive. Here, we analyzed the association of the emerging pathogen atypical enteropathogenic E. coli (aEPEC) with IBD disease activity. The presence of diarrheagenic E. coli was assessed in stool samples from 630 IBD patients and 234 age- and sex-matched controls without GI symptoms. Microbiota was analyzed with 16S ribosomal RNA gene amplicon sequencing, and 57 clinical aEPEC isolates were subjected to whole-genome sequencing and in vitro pathogenicity experiments including biofilm formation, epithelial barrier function and the ability to induce pro-inflammatory signaling. The presence of aEPEC correlated with laboratory, clinical and endoscopic disease activity in ulcerative colitis (UC), as well as microbiota dysbiosis. In vitro, aEPEC strains induce epithelial p21-activated kinases, disrupt the epithelial barrier and display potent biofilm formation. The effector proteins espV and espG2 distinguish aEPEC cultured from UC and Crohn's disease patients, respectively. EspV-positive aEPEC harbor more virulence factors and have a higher pro-inflammatory potential, which is counteracted by 5-ASA. aEPEC may tip a fragile immune-microbiota homeostasis and thereby contribute to flares in UC. aEPEC isolates from UC patients display properties to disrupt the epithelial barrier and to induce pro-inflammatory signaling in vitro.

Keywords: 5-ASA; Crohn's disease (CD); Escherichia coli (E. coli); Ulcerative colitis (UC); bacterial–epithelial interaction; effector proteins; enteropathogenic E. coli (EPEC); inflammatory bowel disease (IBD); microbiome; p21-activated kinase (PAK); virulence factors.


Conflict of interest statement

There is no competing interest.

Figures

Figure 1.
Figure 1.
aEPEC is more prevalent in UC patients with active disease. (a) Prevalence of aEPEC, tEPEC and EHEC in CD- (purple), UC-patients (blue) and age and sex matched controls without GI-symptoms (gray). (b) Prevalence of aEPEC, tEPEC and EHEC in CD with fecal calprotectin below (light purple) and above 200 mg/kg (dark purple). (c) Fecal calprotectin in aEPEC-neg (blue) and aEPEC-pos (Orange) CD patients. (d) Prevalence of aEPEC, tEPEC and EHEC in UC with fecal calprotectin below (light blue) and above 200 mg/kg (blue). (e) Fecal calprotectin in aEPEC-neg (blue) and aEPEC-pos (Orange) UC patients. Statistical analysis: (a,b,c) Fisher’s exact text, (c,e) log10 transformed y-axis, Mann–Whitney U test, n = 356 CD, 274 UC and 234 controls; *p ≤ .05; **p ≤ .01.
Figure 2.
Figure 2.
Longitudinal clinical parameters and microbiome analysis of aEPEC-pos UC patients. (a) Longitudinal fecal calprotectin in aEPEC-neg (blue) and aEPEC-pos (Orange) UC patients, samples from the same patient connected with gray lines. (b) Longitudinal fecal calprotectin in aEPEC-neg (blue) and aEPEC-pos (Orange) CD patients, samples from the same patient connected with gray lines. (c) Longitudinal trajectories of fecal calprotectin and serum c-reactive protein, with aEPEC-pos timepoints (Orange background) and aEPEC-neg timepoints (blue background). (d) UC patient’s stool bacterial diversity represented by Shannon index, aEPEC-neg (blue) and aEPEC-pos (Orange). (e) DESeq2 analysis at ASV level, aEPEC-pos vs. aEPEC-neg UC patients, Size represents fold-change, full dots represent up-regulation, empty dots down-regulation. Significant findings (p < .05 corrected for multiple comparisons) are shown. Statistical analysis: (a,b) Log10 transformed y-axis, ratio paired t test, n = 9 CD, 19 UC paired samples (d) Mann–Whitney U test, (d,e) n = 12 aEPEC-pos and 13 aEPEC-neg UC patients; *p ≤ .05.
Figure 3.
Figure 3.
aEPEC strains from UC elicit a more pro-inflammatory in vitro response than CD. (a) Trans epithelial resistance of Caco-2 monolayers infected with aEPEC strains isolated from UC patients (blue), CD patients (purple) and reference strain tEPEC-E2348/69 (Orange), with untreated cells (black). (b) Biofilm formation assay of aEPEC strains isolated from UC patients (blue) and CD patients (purple), tEPEC-E2348/69 (Orange), E. coli K-12 (green) aerobic conditions with LB medium (left), aerobic conditions with BHI medium (middle) and anaerobic conditions with BHI medium (right). (c) IL-8 secretion of human primary colon epithelial cells (HCEC-1CT) infected with aEPEC strains isolated from UC patients (blue) and CD patients (purple), tEPEC-E2348/69 (Orange), E. coli K-12 (green) normalized to untreated cells (black). Statistical analysis: (a,b) n = 11 CD, 12 UC, (c) n = 12 CD, 13 UC, (a) two-way ANOVA with Tukey’s multiple comparisons test, (b,c) Mann–Whitney U test; *p ≤ .05;**p ≤ .01; ***p ≤ .001.
Figure 4.
Figure 4.
Phylogeny of AEEC and characterization of EspG2 and EspV-carrying aEPEC. (a) Prevalence of non-LEE effectors EspG2 (left) and EspV (right) in aEPEC isolates from UC- (blue) and CD-patients (purple). (b) Midpoint rooted tree constructed with 405 AEEC genomes. Strains isolated from UC- (blue circle) and CD-patients (purple circle) labeled at the tip. Inner ring depicts the presence of EspG2 (purple), EspV (blue) or both (dark purple) in the genomes. Outer ring depicts pathotype; tEPEC (Orange), E. albertii (light blue) and EHEC (red). (c) Pangenome of 57 AEEC investigated in this study, tree from alignment of 2719 orthologous proteins (left) with strains isolated from UC- (blue circle) and CD-patients (purple circle) labeled at the tip. Column depicts the presence of EspG2 (purple), EspV (blue), genome presence absence matrix (right) blue line below shows the percentage of isolates carrying a gene at each position and linearized (pan)genome, with genes displayed as rectangles above. Statistical analysis: (a) Fisher’s exact text; *p ≤ .05.
Figure 5.
Figure 5.
5-ASA dampens the aEPEC-induced pro-inflammatory epithelial response. (a) IL-8 secretion of human primary colon epithelial cells (HCEC-1CT) infected with EspG2- (purple) and EspV-positive (blue) aEPEC strains, normalized to untreated cells (black). (b) IL-8 secretion of primary colon epithelial cells infected with EspV-positive AEEC strains, without (blue) and with 5-ASA (light blue), normalized to untreated cells. (c) IL-8 secretion of primary colon epithelial cells infected with EspG2-positive AEEC strains, without (purple) and with 5-ASA (light purple), normalized to untreated cells. (d) PAK1 expression of primary colon epithelial cells infected with aEPEC, relative to untreated cells with (blue) and without (Orange) 5-ASA, tEPEC (Orange line). (e) PAK2 expression of primary colon epithelial cells infected with aEPEC, relative to untreated cells with (blue) and without (Orange) 5-ASA. (a-e) Values for the reference strain tEPEC-E2348/69 are visualized with an Orange line. (a-e) Data Points from the same strains are connected with a gray line. Statistical analysis: (a) unpaired t-test, (b-e) paired t-test, (a-c) Log10 transformed y-axis; *p ≤ .05, **p ≤ .01, ***p ≤ .001.

References

    1. Graham DB, Xavier RJ.. Pathway paradigms revealed from the genetics of inflammatory bowel disease. Nature. 2020;578:527–17. doi:10.1038/s41586-020-2025-2. - DOI - PMC - PubMed
    1. Smillie CS, Biton M, Ordovas-Montanes J, Sullivan KM, Burgin G, Graham DB, Herbst RH, Rogel N, Slyper M, Waldman J, et al. Intra- and inter-cellular rewiring of the human colon during ulcerative colitis. Cell. 2019;178:714–730.e22. doi:10.1016/j.cell.2019.06.029. - DOI - PMC - PubMed
    1. Evstatiev R, Cervenka A, Austerlitz T, Deim G, Baumgartner M, Beer A, Krnjic A, Gmainer C, Lang M, Frick A, et al. The food additive EDTA aggravates colitis and colon carcinogenesis in mouse models. Sci Rep. 2021;11:5188. doi:10.1038/s41598-021-84571-5. - DOI - PMC - PubMed
    1. Ruiz PA, Morón B, Becker HM, Lang S, Atrott K, Spalinger MR, Scharl M, Wojtal KA, Fischbeck-Terhalle A, Frey-Wagner I, et al. Titanium dioxide nanoparticles exacerbate DSS-induced colitis: role of the NLRP3 inflammasome. Gut. 2017;66:1216–1224. doi:10.1136/gutjnl-2015-310297. - DOI - PMC - PubMed
    1. Baumgart DC, Carding SR. Inflammatory bowel disease: cause and immunobiology. Lancet. 2007;369:1627–1640. doi:10.1016/S0140-6736(07)60750-8. - DOI - PubMed

Publication types

MeSH terms