

This is a preprint.
Estimating the impact of COVID-19 vaccine allocation inequities: a modeling study
- PMID: 36415459
- PMCID: PMC9681050
- DOI: 10.1101/2022.11.18.22282514
Estimating the impact of COVID-19 vaccine allocation inequities: a modeling study
Update in
-
Estimating the impact of COVID-19 vaccine inequities: a modeling study.Nat Commun. 2023 Jun 6;14(1):3272. doi: 10.1038/s41467-023-39098-w. Nat Commun. 2023. PMID: 37277329 Free PMC article.
Abstract
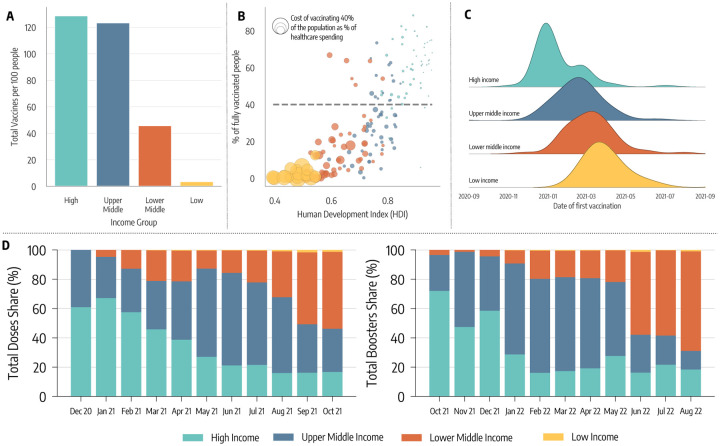
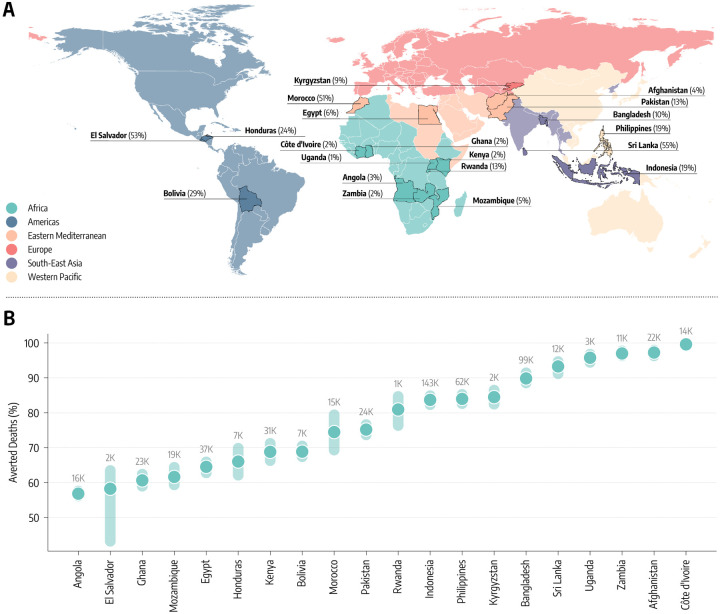
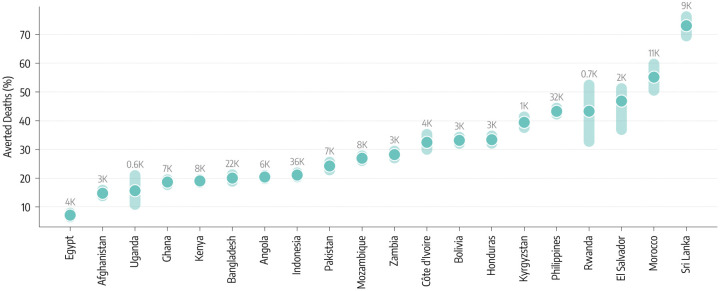
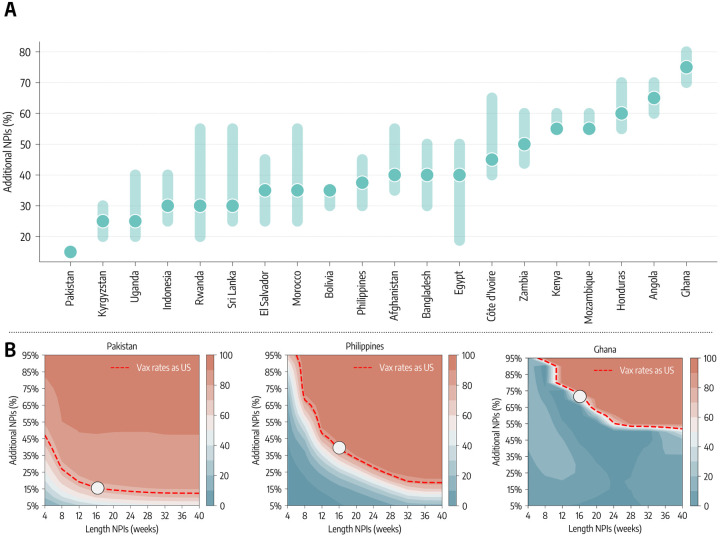
Access to COVID-19 vaccines on the global scale has been drastically impacted by structural socio-economic inequities. Here, we develop a data-driven, age-stratified epidemic model to evaluate the effects of COVID-19 vaccine inequities in twenty lower middle and low income countries (LMIC) sampled from all WHO regions. We focus on the first critical months of vaccine distribution and administration, exploring counterfactual scenarios where we assume the same per capita daily vaccination rate reported in selected high income countries. We estimate that, in this high vaccine availability scenario, more than 50% of deaths (min-max range: [56% - 99%]) that occurred in the analyzed countries could have been averted. We further consider a scenario where LMIC had similarly early access to vaccine doses as high income countries; even without increasing the number of doses, we estimate an important fraction of deaths (min-max range: [7% - 73%]) could have been averted. In the absence of equitable allocation, the model suggests that considerable additional non-pharmaceutical interventions would have been required to offset the lack of vaccines (min-max range: [15% - 75%]). Overall, our results quantify the negative impacts of vaccines inequities and call for amplified global efforts to provide better access to vaccine programs in low and lower middle income countries.
Figures
References
-
- Pullano Giulia, Valdano Eugenio, Scarpa Nicola, Rubrichi Stefania, and Colizza Vittoria. Evaluating the effect of demographic factors, socioeconomic factors, and risk aversion on mobility during the covid-19 epidemic in france under lockdown: a population-based study. The Lancet Digital Health, 2(12):e638–e649, 2020. - PMC - PubMed
-
- Bonaccorsi Giovanni, Pierri Francesco, Cinelli Matteo, Flori Andrea, Galeazzi Alessandro, Porcelli Francesco, Schmidt Ana Lucia, Valensise Carlo Michele, Scala Antonio, Quattrociocchi Walter, and Pammolli Fabio. Economic and social consequences of human mobility restrictions under covid-19. Proc Natl Acad Sci USA, 117(27):15530–15535, jun 2020. - PMC - PubMed
-
- Fraiberger Samuel P, Astudillo Pablo, Candeago Lorenzo, Chunet Alex, Jones Nicholas KW, Khan Maham Faisal, Lepri Bruno, Gracia Nancy Lozano, Lucchini Lorenzo, Massaro Emanuele, et al. Uncovering socioeconomic gaps in mobility reduction during the covid-19 pandemic using location data. arXiv preprint arXiv:2006.15195, 2020.
Publication types
LinkOut - more resources
Full Text Sources
Miscellaneous