[Preprint]. 2023 Feb 15:2022.04.06.487380.
doi: 10.1101/2022.04.06.487380.

Probing different paradigms of morphine withdrawal on sleep behavior in male and female C57BL/6J mice

Affiliations

Probing different paradigms of morphine withdrawal on sleep behavior in male and female C57BL/6J mice

Madigan L Bedard et al. bioRxiv. .

Update in

Abstract

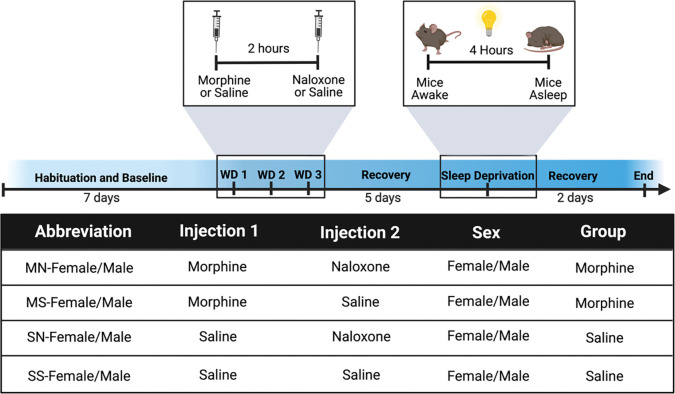
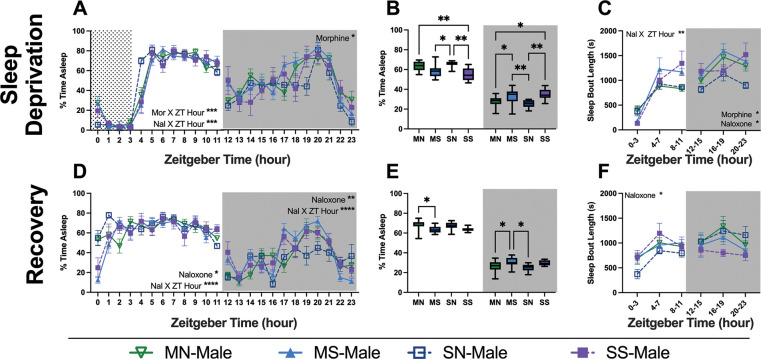
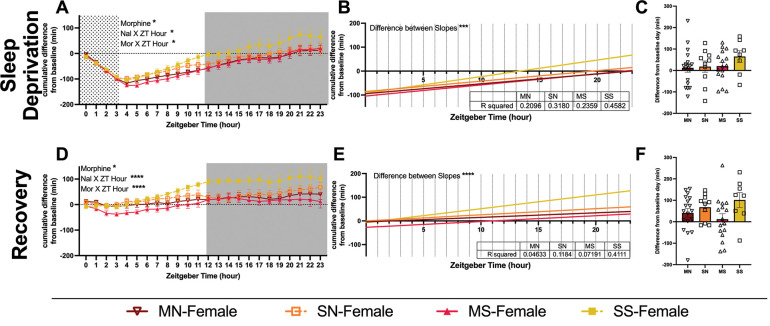
Opioid misuse has dramatically increased over the last few decades resulting in many people suffering from opioid use disorder (OUD). The prevalence of opioid overdose has been driven by the development of new synthetic opioids, increased availability of prescription opioids, and more recently, the COVID-19 pandemic. Coinciding with increases in exposure to opioids, the United States has also observed increases in multiple Narcan (naloxone) administrations as life-saving measures for respiratory depression, and, thus, consequently, naloxone-precipitated withdrawal. Sleep dysregulation is a main symptom of OUD and opioid withdrawal syndrome, and therefore, should be a key facet of animal models of OUD. Here we examine the effect of precipitated and spontaneous morphine withdrawal on sleep behaviors in C57BL/6J mice. We find that morphine administration and withdrawal dysregulate sleep, but not equally across morphine exposure paradigms. Furthermore, many environmental triggers promote relapse to drug-seeking/taking behavior, and the stress of disrupted sleep may fall into that category. We find that sleep deprivation dysregulates sleep in mice that had previous opioid withdrawal experience. Our data suggest that the 3-day precipitated withdrawal paradigm has the most profound effects on opioid-induced sleep dysregulation and further validates the construct of this model for opioid dependence and OUD.

Highlights: Morphine withdrawal differentially dysregulates the sleep of male and female mice3-day precipitated withdrawal results in larger changes than spontaneous withdrawalOpioid withdrawal affects responses to future sleep deprivation differently between sexes.


Conflict of interest statement

Declaration of Conflicting Interests: The authors M. Bedard and Dr. McElligott are sub-contracted by EpiCypher® on a SBIR grant unrelated to the work completed in this article.

Figures

Figure 1.
Figure 1.. Precipitated-withdrawal paradigm in PiezoSleep chambers.
Experimental timeline including habituation, baseline, morphine exposure and withdrawal, observation, and sleep deprivation. Table detailing the eight different treatment groups (four per sex).
Figure 2.
Figure 2.. Sex differences in baseline sleep behaviors of C57BL/6J mice.
Average of all baseline days shown as percent time spent sleeping of each hour in a 24-hour period, shown as Zeitgeber Time (ZT). ZT0 is the start of the light cycle and ZT12 is the start of the dark cycle. Hours 0–11 and 12–23 were analyzed separately (A). Percent time spent sleeping in a 12-hour period of all baseline days (light or dark) and across all 24-hours of all baseline days (B). Mean length (seconds) of sleep bouts in 4-hour bins across baseline days (C).
Figure 3.
Figure 3.. Sleep behavior of male mice during morphine exposure and withdrawal.
Graphs depict either 24-hour sleep trace with percent sleep per hour, percent sleep per light cycle, or average sleep bout length in four-hour bins. Each row is a different day (withdrawal days 1–3 and then recovery day 1). Red arrows indicate morphine or saline injections (injection #1) and black arrows indicate saline or naloxone injections (injection #2). Statistical details can be found in Supplemental Tables 1 and 2. Each point or bar represents the mean ± standard error of the mean (SEM): *P < 0.05, **P < 0.01, ***P < 0.001, ****P < 0.0001. Abbreviations: Morphine-Naloxone (MN), Morphine-Saline (MS), Saline-Naloxone (SN), and Saline-Saline (SS).
Figure 4.
Figure 4.. Sleep behavior of female mice during morphine exposure and withdrawal.
Graphs depict either 24-hour sleep trace with percent sleep per hour, percent sleep per light cycle, or average sleep bout length in four-hour bins. Each row is a different day (withdrawal days 1–3 and then recovery day 1). Red arrows indicate morphine or saline injections (injection #1) and black arrows indicate saline or naloxone injections (injection #2). Statistical details can be found in Supplemental Tables 2 and 3. Each point or bar represents the mean ± standard error of the mean (SEM): *P < 0.05, **P < 0.01, ***P < 0.001, ****P < 0.0001. Abbreviations: Morphine-Naloxone (MN), Morphine-Saline (MS), Saline-Naloxone (SN), and Saline-Saline (SS).
Figure 5.
Figure 5.. Cumulative difference in minutes of sleep of male mice during morphine exposure and withdrawal.
Minutes of sleep compared to each animal’s baseline sleep (within subjects). (A,D, G, and J) Graphs show minutes of sleep subtracted from baseline minutes, cumulative by hour. Red arrows indicate morphine or saline injections (injection #1) and black arrows indicate saline or naloxone injections (injection #2). Each row is a different day (withdrawal days 1–3 and then recovery day 1). Grey shading shows the dark cycle. Data above 0 indicate a mouse had slept more by that point in the day than they did by that same hour during their baseline. (B, E, H, and K) Graphs show linear regression of within-animal graphs. R-squared values are reported in the inset tables. (C, F, I, and L) Graphs show the final difference in minutes slept over 24 hours compared to baseline. Statistical details can be found in Supplemental Table 4. Each point represents the mean ± standard error of the mean (SEM): *P < 0.05, **P < 0.01, ***P < 0.001, ****P < 0.0001. Abbreviations: Morphine-Naloxone (MN), Morphine-Saline (MS), Saline-Naloxone (SN), and Saline-Saline (SS).
Figure 6.
Figure 6.. Cumulative difference in minutes of sleep of female mice during morphine exposure and withdrawal.
Minutes of sleep compared to each animal’s baseline sleep (within subjects). (A,D, G, and J) Graphs show minutes of sleep subtracted from baseline minutes, cumulative by hour. Red arrows indicate morphine or saline injections (injection #1) and black arrows indicate saline or naloxone injections (injection #2). Each row is a different day (withdrawal days 1–3 and then recovery day 1). Grey shading shows the dark cycle. Data above 0 indicate a mouse had slept more by that point in the day than they did by that same hour during their baseline. (B, E, H, and K) Graphs show linear regression of within-animal graphs. R-squared values are reported in the inset tables. (C, F, I, and L) Graphs show the final difference in minutes slept over 24 hours compared to baseline. Statistical details can be found in Supplemental Table 5. Each point represents the mean ± standard error of the mean (SEM): *P < 0.05, **P < 0.01, ***P < 0.001, ****P < 0.0001. Abbreviations: Morphine-Naloxone (MN), Morphine-Saline (MS), Saline-Naloxone (SN), and Saline-Saline (SS).
Figure 7.
Figure 7.. Sleep behavior of male mice during sleep deprivation and recovery.
Sleep percentage of male mice undergoing sleep deprivation for 4 hours (A-C) and the day immediately following (D-L). Graphs are either 24-hour sleep percentages (A, D), sleep percentages by light cycle (B, E), or sleep bout length in 4-hour bins (C,F). Grey box shows lights off and dotted region shows sleep disruption period. Statistical details can be found in Supplemental Table 6. Each point or bar represents the mean ± standard error of the mean (SEM): *P < 0.05, **P < 0.01, ***P < 0.001, ****P < 0.0001. Abbreviations: Morphine-Naloxone (MN), Morphine-Saline (MS), Saline-Naloxone (SN), and Saline-Saline (SS).
Figure 8.
Figure 8.. Sleep behavior of female mice during sleep deprivation and recovery.
Sleep percentage of male mice undergoing sleep deprivation for 4 hours (A-C) and the day immediately following (D-L). Graphs are either 24-hour sleep percentages (A, D), sleep percentages by light cycle (B, E), or sleep bout length in 4-hour bins (C,F). Grey box shows lights off and dotted region shows sleep disruption period. Statistical details can be found in Supplemental Table 7. Each point or bar represents the mean ± standard error of the mean (SEM): *P < 0.05, **P < 0.01, ***P < 0.001, ****P < 0.0001. Abbreviations: Morphine-Naloxone (MN), Morphine-Saline (MS), Saline-Naloxone (SN), and Saline-Saline (SS).
Figure 9.
Figure 9.. Cumulative difference in minutes of sleep of male mice during sleep disruption and recovery.
Minutes of sleep compared to each animal’s baseline sleep (within subjects). (A, D) Graphs show minutes of sleep subtracted from baseline minutes, cumulative by hour. Each row is a different day (sleep deprivation and recovery day). Grey shading shows the dark cycle. Data above 0 indicate a mouse had slept more by that point in the day than they did by that same hour during their baseline. (B, E) Graphs show linear regression of within-animal graphs. R-squared values are reported in the inset tables. (C, F) Graphs show the final difference in minutes slept over 24 hours compared to baseline. Statistical details can be found in Supplemental Table 8. Each point represents the mean ± standard error of the mean (SEM): *P < 0.05, **P < 0.01, ***P < 0.001, ****P < 0.0001. Abbreviations: Morphine-Naloxone (MN), Morphine-Saline (MS), Saline-Naloxone (SN), and Saline-Saline (SS).
Figure 10.
Figure 10.. Cumulative difference in minutes of sleep of female mice during sleep deprivation and recovery.
Minutes of sleep compared to each animal’s baseline sleep (within subjects). (A, D) Graphs show minutes of sleep subtracted from baseline minutes, cumulative by hour. Each row is a different day (sleep deprivation and recovery day). Grey shading shows the dark cycle. Data above 0 indicate a mouse had slept more by that point in the day than they did by that same hour during their baseline. (B, E) Graphs show linear regression of within-animal graphs. R-squared values are reported in the inset tables. (C, F) Graphs show the final difference in minutes slept over 24 hours compared to baseline. Statistical details can be found in Supplemental Table 8. Each point represents the mean ± standard error of the mean (SEM): *P < 0.05, **P < 0.01, ***P < 0.001, ****P < 0.0001. Abbreviations: Morphine-Naloxone (MN), Morphine-Saline (MS), Saline-Naloxone (SN), and Saline-Saline (SS).

References

    1. CDC, Provisional Drug Overdose Death Counts, 2021.
    1. Han B., Compton W.M., Blanco C., Crane E., Lee J., Jones C.M., Ann Intern Med 167 (2017) 293–301. - PubMed
    1. Strang J., Volkow N.D., Degenhardt L., Hickman M., Johnson K., Koob G.F., Marshall B.D.L., Tyndall M., Walsh S.L., Nat Rev Dis Primers 6 (2020) 3. - PubMed
    1. Adapt Pharma, NARCAN (Naloxone Hydrochloride) Nasal Spray, n.d.
    1. Bravo I.M., Luster B.R., Flanigan M.E., Perez P.J., Cogan E.S., Schmidt K.T., McElligott Z.A., Eur J Neurosci 51 (2020) 742–754. - PMC - PubMed

Publication types