. 2023;33(1):97-148.
doi: 10.1007/s00191-022-00793-4. Epub 2022 Nov 17.

Vanishing social classes? Facts and figures of the Italian labour market

Affiliations

Vanishing social classes? Facts and figures of the Italian labour market

A Cetrulo et al. J Evol Econ. 2023.

Abstract

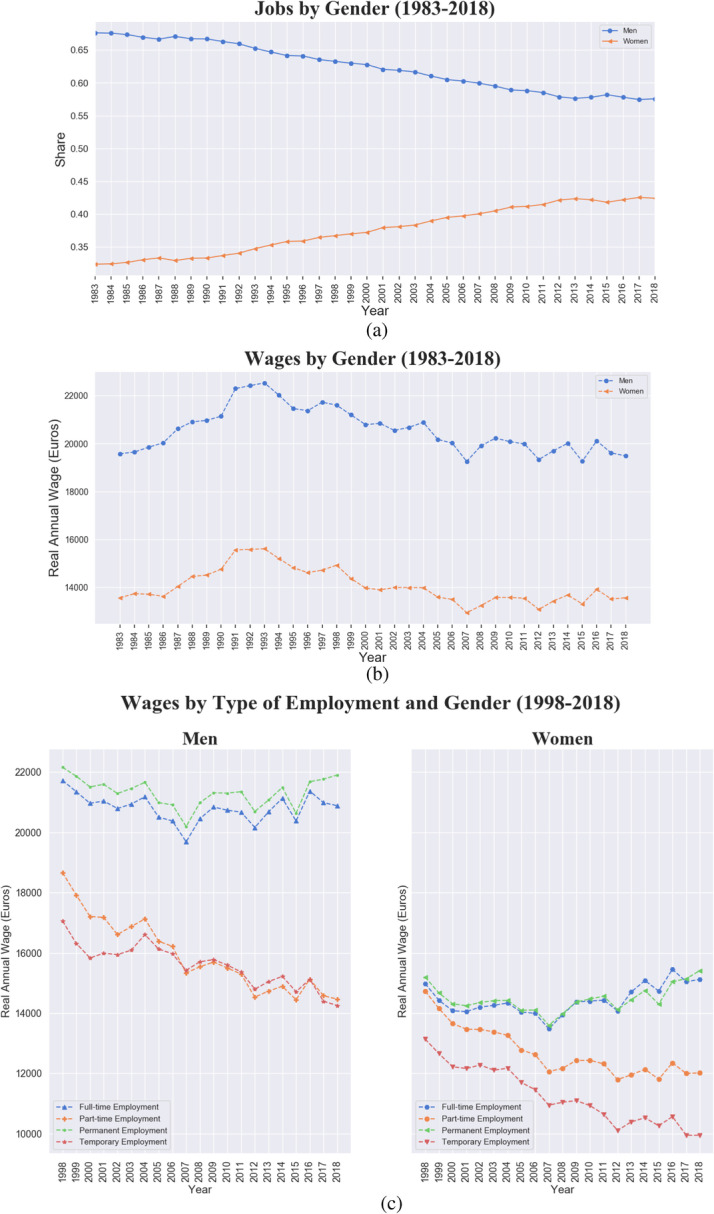
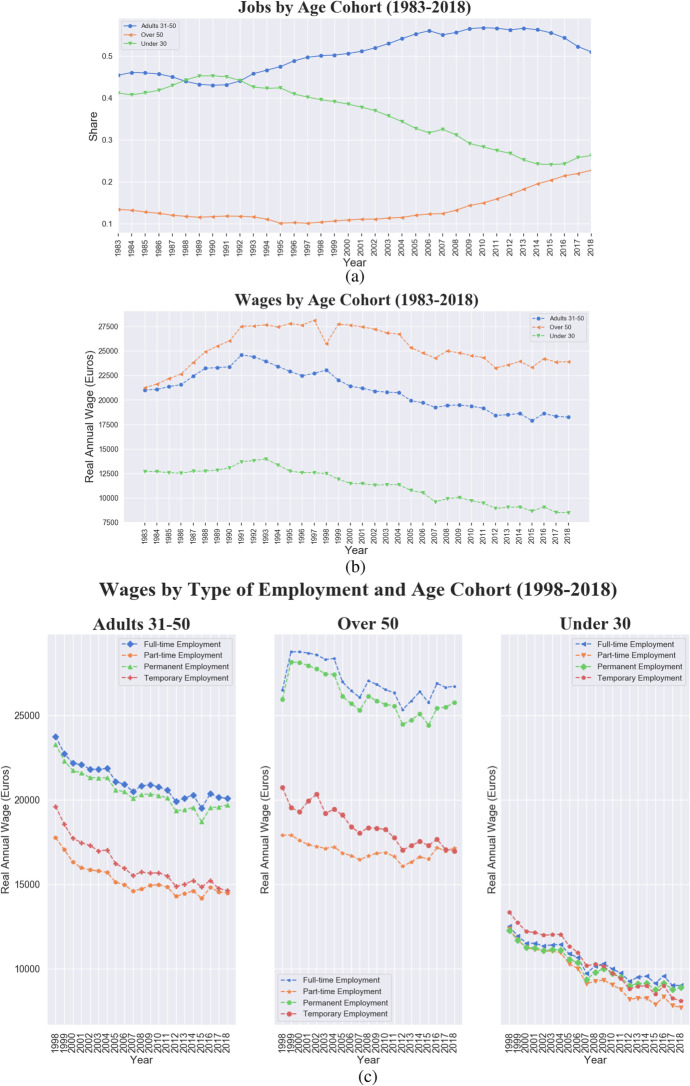
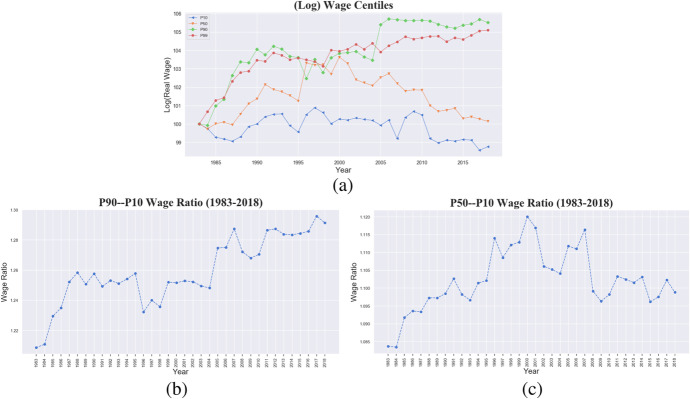
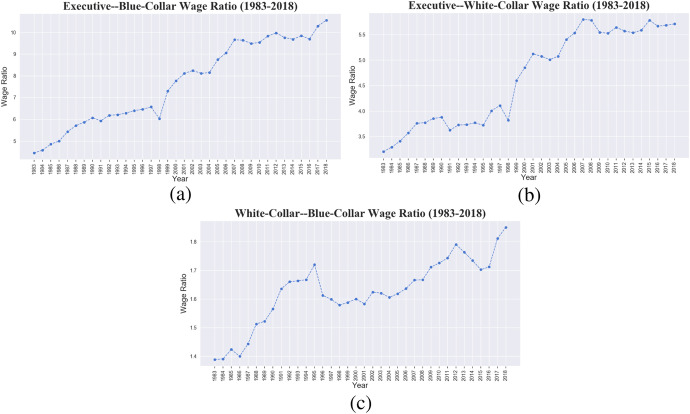
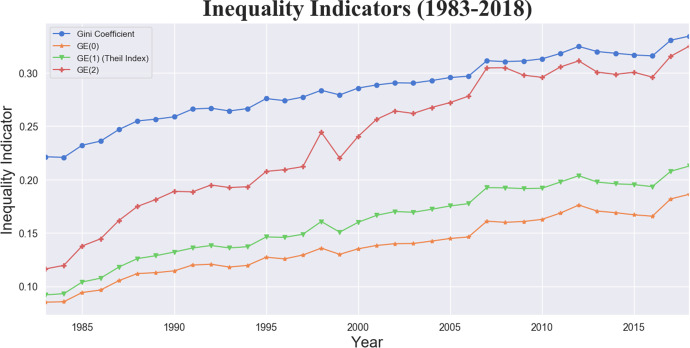
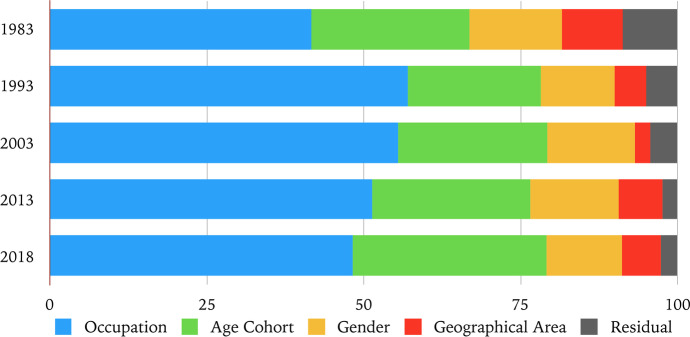
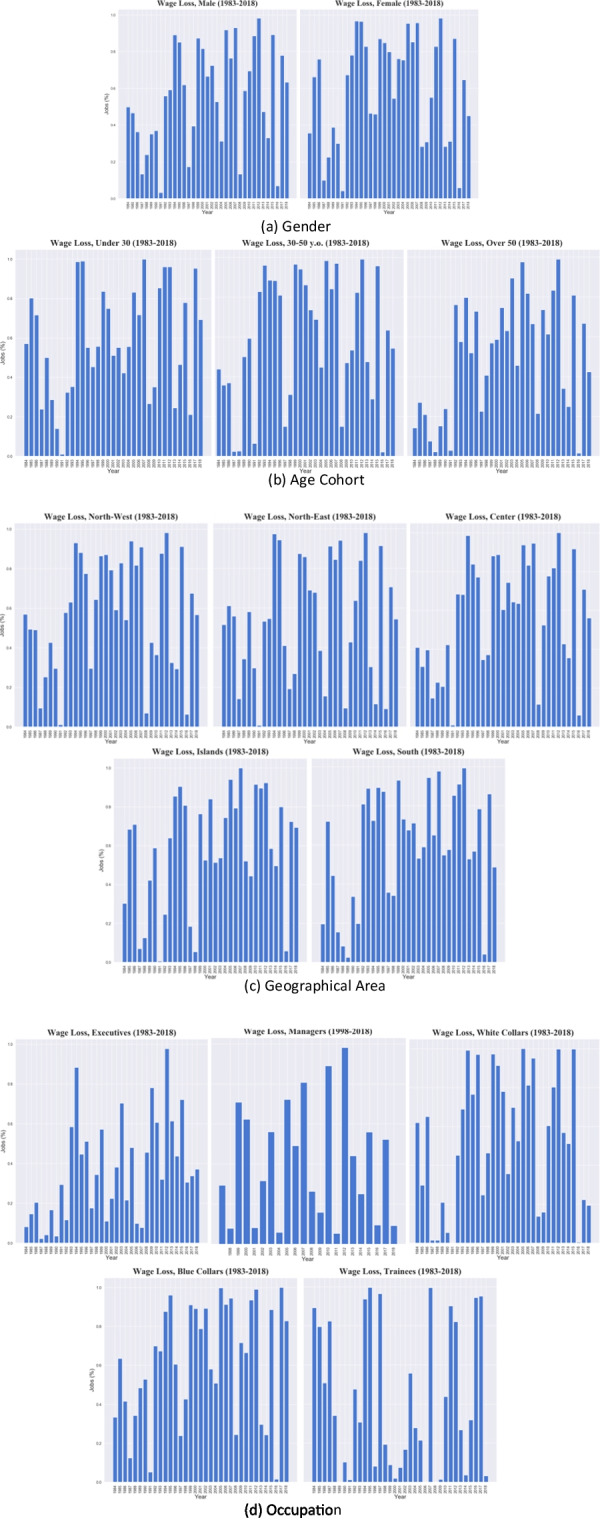
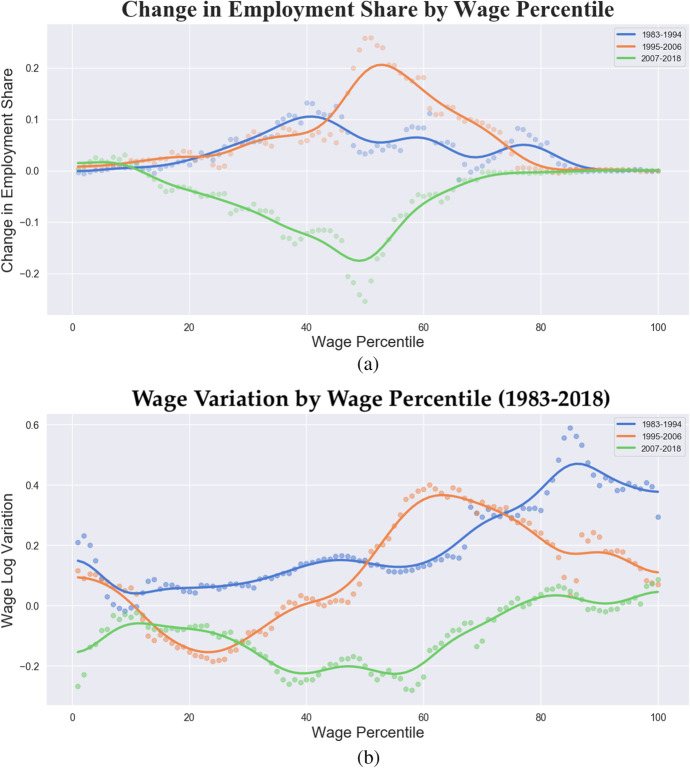
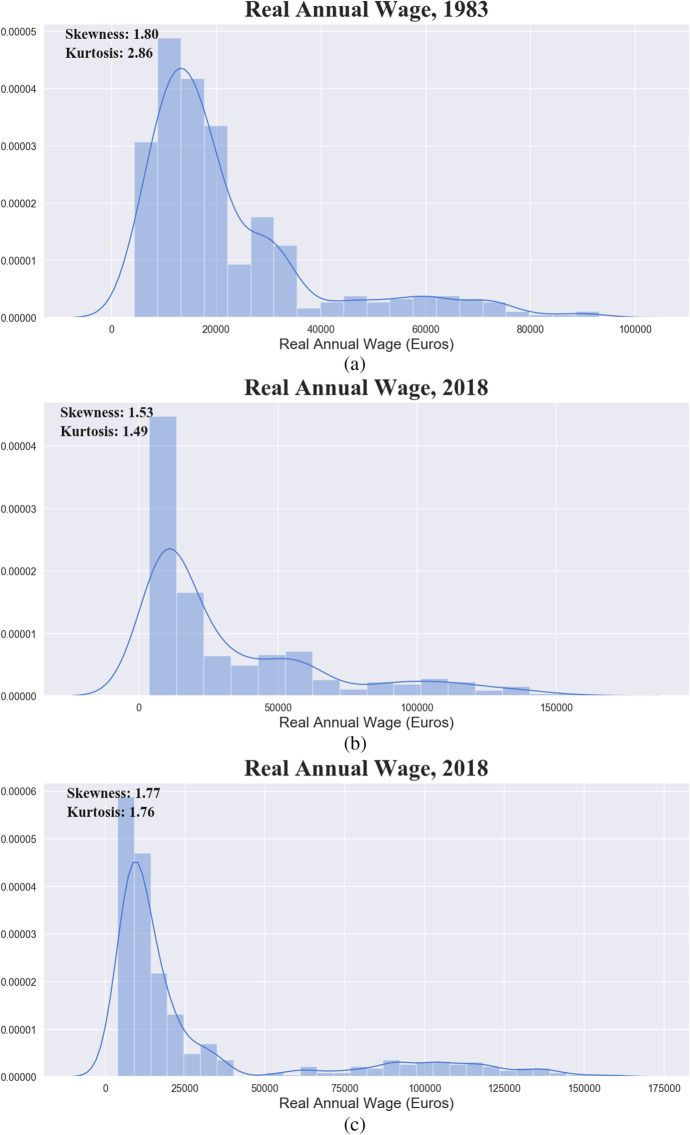
This paper analyses medium-term labour market trends from 1983 to 2018 in Italy relying on the "Rilevazione dei contratti di lavoro" from INPS archive which provides information on average salaries by professional category, age, gender, and geographical origin. Within an overall pattern of exacerbated wage inequalities, documented by means of different indicators, the empirical analysis highlights how the within-component of the wage variation prevails in the gender, age and geographical dimensions. By contrast, the between-component in terms of professional categories (trainees, blue-collar jobs, white-collar jobs, middle managers, executives) is the only between-variation attribute to prevail, corroborating the role played by a reduced class schema, excluding capitalists and the self-employed, in explaining wage inequality. Regression-based inequality estimations confirm the role played by managerial remuneration, the contradictory located class, in driving divergent patterns. Stratification of wage losses is recorded to be largely concentrated among blue-collar professional categories, women, youth, and in Southern regions.

Keywords: Inequality; Occupations; Wages.


Conflict of interest statement

Ethical conductThe authors have no conflicts of interest to declare.

Figures

Fig. 1
Fig. 1
Ratio between number of first jobs and total number of jobs. Italy, 1983–2018
Fig. 2
Fig. 2
Italy, 1983–2018, wage compression trend. a Real average wage (annual in blue, weekly in orange). b Real average wage 5-year percentage change (annual in blue, weekly in orange). c FOI, price index used to compute real wages
Fig. 3
Fig. 3
Italy, 1983–2018. Precarisation, fragmentation and deindustrialisation trends. a Average number of weeks of work in a year. b Number of jobs. c Share of jobs by different aggregations of 1-digit Ateco industrial sectors (Mining and Quarrying; Manufacturing; Metallurgy + Chemical and Pharmaceutical industries; Energy, Water Supply, Sewerage and Machinery; Construction + Wholesale and Retail Trade; Transport; Information and Communication + Financial and Insurance Activities; Professional Services; Education + Human Health Activities; Other Services)
Fig. 4
Fig. 4
Italy, 1983–2018, geographical divergence trend. a Share of jobs by geographical area. b Real average wage by geographical macro-area (South, Islands, Center, North-East, North-West). c Real average wage by geographical macro-area and type of employment
Fig. 5
Fig. 5
Italy, 1983–2018, feminization of the labour force and gender-pay gap. a Share of jobs by gender. b Real average wage by gender (Women in orange, Men in blue). c Real average wage by gender and type of employment
Fig. 6
Fig. 6
Italy, 1983–2018, ageing labour force trend. a Share of jobs by age cohort. b Real average wage by age cohort (Young under 30, Adults between 31 and 50, and Over 50). c Real average wage by age cohort and type of employment
Fig. 7
Fig. 7
Italy, 1983–2018. a Real average wage centiles over time. b P90-P10 and (c) P50-P10 wage ratios
Fig. 8
Fig. 8
Italy, 1983–2018. a Executive-Blue Collar wage ratio. b Executive-White Collar wage ratio. c White Collar-Blue Collar ratio
Fig. 9
Fig. 9
The Gini Coefficient and the selected general entropy indicators GE(α), α ∈ [0,1,2], trends over the period 1983–2018
Fig. 10
Fig. 10
Total factor inequality weights (%) for each variable
Fig. 11
Fig. 11
Wage loss events by population sub-groups
Fig. 12
Fig. 12
Italy, 1983–2018. a Employment polarization. The figure plots 10-year changes in employment shares by 1983 wage percentile rank (1983–1994 in blue, 1995–2006 in orange, 2007–2018 in green). b Wage polarization. Real average wage 10-year logarithmic change (1983–1994 in blue, 1995–2006 in orange, 2007–2018 in green)
Fig. 13
Fig. 13
Italy, 1983–2018. a Real gross average wage distribution, Gaussian Kernel Density Estimation (KDE) in 1983; b Real gross average wage distribution, Gaussian KDE in 2018; c Real gross average wage distribution excluding executives, Gaussian KDE in 2018

References

    1. Acciari P, Alvaredo F, Morelli S. Measuring and understanding the distribution and intra/inter-generational mobility of income and wealth. University of Chicago Press; 2020. The concentration of personal wealth in Italy 1995–2016.
    1. Acemoglu D. Technical change, inequality, and the labor market. J Econ Lit. 2002;40(1):7–72. doi: 10.1257/jel.40.1.7. - DOI
    1. Acemoglu D, Autor D. Handbook of labor economics. Elsevier; 2011. Skills, tasks and technologies: implications for employment and earnings; pp. 1043–1171.
    1. Albertini M. The relation between social class and economic inequality: a strengthening or weakening nexus? Evidence from the last three decades of inequality in Italy. Res Soc Stratif Mobil. 2013;33:27–39.
    1. Alvaredo F, Atkinson AB, Piketty T, Saez E. The top 1 percent in international and historical perspective. J Econ Perspect. 2013;27(3):3–20. doi: 10.1257/jep.27.3.3. - DOI

LinkOut - more resources