. 2022 Oct 25;4(6):fcac271.
doi: 10.1093/braincomms/fcac271. eCollection 2022.

Thirty novel sequence variants impacting human intracranial volume

Affiliations

Thirty novel sequence variants impacting human intracranial volume

Muhammad Sulaman Nawaz et al. Brain Commun. .

Abstract

Intracranial volume, measured through magnetic resonance imaging and/or estimated from head circumference, is heritable and correlates with cognitive traits and several neurological disorders. We performed a genome-wide association study meta-analysis of intracranial volume (n = 79 174) and found 64 associating sequence variants explaining 5.0% of its variance. We used coding variation, transcript and protein levels, to uncover 12 genes likely mediating the effect of these variants, including GLI3 and CDK6 that affect cranial synostosis and microcephaly, respectively. Intracranial volume correlates genetically with volumes of cortical and sub-cortical regions, cognition, learning, neonatal and neurological traits. Parkinson's disease cases have greater and attention deficit hyperactivity disorder cases smaller intracranial volume than controls. Our Mendelian randomization studies indicate that intracranial volume associated variants either increase the risk of Parkinson's disease and decrease the risk of attention deficit hyperactivity disorder and neuroticism or correlate closely with a confounder.

Keywords: Mendelian randomization; brain structure; genetic correlation; genome-wide association study; intracranial volume.


Figures

Graphical abstract
Graphical abstract
Figure 1
Figure 1
Workflow of the study. A GWAS meta-analysis of ICV by combining GWAS summary data from Iceland, UKB and ENIGMA + EGG (total n = 79 174) was performed. Our analysis identified 30 novel associations and confirmed 34 associations with ICV. For these 64 ICV associated variants, we performed cis-colocalization studies, studied their impact on cortical and sub-cortical regions (volumes), performed a PheWAS by looking up the variants and correlated variants up in the GWAS catalogue. Additionally, we studied the involvement of ICV associated genes in known pathways and gene-set terms. Finally, to understand the causal path of wide range of diseases, we used ICV associated variants (as instrumental variables) to study their impact on genetically correlated traits for Mendelian randomization analysis.
Figure 2
Figure 2
Manhattan-plot showing association results for ICV (n = 79 174) with 42.91 million sequence variants (SNPs, In-dels and SVs). Each dot represents the position of a tested marker for the association. The x-axis represents the chromosomal position of the tested marker (where 23 refers to chromosome X), and the y-axis represents the significance (−log10P) of the observed association. The horizontal dotted line represents P = 1.2 × 10⁻⁹ (0.05/42.9 × 106). Novel associations are highlighted with diamond shape, whereas bold filled dots represent associations of variants already reported in the scientific literature (Supplementary Table 1). The basic GWAS descriptive statistics calculated for ICV meta-analysis through LDSC, are h2 = 0.0626 (0.0044 SE), lambda GC = 1.2818, mean Chi2 = 1.4252 and intercept = 1.0397 (0.0136 SE).
Figure 3
Figure 3
Phenome-wide bivariate genetic correlation between ICV and 1483 published GWAS studies estimated through LDSC., Each dot is an estimate of genetic correlation (rg) between ICV GWAS meta-analysis and one of the tested GWAS traits (binned into phenotype categories), where the x-axis represents phenotype (category) and the y-axis shows its genetic correlation (rg). The significant associations (Pthreshold < 0.05/1483 = 3.37 × 10⁻⁵) are highlighted with diamond shape.
Figure 4
Figure 4
Causal association of instrumental variants from ICV on 34 tested traits. (A) neurological diseases/disorders, (B) personality/behaviour traits, (C) cognitive/learning/birth weight traits. The analysis was performed using a two-sample Mendelian randomization (MR) approach, the instrumental variables and their effect sizes are based on results for ICV variants versus their effects from largest available studies of the genetically correlated traits (Supplementary Table 8A). IVW (inverse variance weighted) method was used to estimate the causal effect, additionally Egger analysis was performed to detect whether IVW estimates are biased i.e. intercept is different from zero (Supplementary Table 8A). The Bonferroni significant associations (P < 0.05/34 = 1.47 × 10⁻³) are highlighted, ‘°’ refers to traits for which effect estimates were flipped for better representation (Supplementary Figs. 33–46, Supplementary Table 8A and 8B).
Figure 5
Figure 5
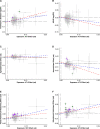
Effect versus effect plots of top associations from MR analysis. On x-axis are effect size for ICV and on y-axis (not always symmetric around zero) for; (A) Parkinson’s disease as log(odds ratio), (B) ADHD as log(odds ratio), (C) Agreeableness as beta in SD, (D) neuroticism as beta in SD, (E) verbal numerical reasoning as beta in SD and (F) educational attainment as beta in SD. All effects are plotted for alleles with increasing ICV. Blue line represents the estimated slope from IVW (inverse variance weighted regression), and red line is estimated from MR Egger analysis including the intercept. Green dots represent conventional GWAS associations (P < 5.0 × 10⁻⁸) for respective y-axis trait, while purple dots are Bonferroni significant associations (P < 0.05/64 = 7.8 × 10⁻⁴) for respective the y-axis trait. See Supplementary Figs. 33–46 for individual trait plots.

References

    1. van Der Lee SJ, Knol MJ, Chauhan G, et al. . A genome-wide association study identifies genetic loci associated with specific lobar brain volumes. Commun Biol. 2019;2(1):285. - PMC - PubMed
    1. Smit DJ, Luciano M, Bartels M, et al. . Heritability of head size in Dutch and Australian twin families at ages 0–50 years. Twin Res Hum Genet. 2010;13(4):370–380. - PubMed
    1. Haworth S, Shapland CY, Hayward C, et al. . Low-frequency variation in TP53 has large effects on head circumference and intracranial volume. Nat Commun. 2019;10(1):357. - PMC - PubMed
    1. Hshieh TT, Fox ML, Kosar CM, et al. . Head circumference as a useful surrogate for intracranial volume in older adults. Int Psychogeriatr. 2016;28(1):157–162. - PMC - PubMed
    1. Stefansson H, Meyer-Lindenberg A, Steinberg S, et al. . CNVs conferring risk of autism or schizophrenia affect cognition in controls. Nature. 2014;505(7483):361–366. - PubMed

LinkOut - more resources