

Interspecific variation in resistance and tolerance to herbicide drift reveals potential consequences for plant community co-flowering interactions and structure at the agro-eco interface
- PMID: 36415945
- PMCID: PMC9851304
- DOI: 10.1093/aob/mcac137
Interspecific variation in resistance and tolerance to herbicide drift reveals potential consequences for plant community co-flowering interactions and structure at the agro-eco interface
Abstract
Background and aims: When plant communities are exposed to herbicide 'drift', wherein particles containing the active ingredient travel off-target, interspecific variation in resistance or tolerance may scale up to affect community dynamics. In turn, these alterations could threaten the diversity and stability of agro-ecosystems. We investigated the effects of herbicide drift on the growth and reproduction of 25 wild plant species to make predictions about the consequences of drift exposure on plant-plant interactions and the broader ecological community.
Methods: We exposed potted plants from species that commonly occur in agricultural areas to a drift-level dose of the widely used herbicide dicamba or a control solution in the glasshouse. We evaluated species-level variation in resistance and tolerance for vegetative and floral traits. We assessed community-level impacts of drift by comparing the species evenness and flowering networks of glasshouse synthetic communities comprised of drift-exposed and control plants.
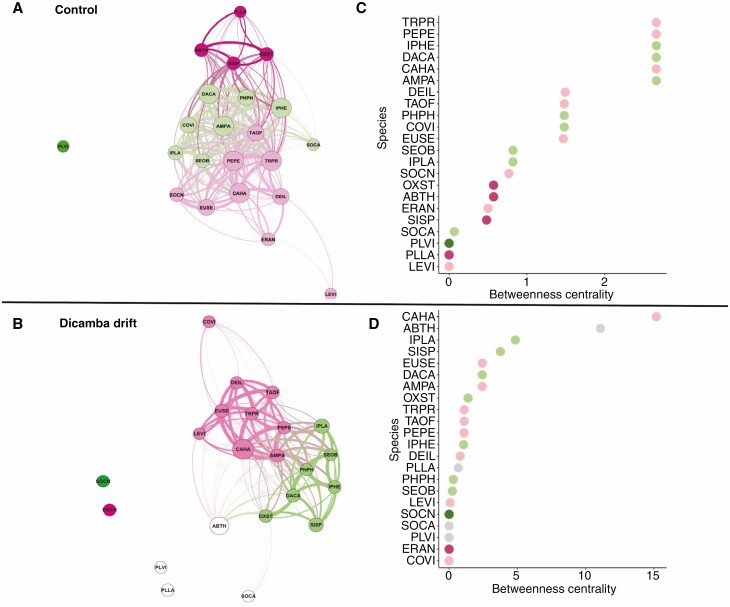
Key results: Species varied significantly in resistance and tolerance to dicamba drift: some were negatively impacted while others showed overcompensatory responses. Species also differed in the way they deployed flowers over time following drift exposure. While drift had negligible effects on community evenness based on vegetative biomass, it caused salient differences in the structure of co-flowering networks within communities. Drift reduced the degree and intensity of flowering overlap among species, altered the composition of groups of species that were more likely to co-flower with each other than with others and shifted species roles (e.g. from dominant to inferior floral producers, and vice versa).
Conclusions: These results demonstrate that even low levels of herbicide exposure can significantly alter plant growth and reproduction, particularly flowering phenology. If field-grown plants respond similarly, then these changes would probably impact plant-plant competitive dynamics and potentially plant-pollinator interactions occurring within plant communities at the agro-ecological interface.
Keywords: Co-flowering; agro-eco interface; anthropogenic stress; community; dicamba; dicamba drift; drift; flowering time; herbicide; herbicide drift; interspecific variation; network; pesticide; phenology; resistance; tolerance; weeds; wild flowers.
© The Author(s) 2022. Published by Oxford University Press on behalf of the Annals of Botany Company. All rights reserved. For permissions, please e-mail: journals.permissions@oup.com.
Conflict of interest statement
The authors have no conflicts of interest to declare.
Figures


Similar articles
-
Off-target drift of the herbicide dicamba disrupts plant-pollinator interactions via novel pathways.New Phytol. 2025 Jul;247(2):850-862. doi: 10.1111/nph.20438. Epub 2025 Jan 31. New Phytol. 2025. PMID: 39887708 Free PMC article.
-
Damage and recovery from drift of synthetic-auxin herbicide dicamba depends on concentration and varies among floral, vegetative, and lifetime traits in rapid cycling Brassica rapa.Sci Total Environ. 2021 Dec 20;801:149732. doi: 10.1016/j.scitotenv.2021.149732. Epub 2021 Aug 18. Sci Total Environ. 2021. PMID: 34438156
-
Effects of the herbicide dicamba on nontarget plants and pollinator visitation.Environ Toxicol Chem. 2016 Jan;35(1):144-51. doi: 10.1002/etc.3169. Epub 2015 Nov 24. Environ Toxicol Chem. 2016. PMID: 26184786
-
The consequences of synthetic auxin herbicide on plant-herbivore interactions.Trends Plant Sci. 2023 Jul;28(7):765-775. doi: 10.1016/j.tplants.2023.02.003. Epub 2023 Feb 24. Trends Plant Sci. 2023. PMID: 36842859 Review.
-
Another step on the transgene-facilitated herbicide treadmill.Pest Manag Sci. 2024 Sep;80(9):4145-4149. doi: 10.1002/ps.8105. Epub 2024 Apr 11. Pest Manag Sci. 2024. PMID: 38527910 Review.
Cited by
-
Rhizobial variation, more than plant variation, mediates plant symbiotic and fitness responses to herbicide stress.Ecology. 2024 Dec;105(12):e4426. doi: 10.1002/ecy.4426. Epub 2024 Oct 23. Ecology. 2024. PMID: 39440990 Free PMC article.
-
Off-target drift of the herbicide dicamba disrupts plant-pollinator interactions via novel pathways.New Phytol. 2025 Jul;247(2):850-862. doi: 10.1111/nph.20438. Epub 2025 Jan 31. New Phytol. 2025. PMID: 39887708 Free PMC article.
-
Effects of Simulated Glyphosate Drift to Native Prairie Plants and Canola-Compatible Brassicaceae Species of North Dakota, United States.Crop Prot. 2024 Aug;182:106692. doi: 10.1016/j.cropro.2024.106692. Crop Prot. 2024. PMID: 39439886 Free PMC article.
-
Simulated herbicide drift alters native plant flowering phenology.Ecotoxicology. 2024 Nov;33(9):1009-1025. doi: 10.1007/s10646-024-02795-3. Epub 2024 Sep 12. Ecotoxicology. 2024. PMID: 39264548
References
-
- Abdi H, Williams J. 2010. Contrast analysis. In: Salkind N, ed. Encyclopedia of research design. Thousand Oaks, CA: Sage, 244–251.
-
- Agustí M, Zaragoza S, Iglesias DJ, Almela V, Primo-Millo E, Talón M. 2002. The synthetic auxin 3,5,6-TPA stimulates carbohydrate accumulation and growth in citrus fruit. Plant Growth Regulation 36: 141–147.
-
- Akaike H. 1973. Maximum likelihood identification of Gaussian autoregressive moving average models. Biometrika 60: 255–265. doi:10.1093/biomet/60.2.255 - DOI
-
- Albor C, García-Franco JG, Parra-Tabla V, Díaz-Castelazo C, Arceo-Gómez G. 2019. Taxonomic and functional diversity of the co-flowering community differentially affect Cakile edentula pollination at different spatial scales. Journal of Ecology 107: 2167–2181.
Publication types
MeSH terms
Substances
LinkOut - more resources
Full Text Sources
