. 2022 Nov 23:11:e80217.
doi: 10.7554/eLife.80217.

Multivalency, autoinhibition, and protein disorder in the regulation of interactions of dynein intermediate chain with dynactin and the nuclear distribution protein

Affiliations

Multivalency, autoinhibition, and protein disorder in the regulation of interactions of dynein intermediate chain with dynactin and the nuclear distribution protein

Kayla A Jara et al. Elife. .

Abstract

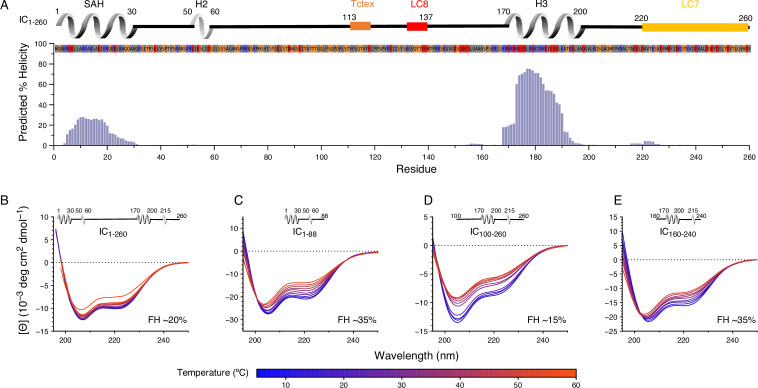
As the only major retrograde transporter along microtubules, cytoplasmic dynein plays crucial roles in the intracellular transport of organelles and other cargoes. Central to the function of this motor protein complex is dynein intermediate chain (IC), which binds the three dimeric dynein light chains at multivalent sites, and dynactin p150Glued and nuclear distribution protein (NudE) at overlapping sites of its intrinsically disordered N-terminal domain. The disorder in IC has hindered cryo-electron microscopy and X-ray crystallography studies of its structure and interactions. Here we use a suite of biophysical methods to reveal how multivalent binding of the three light chains regulates IC interactions with p150Glued and NudE. Using IC from Chaetomium thermophilum, a tractable species to interrogate IC interactions, we identify a significant reduction in binding affinity of IC to p150Glued and a loss of binding to NudE for constructs containing the entire N-terminal domain as well as for full-length constructs when compared to the tight binding observed with short IC constructs. We attribute this difference to autoinhibition caused by long-range intramolecular interactions between the N-terminal single α-helix of IC, the common site for p150Glued, and NudE binding, and residues closer to the end of the N-terminal domain. Reconstitution of IC subcomplexes demonstrates that autoinhibition is differentially regulated by light chains binding, underscoring their importance both in assembly and organization of IC, and in selection between multiple binding partners at the same site.

Keywords: NMR; dynein; molecular biophysics; multivalency; p150 Glued; protein disorder; protein interactions; structural biology.

Plain language summary

Motor proteins are the freight trains of the cell, transporting large molecular cargo from one location to another using an array of ‘roads’ known as microtubules. These hollow tubes are oriented, with one extremity (the plus-end) growing faster than the other (the minus-end). While over 40 different motor proteins travel towards the plus-end of microtubules, just one is responsible for moving cargo in the opposite direction. This protein, called dynein, performs a wide range of functions which must be carefully regulated, often through changes in the shape and interactions of various dynein segments. The intermediate chain is one of the essential subunits that form dynein, and it acts as a binding site for a range of molecular actors. In particular, it connects the three other dynein subunits (known as the light chains) to the dynein heavy chain containing the motor domain. It also binds to two non-dynein proteins: NudE, which helps to organise microtubules, and the p150Glued region of dynactin, a protein required for dynein activity. Despite their distinct roles, p150Glued and NudE attach to the same region of the intermediate chain, a highly flexible ‘unstructured’ segment which is difficult to study. How the binding of p150Glued and NudE is regulated has therefore remained unsolved. In response, Jara et al. decided to investigate how the three dynein light chains may help to control interactions between the intermediate chain and non-dynein proteins. They used more stable versions of dynein, NudE and dynactin (from a fungus that grows at high temperatures) to produce the various subcomplexes formed by the intermediate chain, the three dynein light chains, and parts of p150Glued and NudE. A suite of biophysical techniques was applied to study these structures, as they are challenging to capture using traditional approaches. This revealed that the unstructured region of the intermediate chain can fold back on itself, bringing together its two extremities; such folding blocks the p150Glued and NudE binding site. This obstruction is cleared when the light chains bind to the intermediate chain, demonstrating how these three subunits can regulate dynein activity. In humans, mutations in dynein are associated with a range of serious neurological and muscular diseases. The work by Jara et al. brings new insight into the way this protein works; more importantly, it describes how to combine several biophysical techniques to study non-structured proteins, offering a blueprint that is likely to be relevant for a wide range of scientists.


Conflict of interest statement

KJ, NL, PR, ZY, PW, CB, CV, EB No competing interests declared

Figures

Figure 1.
Figure 1.. Domain architecture for dynein intermediate chain (IC), dynactin p150Glued, and nuclear distribution protein (NudE).
(A) Domain architecture diagrams for IC from Drosophila melanogaster (Dros. IC) and Rattus norvegicus (Rat IC2C) and constructs used in earlier work are provided for comparison. Proteins and constructs used in this work are from Chaetomium thermophilum (Ct). All ICs have an N-terminal single α-helix (SAH), followed by either a transient/nascent or folded second helix (H2). In Ct, there is an additional helix (H3). The Tctex (orange), LC8 (red), and LC7 (yellow) binding sites are well characterized in Dros. IC and Rat IC2C, and their position in Ct were predicted based on sequence and structure comparison. The C-terminal domain is predicted to contain seven WD40 repeats. The Ct constructs ICFL, IC1-88, IC37-88, IC1-260, IC100-260, IC140-260, IC216-260, and IC216-260 are used in this paper; the IC1-35 construct was used in prior work. Ct p150Glued is predicted to have a Cap-Gly domain near the N-terminus, and two coiled-coil (CC) domains, CC1 and CC2, that are separated by an intercoil domain. CC1 is further divided into two regions called CC1A and CC1B. p150478-680 (p150CC1B) is the construct used in this work. Ct NudE is predicted to have an N-terminal CC region followed by disorder. NudE1-190 (NudECC) is the construct used in this work. (B) Contextual models of dynein with the heavy chains (HC) crudely shown in dark gray. IC in the subcomplex (light gray) is shown in the same orientation as the domain architecture schematic in panel A. The top model depicts the interaction between the p150Glued subunit of dynactin (blue) and the SAH and H2 regions of IC while the bottom model depicts the interaction between NudECC (green) and the SAH region of IC. In both models, dynein is a processive motor traveling toward the minus end of a microtubule, and IC is shown with the homodimeric dynein light chains: Tctex (orange), LC8 (red), and LC7 (yellow).
Figure 1—figure supplement 1.
Figure 1—figure supplement 1.. Intermediate chain (IC) sequence alignment.
Alignment of the first 260 residues of IC from Drosophila, human, and Chaetomium thermophilum using the Multiple Alignment using Fast Fourier Transform (MAFFT) alignment program (Katoh and Standley, 2013). Identical (asterisk), strongly similar (colon), and weakly similar (period) residues are shown at the bottom of each alignment. Known or predicted α-helical secondary structure (single α-helix [SAH], H2, H3, and the LC7 binding domain) is highlighted in blue, with the darker shade of blue indicating stronger prediction. Known or predicted binding sites for Tctex and LC8 are highlighted in yellow (Jespersen et al., 2019).
Figure 2.
Figure 2.. Chaetomium thermophilum (Ct) p150CC1B, NudECC, and dynein light chains are dimeric, whereas Ct IC1-260 is monomeric.
(A) Sedimentation velocity analytical ultracentrifugation profiles for LC8 (red), LC7 (yellow), and Tctex (orange) (top), and, IC1-260 (gray), p150CC1B (blue), and NudECC (green) (bottom). All samples were at protein concentration of 30 µM. (B) Sedimentation equilibrium analytical ultracentrifugation data for p150CC1B (blue) and NudECC (green) at three speeds (10,000, 14,000, and 18,000 rpm). Data were fit to a monomer-dimer binding model. The quality of the fits to this model is reflected by the plots of the residuals on top. The monomeric masses determined by fitting this data compare very well to the masses expected based on the sequences for the constructs. The stoichiometry (N) values of 2 indicate that both p150CC1B and NudECC are dimers in solution. (C) Circular dichroism spectra of p150CC1B and NudECC acquired at temperatures in the 5–60°C range. The shape of the spectra for both p150CC1B and NudECC indicates α-helical secondary structure, and the 222/208 ratios (1.04 and 1.00 for p150CC1B and NudECC, respectively) are consistent with coil-coiled structures. Inset graphs show the molar ellipticity at 222 nm as a function of temperature. (D) Multi-angle light scattering of IC1-260 gives an estimated mass of 29.5 kDa, which indicates that, on its own, IC1-260 exists as a monomer in solution (calculated mass of monomer is 29.2 kDa).
Figure 3.
Figure 3.. Secondary structure and thermal stability of Chaetomium thermophilum (Ct) intermediate chain (IC).
(A) Agadir prediction for IC1-260 showing the percent helicity by residue (purple). Shown above the plot is a schematic structure for IC1-260 with labels for single α-helix (SAH), H2, and H3 above the helical structure. The sites for lights chain binding are also indicated. The amino acid sequence under the schematic is colored by amino acid type: hydrophobic (gray), positive (red), negative (blue), and neutral (orange). Variable temperature CD spectra of (B) IC1-260, (C) IC1-88, (D) IC100-260, and (E) IC160-240. The shapes of the spectra for all constructs indicate a mixture of α-helical secondary structure and regions of intrinsic disorder. Loss in structure, or lack thereof, over a temperature range of 5–50°C (blue for lowest, red for highest) indicates how each construct varies in stability and indicates that IC1-260 is the most thermally stable. The fractional helicity (FH) of each construct at 5°C was calculated based on the experimentally observed mean residue ellipticity at 222 nm as explained in the Methods section.
Figure 3—figure supplement 1.
Figure 3—figure supplement 1.. Predicted percent helicity in intermediate chain (IC) across species.
Residue-level percent helicity predictions generated using the Agadir algorithm for the first 260 amino acids of IC from Homo sapiens (human), Rattus norvegicus (rat), Danio rerio (zebrafish), Callorhinchus milii (Australian ghostshark), Octopus bimaculoides (Californian two-spot octopus), Caenorhabditis elegans (nematode), Drosophila melanogaster (fruit fly), Chaetomium thermophilum (thermophilic fungus), and Saccharomyces cerevisiae (yeast) (Muñoz and Serrano, 1997; Muñoz and Serrano, 1994; Muñoz and Serrano, 1995a; Muñoz and Serrano, 1995b).
Figure 3—figure supplement 2.
Figure 3—figure supplement 2.. Chaetomium thermophilum (Ct) IC1-88 and Ct IC100-260 binding by sedimentation velocity analytical ultracentrifugation (SV-AUC).
(A) Domain architecture diagrams of IC1-260, IC1-88, and IC100-260. (B) SV-AUC experiments of IC100-260 (gray), IC100-260 mixed with IC1-88 at a 1:2 molar ratio (black), and IC1-260 (gray dashes). (C) The estimated mass of IC100-260/IC1-88 complex from MALS is 30.3 kDa, which indicates a 1:1 binding stoichiometry.
Figure 4.
Figure 4.. Identification of disordered linkers of Chaetomium thermophilum IC1-260 using nuclear magnetic resonance spectroscopy.
(A) Plot showing the normalized peak volumes at 10°C in the 1H-15N TROSY spectrum (gray) and in the CLEANEX spectrum (orange) of the amides that could be assigned. Assigned residues are in black in the sequence above the plot (and unassigned residues in gray); all assigned residues are from disordered regions of IC1-260. (B) 1H-15N TROSY spectrum of IC1-260 acquired at 800 MHz at 10°C showing amide assignments. (C) Overlay of a CLEANEX spectrum (orange) with the 1H-15N TROSY spectrum (gray) at 10°C, shows that most of the assignable residues are in exchange with the solvent on the timescale of the CLEANEX experiment. (D) At 40°C, 1H-15N TROSY spectrum (gray) shows new peaks appearing with greater chemical shift dispersion for IC1-260 in the 800 MHz. Overlaying a CLEANEX spectrum (orange) at this temperature reveals that most of the new peaks in the 1H-15N TROSY spectrum are from amides that are slow to exchange with the solvent and therefore are not observed in the CLEANEX spectrum.
Figure 4—figure supplement 1.
Figure 4—figure supplement 1.. Nuclear magnetic resonance spectra of intermediate chain (IC) are unaffected by salt concentration.
1H-15N TROSY spectra of IC1-260 in 20 mM NaCl (black) overlaid with IC1-260 in 250 mM NaCl (pink) at both 10°C (left) and at 40°C (right).
Figure 5.
Figure 5.. Evidence of tertiary contacts between the N and C-termini within Chaetomium thermophilum IC1-260.
(A) Domain architecture diagram for IC1-260 with bars shown below corresponding to the IC100-260, IC1-88, and IC160-240 constructs. (B) 1H-15N TROSY overlays of free 15N-labeled IC1-88 (black) and 15N-labeled IC1-260 bound to unlabeled IC160-240 (purple) and IC100-260 (green). Note, spectra are deliberately offset in the 1H dimension to help visualize overlapping peaks. (C) Normalized peak volumes in the 1H-15N TROSY spectra for (top) 15N-labeled IC1–88 (gray) and 15N-labeled IC1–88 + IC160-240 (purple) and (bottom) 15N-labeled IC1–88 (gray) and 15N-labeled IC1–88 + IC100-260 (green). (D) 1H-15N HSQC overlay of 15N-labeled IC1-88 (black), 15N-labeled IC216-260 (orange), and 15N-labeled IC216-260 bound to 15N-labeled IC1-88 (red). Arrows highlight some of the more significant peak disappearances for IC1-88 (gray arrows) and IC216-260 (orange arrows). Note, spectra are deliberately offset by 0.03 ppm in the 1H dimension to help visualize overlapping peaks. (E) Normalized peak volumes in the 1H-15N HSQC spectra for 15N-labeled IC216-260 (top, gray columns) and 15N-labeled IC216-260 (bottom, orange columns) when free and when in the presence of the other protein (red columns).
Figure 6.
Figure 6.. Binding interactions of Chaetomium thermophilum intermediate chain (IC) to p150CC1B and NudECC.
(A) Sedimentation velocity analytical ultracentrifugation profiles for samples containing p150CC1B (blue dashed line), NudECC (green dashed line), IC1-88/p150CC1B complex (blue solid line), and IC1-88/NudECC complex (green solid line) show that IC1-88 complexes have a larger sedimentation coefficient with p150CC1B than with NudECC. No data were collected for free IC1-88 because it has no absorbance at 280 nm. (B) Normalized peak volumes in the 1H-15N HSQC spectra for 15N-labeled IC37–88 (top) or 15N-labeled IC1–88 (bottom) when titrated with unlabeled p150CC1B (blue) and NudECC (green). ‘P’ indicates proline residues. No peak disappearance for IC37-88 was observed when NudECC was added. Error bars are based on propagating the root-mean-square noise of the individual spectra. (C) Isothermal titration calorimetry (ITC) thermograms for p150CC1B titrated with IC1-88 (top left), IC1-150 (top middle), and IC1-260 (top right), and for NudECC titrated with IC1-88 (bottom left), IC1-150 (bottom middle), and IC1-260 (bottom right), collected at 25°C (pH 7.5). Solid lines show fits to either a two-step binding model (p150CC1B) or a one-site binding model (NudECC). For IC1-260, reduced and endothermic binding is observed with p150CC1B whereas no binding is observed with NudECC.
Figure 6—figure supplement 1.
Figure 6—figure supplement 1.. Size exclusion chromatography with multi-angle light scattering (SEC-MALS) of IC1-88 and p150CC1B.
The estimated mass of p150CC1B from MALS is 49 kDa (light blue) while the addition of IC1-88 increases the mass to 66 kDa (dark blue) indicating a complex containing a p150CC1B dimer and two IC1-88 chains.
Figure 6—figure supplement 2.
Figure 6—figure supplement 2.. Binding interactions of Chaetomium thermophilum IC37-88 to p150CC1B and NudECC.
ITC thermograms for p150CC1B titrated with IC37-88 (left) and NudECC titrated with IC37-88 (right), collected at 25°C (pH 7.5). IC37-88 contains the H2 region of intermediate chain (IC) and binds weakly (Kd ~20 µM) to p150CC1B while no binding is detected for NudECC.
Figure 7.
Figure 7.. Binding characterization of binary complexes of IC1-260.
(A) Sedimentation velocity analytical ultracentrifugation of IC1-260/LC8, IC1-260/Tctex, IC1-260/LC7, IC1-260/p150CC1B, and IC1-260/NudECC. Data for the binary complexes is overlayed with data for each protein individually to better see shifts in the sedimentation coefficient of the binary complexes. (B) 1H-15N TROSY overlays of free 15N-labeled IC1-260 (black) and 15N-labeled IC1-260 bound to unlabeled binding partners in a 1:1.5 molar ratio. The spectra were offset by 0.03 ppm in the 1H dimension to help illustrate changes in peak intensities. Changes in peak appearances/shifts/disappearances seem to be similar for LC8 (red) and Tctex (orange) versus changes seen for p150CC1B (blue), NudECC (green), and LC7 (yellow). Arrows indicate peaks that remain when LC8 and Tctex are added to IC1-260, but disappear when p150CC1B, NudECC, and LC7 are added.
Figure 8.
Figure 8.. Reconstitution and characterization of dynein subcomplexes.
(A) Size exclusion chromatography (SEC) traces of the dynein subcomplex (IC/light chains) (purple) and the dynein subcomplex with the addition of either p150CC1B (blue) or NudECC (green). (B) Sodium dodecyl sulphate–polyacrylamide gel electrophoresis gels of fractions collected from SEC for all complexes showing all expected proteins. (C) SV-AUC profiles of the dynein subcomplex (purple) bound to p150CC1B (blue) or NudECC (green). (D) 1H-15N TROSY overlays of free IC1-260 (black) and the dynein subcomplex (purple). At 10°C, many peaks are still of high intensity in the 153 kDa complex, indicating that some regions remain disordered. The very few peaks at 40°C of the bound are most likely due to the size and tumbling of the subcomplex and consistent with the fact that the majority of the peaks at this temperature are from ordered regions.
Figure 9.
Figure 9.. Binding characterization of Chaetomium thermophilum ICFL subcomplexes.
(A) The estimated mass of ICFL from multi-angle light scattering is 75.4 kDa, which indicates that ICFL is a monomer in the absence of binding partners. (B) Sedimentation velocity analytical ultracentrifugation profiles of ICFL (black), ICFL mixed with p150CC1B (blue) or NudECC (green), and the subcomplexes: ICFL/Tctex/LC8/LC7 (gray), ICFL/Tctex/LC8/LC7/p150CC1B (blue), ICFL/Tctex/LC8/LC7/NudECC (green), ICFL/Tctex/LC8 (orange), ICFL/Tctex/LC8/p150CC1B (blue), ICFL/Tctex/LC8/NudECC (green), ICFL/LC7 (yellow), ICFL/LC7/p150CC1B (blue), and ICFL/LC7/NudECC (green). The black, dashed line is centered on unbound ICFL to help guide the eye. (C) Sodium dodecyl sulphate–polyacrylamide gel electrophoresis gel of immobilized metal affinity chromatography fractions (left to right: wash, elution, and final wash) with a band for ICFL migrating in accordance with the expected mass of ~79 kDa.
Figure 10.
Figure 10.. A model of Chaetomium thermophilum IC1-260 binding interactions and subcomplex assemblies.
Free IC1-260 is compact and in autoinhibited state (Boxed in black), with the single α-helix (SAH), H2, and H3 regions depicted as helices and with colors indicating the LC8 (red), Tctex (orange), and LC7 (yellow) binding sites. When LC7 is added (left arrow) LC7 outcompetes autoinhibition to bind IC1-260, exposing the SAH domain for p150CC1B and NudE binding. When p150CC1B or NudECC is added (down arrows) to free IC1-260, autoinhibition prevents NudECC from binding and reduces the binding affinity of p150CC1B. However, as p150CC1B is able to bind to the H2 region of IC1-260, binding is not completely prevented. Addition of Tctex and/or LC8 (right arrow) leads to a number of possible binary and ternary intermediates. LC8’s role of driving IC dimerization is depicted and, in all intermediates, we predict that IC autoinhibition remains based on very limited changes in nuclear magnetic resonance spectra. Continuing to the right, the addition of LC7 leads to formation of the dynein subcomplex and the release of SAH autoinhibition. The free SAH is now able to resume transient interactions with H2 prior to binding with either p150CC1B or NudECC. Finally, addition of p150CC1B or NudECC leads to the formation of the p150 and NudE subcomplexes (bottom right). Our sedimentation velocity analytical ultracentrifugation data suggest that the NudE subcomplex adopts a more elongated conformation.

References

    1. Alderson TR, Lee JH, Charlier C, Ying J, Bax A. Propensity for cis -proline formation in unfolded proteins. ChemBioChem. 2018;19:37–42. doi: 10.1002/cbic.201700548. - DOI - PMC - PubMed
    1. Anthis NJ, Clore GM. Sequence-Specific determination of protein and peptide concentrations by absorbance at 205 nm. Protein Science. 2013;22:851–858. doi: 10.1002/pro.2253. - DOI - PMC - PubMed
    1. Barbar E, Nyarko A. Polybivalency and disordered proteins in ordering macromolecular assemblies. Seminars in Cell & Developmental Biology. 2015;37:20–25. doi: 10.1016/j.semcdb.2014.09.016. - DOI - PMC - PubMed
    1. Benison G, Nyarko A, Barbar E. Heteronuclear NMR identifies a nascent helix in intrinsically disordered dynein intermediate chain: implications for folding and dimerization. Journal of Molecular Biology. 2006;362:1082–1093. doi: 10.1016/j.jmb.2006.08.006. - DOI - PubMed
    1. Berlow RB, Dyson HJ, Wright PE. Hypersensitive termination of the hypoxic response by a disordered protein switch. Nature. 2017;543:447–451. doi: 10.1038/nature21705. - DOI - PMC - PubMed

Publication types

MeSH terms