. 2023 Apr;290(8):2097-2114.
doi: 10.1111/febs.16689. Epub 2022 Dec 4.

Strain-dependent differences in coordination of yeast signalling networks

Affiliations

Strain-dependent differences in coordination of yeast signalling networks

Taylor D Scott et al. FEBS J. 2023 Apr.

Abstract

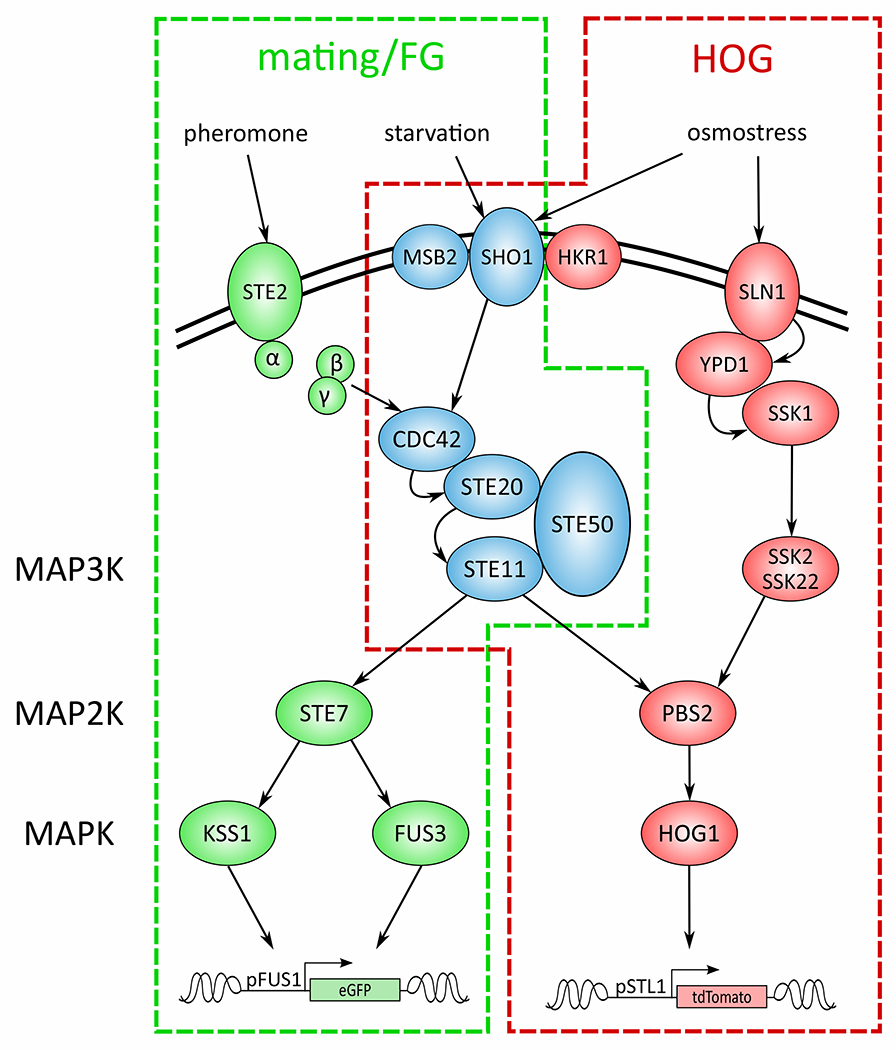
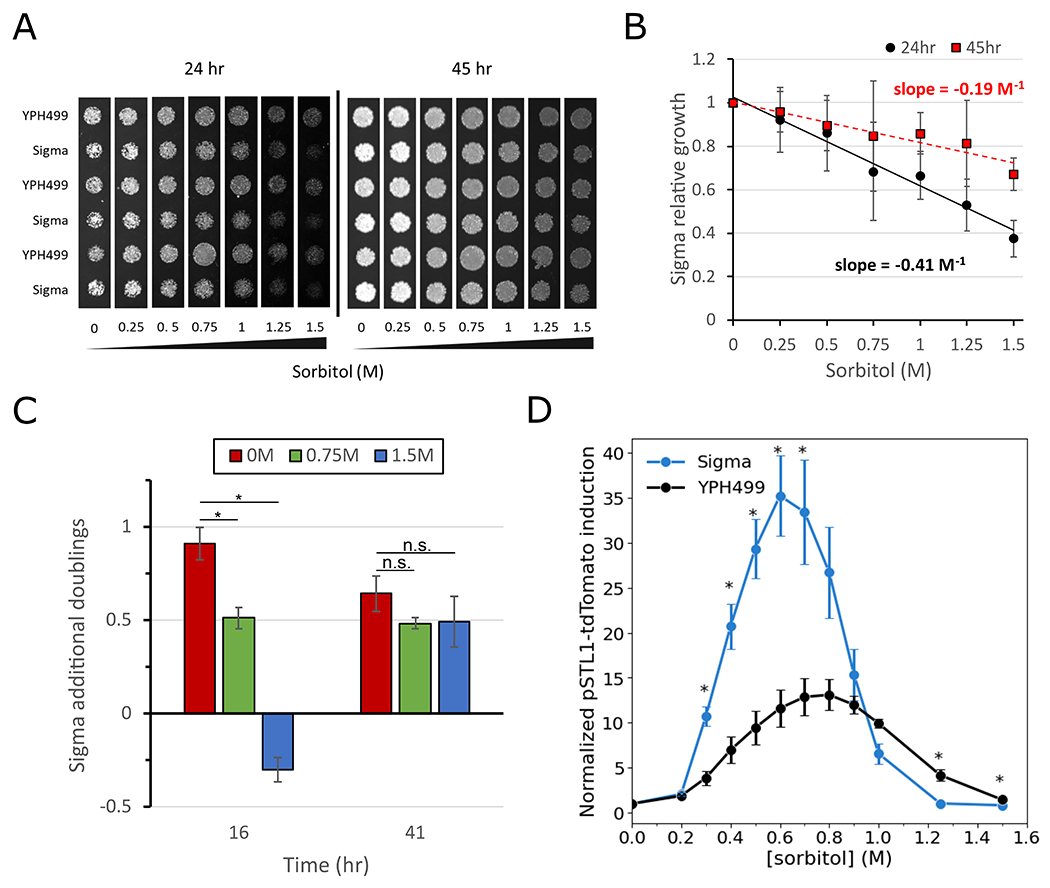
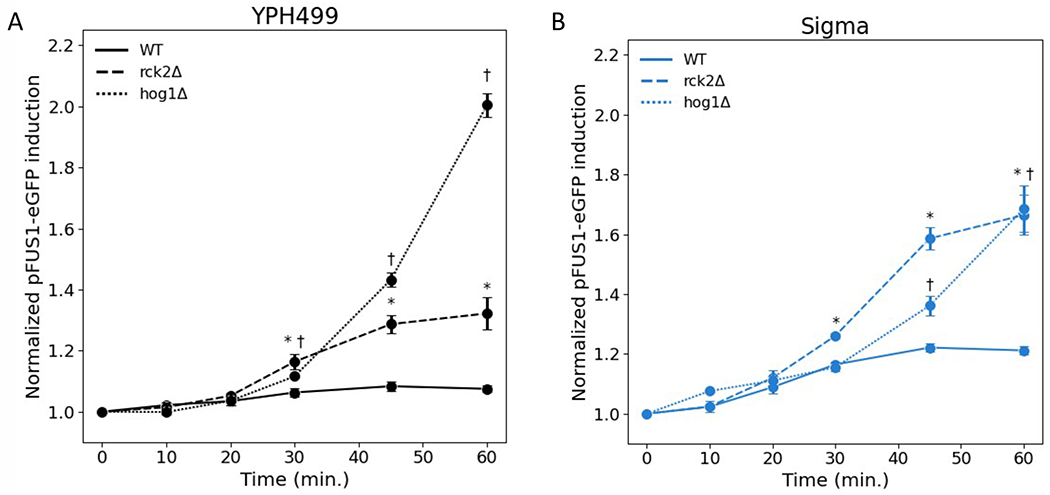
The yeast mitogen-activated protein kinase pathways serve as a model system for understanding how network interactions affect the way in which cells coordinate the response to multiple signals. We have quantitatively compared two yeast strain backgrounds YPH499 and ∑1278b (both of which have previously been used to study these pathways) and found several important differences in how they coordinate the interaction between the high osmolarity glycerol (HOG) and mating pathways. In the ∑1278b background, in response to simultaneous stimulus, mating pathway activation is dampened and delayed in a dose-dependent manner. In the YPH499 background, only dampening is dose-dependent. Furthermore, leakage from the HOG pathway into the mating pathway (crosstalk) occurs during osmostress alone in the ∑1278b background only. The mitogen-activated protein kinase Hog1p suppresses crosstalk late in an induction time course in both strains but does not affect the early crosstalk seen in the ∑1278b background. Finally, the kinase Rck2p plays a greater role suppressing late crosstalk in the ∑1278b background than in the YPH499 background. Our results demonstrate that comparisons between laboratory yeast strains provide an important resource for understanding how signalling network interactions are tuned by genetic variation without significant alteration to network structure.

Keywords: HOG; MAPK signalling; crosstalk; mating; signal transduction.


Conflict of interest statement

Conflicts of Interest

We have no conflicts of interest to declare.

Figures

Figure 1:
Figure 1:. Yeast MAPK pathways
In yeast, the responses to pheromone, nutrient starvation, and hyperosmotic stress are controlled by mitogen activated protein kinase (MAPK) networks termed the mating pathway, filamentous growth (FG) pathway, and the high osmolarity glycerol (HOG) pathway respectively. The HOG pathway is outlined in red, and the mating/FG pathways are outlined in green. Components belonging to the mating pathway only are shown in green; components belonging to the HOG pathway only are shown in red; blue components belong to more than one of the three pathways. In our experiments, activation of the HOG pathway results in expression of pSTL1-tdTomato and mating/FG pathway activity results in expression of pFUS1-eGFP.
Figure 2:
Figure 2:. Sigma is more osmosensitive than YPH499
A: Spot tests of YPH499 and Sigma on varying concentrations of sorbitol after 24 hr (left) and 45 hr (right) at 30°C. B: Quantification of the growth defect in Sigma relative to YPH499 as a function of sorbitol concentration. The quantification was done at 24 hr (black circles) and at 45 hr (red squares). The slope of the line represents the relative growth defect in Sigma per molar sorbitol. Plotted are mean ± standard error of the mean (s.e.m.) of 3 biological replicates. C: Growth of YPH499 and Sigma in liquid YPD with or without sorbitol. OD600 measurements were used to calculate the number of doublings at 16 hr and 41 hr of 3 cultures each of Sigma and YPH499 in YPD with the indicated dose of sorbitol. Bars represent the mean ± s.e.m. of the difference between the Sigma doublings and the YPH499 doublings. p-values calculated using two-sided student’s t-test with equal variance. *p<0.05. n.s., not significant. D: Induction of pSTL1-tdTomato in YPH499 (gray) and Sigma (blue) after 45 minutes in various doses of sorbitol. Plotted are mean ± s.e.m. of 3 biological replicates.
Figure 3:
Figure 3:. Effect of osmostress on mating pathway activation
A: Sorbitol disruption of the mating pathway consists of a strong initial dampening followed by recovery to a final dampening level. Initial dampening – minimum value of curve; final dampening – average of 150 min. and 180 min. time points. Delay is calculated as the full-width half minimum. B: Effect of various concentrations of sorbitol on mating pathway induction in YPH499 at 10 μM α-factor. Points and error bars are mean ± standard error of the mean (s.e.m.) of 3 biological replicates (0.25M – 0.75M) or 2 biological replicates (1M – 1.5M). C: Effect of various concentrations of sorbitol on mating pathway induction in Sigma at 10 μM α-factor. Points and error bars are mean ± s.e.m. of 3 biological replicates (0.25M – 0.75M) or 2 biological replicates (1M – 1.5M). D: Initial and final dampening due to osmostress are identical in YPH499 and Sigma. Points and error bars are mean ± s.e.m. of 3 biological replicates (0.25M – 0.75M) or 2 biological replicates (1M – 1.5M). E: Delay as a function of sorbitol in Sigma and YPH499. Sigma has a smaller delay at low-to-moderate concentrations of sorbitol. Points and error bars are mean ± s.e.m. of 3 biological replicates (0.25M – 0.75M) or 2 biological replicates (1M – 1.5M). F: Induction of pFUS1-eGFP in Sigma in response to sorbitol alone. Points and error bars are mean ± s.e.m. of 2 biological replicates.
Figure 4:
Figure 4:. Sigma induces the mating pathway at certain levels of osmostress
A: Flow cytometry time course of sorbitol-induced pFUS1-eGFP induction in YPH499 and Sigma. Data for each strain is normalized to the t = 0 time point. (mean +/− s.e.m.; N = 19 biological replicates; Sigma t=60 is 17 biological replicates). * p<0.05, two-sided student’s t-test with equal variance. B: pFUS1-eGFP induction at 45 min. in the indicated concentration of sorbitol. Data for each strain is normalized to the [sorbitol] = 0 point. (mean +/− s.d.; n = 3 biological replicates). * p<0.05, two-sided student’s t-test with equal variance. C: Representative images of cells after a 10 minute induction with 0M sorbitol (left) or 0.75M sorbitol (right). Single mRNA transcripts appear as green (STL1) or magenta (FUS1) dots. Cells were additionally stained with DAPI (blue). D: Proportion of cells with at least 1 FUS1 transcripts after 10 min induction with varying doses of sorbitol. Error bars represent at 95% confidence interval for the proportion of cells with FUS1 transcripts. Average N = 313 cells in each FISH experiment.
Figure 5:
Figure 5:. Crosstalk in Sigma is dependent on mating pathway components
Flow cytometry measurements of crosstalk in mating/FG pathway deletions. Each panel shows a Sigma background deletion (A: fus3Δ; B: kss1Δ; C: ste11Δ; D: fus3Δ kss1Δ) along with Sigma-background and YPH499-background wild-type controls. Measurements are normalized to the t = 0 timepoint. Plotted are mean +/− s.e.m.; n = 3 (panels A, C, D) or 4 (panel B) biological replicates. The wild-type controls were performed concurrently with the deletion in each panel. The fus3Δ and kss1Δ deletions (panels C and D) were measured simultaneously and the wild-type control lines are the same in both panels. *p<0.05, student’s t-test with equal variance.
Figure 6:
Figure 6:. HOG-dependent suppression of crosstalk occurs late in a time course
Flow cytometry measurements of crosstalk in WT (–), hog1Δ (…), or rck2Δ (--) cells in the (A) YPH499 or (B) Sigma backgrounds. Measurements are normalized to the t = 0 time point. Mean ± s.e.m.; n = 3 biological replicates. A student’s t-test with equal variance was performed between WT and rck2Δ (*) and between WT and hog1Δ (†). Markers represent points at which p<0.05.
Figure 7:
Figure 7:. HOG pathway disruptions affect late crosstalk but not early crosstalk
Flow cytometry measurements of crosstalk in mutants which disrupt HOG pathway activity. Each panel shows a Sigma background or YPH499 background deletion of SSK1 (panels A, C) and a kinase-dead HOG1D144A mutant (panels B, D) along with a wild-type control. Measurements are normalized to the t = 0 time point. The wild-type controls were performed concurrently with the deletion in each panel. Mean +/− s.e.m.; N = 3 biological replicates. *p<0.05, student’s t-test with equal variance.
Figure 8:
Figure 8:. AMN1 affects clumpiness in Sigma
Introducing the AMN1D368V allele significantly reduces clumpiness in the Sigma background. Representative brightfield images of Sigma-background strains with the wild-type (A) or D368V allele (B) of AMN1 taken with a 40X objective. The wild-type cells exhibit clumpy behavior while the cells with the AMN1D358V allele do not. Scale bar, 10 μm.
Figure 9:
Figure 9:. Flow cytometry gating
Representative examples of flow cytometry gating in the (A) YPH499 and (B) Sigma backgrounds. Data was first gated for eGFP+ events in FSC-H vs BL1-H, then for tdTomato+ cells in FSC-H vs YL1-H. Double positive events were then gated for cells in FSC-A vs SSC-A and single cells in FSC-A vs FSC-H and SSC-A vs SSC-H. Finally, live cells were gated using RL2-H vs FSC-H. Each panel shows the final gating in a BL1-H vs YL1-H view (large image) as well as the ancestry in the smaller gates, beginning with the eGFP+ gate at the top.

References

    1. Widmann C, Gibson S, Jarpe MB & Johnson GL (1999) Mitogen-Activated Protein Kinase: Conservation of a Three-Kinase Module From Yeast to Human. Physiological Reviews 79, 143–180. - PubMed
    1. Braicu C, Buse M, Busuioc C, Drula R, Gulei D, Raduly L, Rusu A, Irimie A, Atanasov AG, Slaby O, Ionescu C & Berindan-Neagoe I (2019) A Comprehensive Review on MAPK: A Promising Therapeutic Target in Cancer. Cancers (Basel) 11, 1618. - PMC - PubMed
    1. Lavoie H, Gagnon J & Therrien M (2020) ERK signalling: a master regulator of cell behaviour, life and fate. Nat Rev Mol Cell Biol 21, 607–632. - PubMed
    1. Scott TD, Sweeney K & McClean MN (2019) Biological signal generators: integrating synthetic biology tools and in silico control. Curr Opin Syst Biol 14, 58–65. - PMC - PubMed
    1. Maeda T, Wurgler-Murphy SM & Saito H (1994) A two-component system that regulates an osmosensing MAP kinase cascade in yeast. Nature 369, 242–245. - PubMed

Publication types

MeSH terms

Substances

LinkOut - more resources