

Expression of immune checkpoint molecules on adult and neonatal T-cells
- PMID: 36417145
- PMCID: PMC10060332
- DOI: 10.1007/s12026-022-09340-6
Expression of immune checkpoint molecules on adult and neonatal T-cells
Abstract
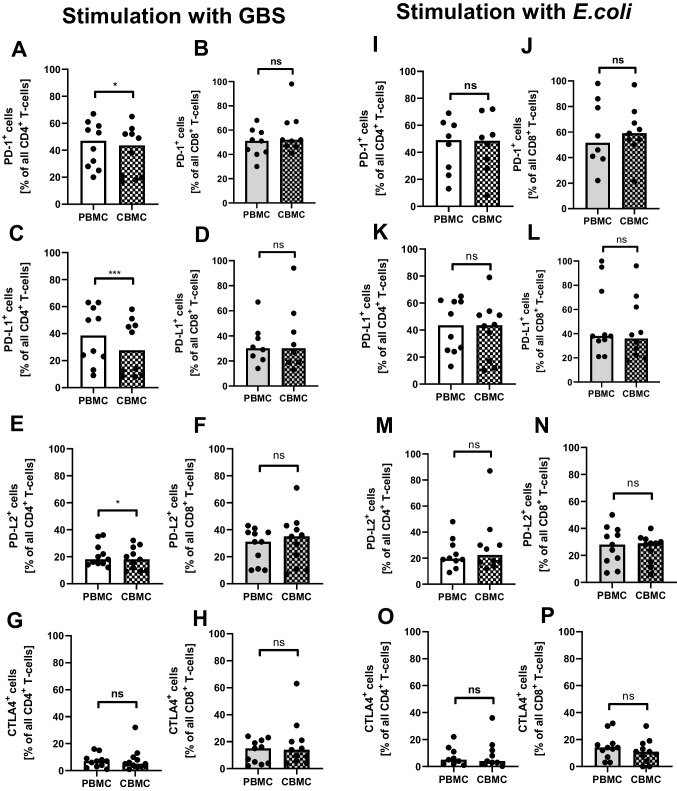
Term and especially preterm neonates are much more susceptible to serious bacterial infections than adults. But not only the susceptibility to infection is increased in neonates, but also their risk for developing post-inflammatory diseases such as bronchopulmonary dysplasia (BPD) and periventricular leukomalacia (PVL). This may be due to an impaired ability to terminate inflammation. In the study presented here, we aimed to investigate the proliferative response and the expression of immune-checkpoint molecules (ICM) and activation markers on neonatal T-cells in comparison to adult T-cells with the hypothesis that an increased activation of neonatal T-cells may contribute to the failure of inflammation resolution observed in neonates. We show that neonatal CD4+ and CD8+ T-cells show an increased proliferative capacity and an increased expression of activation markers compared to adult T-cells upon stimulation with OKT3 as well as a decreased expression of ICM, especially PD-L1 on their surface. This decreased expression of PD-L1 by neonatal T-cells was also observed after stimulation with GBS, but not after stimulation with E. coli, the two most important pathogens in neonatal sepsis. Expression of the T-cell receptor CD3 and the co-stimulatory molecule CD28 did not differ between adult and neonatal T-cells upon bacterial stimulation. Decreased expression of ICM upon T-cell activation may be a reason for the increased risk of neonates to develop post-inflammatory diseases.
Keywords: Co-stimulatory molecules; Immune-checkpoint molecules; Neonatal sepsis; T-cell proliferation.
© 2022. The Author(s).
Conflict of interest statement
The authors declare that they have no conflict of interest.
Figures


Similar articles
-
PD-1/PD-L1 Control of Antigen-Specifically Activated CD4 T-Cells of Neonates.Int J Mol Sci. 2023 Mar 16;24(6):5662. doi: 10.3390/ijms24065662. Int J Mol Sci. 2023. PMID: 36982735 Free PMC article.
-
Group B streptococci infection model shows decreased regulatory capacity of cord blood cells.Pediatr Res. 2022 Nov;92(5):1407-1416. doi: 10.1038/s41390-021-01880-1. Epub 2022 Feb 14. Pediatr Res. 2022. PMID: 35165359 Free PMC article.
-
Direct-acting antiviral treatment downregulates immune checkpoint inhibitor expression in patients with chronic hepatitis C.Clin Exp Med. 2020 May;20(2):219-230. doi: 10.1007/s10238-020-00618-3. Epub 2020 Feb 27. Clin Exp Med. 2020. PMID: 32108916 Free PMC article.
-
Maturation of human neonatal CD4+ and CD8+ T lymphocytes into Th1/Th2 effectors.Vaccine. 1998 Aug-Sep;16(14-15):1415-9. doi: 10.1016/s0264-410x(98)00101-7. Vaccine. 1998. PMID: 9711781 Review.
-
A Systematic Review of the Tumor-Infiltrating CD8+ T-Cells/PD-L1 Axis in High-Grade Glial Tumors: Toward Personalized Immuno-Oncology.Front Immunol. 2021 Sep 17;12:734956. doi: 10.3389/fimmu.2021.734956. eCollection 2021. Front Immunol. 2021. PMID: 34603316 Free PMC article.
Cited by
-
EGF-Receptor against Amphiregulin (AREG) Influences Costimulatory Molecules on Monocytes and T Cells and Modulates T-Cell Responses.J Immunol Res. 2023 Nov 24;2023:8883045. doi: 10.1155/2023/8883045. eCollection 2023. J Immunol Res. 2023. PMID: 38046264 Free PMC article.
-
Prion protein alters viral control and enhances pathology after perinatal cytomegalovirus infection.Nat Commun. 2024 Sep 5;15(1):7754. doi: 10.1038/s41467-024-51931-4. Nat Commun. 2024. PMID: 39237588 Free PMC article.
-
PD-1/PD-L1 Control of Antigen-Specifically Activated CD4 T-Cells of Neonates.Int J Mol Sci. 2023 Mar 16;24(6):5662. doi: 10.3390/ijms24065662. Int J Mol Sci. 2023. PMID: 36982735 Free PMC article.
-
Gestational age at birth and hospitalisations for infections among individuals aged 0-50 years in Norway: a longitudinal, register-based, cohort study.EClinicalMedicine. 2023 Jul 20;62:102108. doi: 10.1016/j.eclinm.2023.102108. eCollection 2023 Aug. EClinicalMedicine. 2023. PMID: 37538542 Free PMC article.
-
[The impact of immune cells selection on the therapeutic efficacy of CAR-T cell therapy].Zhonghua Xue Ye Xue Za Zhi. 2024 Jul 14;45(7):699-704. doi: 10.3760/cma.j.cn121090-20240321-00104. Zhonghua Xue Ye Xue Za Zhi. 2024. PMID: 39231778 Free PMC article. Review. Chinese.
References
Publication types
MeSH terms
Substances
LinkOut - more resources
Full Text Sources
Research Materials
