. 2023 Feb 12;191(2):1324-1343.
doi: 10.1093/plphys/kiac521.

PHOSPHATE RESPONSE 1 family members act distinctly to regulate transcriptional responses to phosphate starvation

Affiliations

PHOSPHATE RESPONSE 1 family members act distinctly to regulate transcriptional responses to phosphate starvation

Zhen Wang et al. Plant Physiol. .

Abstract

To sustain growth when facing phosphate (Pi) starvation, plants trigger an array of adaptive responses that are largely controlled at transcriptional levels. In Arabidopsis (Arabidopsis thaliana), the four transcription factors of the PHOSPHATE RESPONSE 1 (PHR1) family, PHR1 and its homologs PHR1-like 1 (PHL1), PHL2, and PHL3 form the central regulatory system that controls the expression of Pi starvation-responsive (PSR) genes. However, how each of these four proteins function in regulating the transcription of PSR genes remains largely unknown. In this work, we performed comparative phenotypic and transcriptomic analyses using Arabidopsis mutants with various combinations of mutations in these four genes. The results showed that PHR1/PHL1 and PHL2/PHL3 do not physically interact with each other and function as two distinct modules in regulating plant development and transcriptional responses to Pi starvation. In the PHR1/PHL1 module, PHR1 plays a dominant role, whereas, in the PHL2/PHL3 module, PHL2 and PHL3 contribute similarly to the regulation of PSR gene transcription. By analyzing their common and specific targets, we showed that these PHR proteins could function as both positive and negative regulators of PSR gene expression depending on their targets. Some interactions between PHR1 and PHL2/PHL3 in regulating PSR gene expression were also observed. In addition, we identified a large set of defense-related genes whose expression is not affected in wild-type plants but is altered in the mutant plants under Pi starvation. These results increase our understanding of the molecular mechanism underlying plant transcriptional responses to Pi starvation.


Conflict of interest statement

Conflict of interest statement. The authors declare that there was no conflict of interest.

Figures

Figure 1
Figure 1
Phylogenetic tree of Arabidopsis MYB-CC family members and tissue-specific expression patterns of PHR1 and PHL1. A, The phylogenetic tree was generated by MEGA 7 software. Multiple alignment was conducted by an online service, Clustal Omega (https://www.ebi.ac.uk/Tools/msa/clustalo/). A maximum likelihood (ML) algorithm and full-length protein sequences were used to construct the tree. B, Diagram showing the amino acid sequences of MYB-CC family members. The sequences with high similarities are shown in red. One unit in the scale (between two long vertical lines) represents 20 amino acids. The diagram was generated using an online service, COBALT (https://www.ncbi.nlm.nih.gov/tools/cobalt/). Diamonds indicate the genes that were investigated in this study. C–N, The expression patterns of PHR1::GUS (C–H) and PHL1::GUS (I–N).
Figure 2
Figure 2
Growth phenotypes of phr mutants in soil. A, The WT and five single phr mutants. B, The WT, phr1, and three double mutants. C, The WT, phr1, phr1phl1, and the triple and quadruple mutants. D, The WT, phr1, and three double mutants. All plants were 35-day-old when photographed. r1, l1, l2, and l3 are short for phr1, phl1, phl2, and phl3 in double, triple, and quadruple mutants. Bars = 5 cm.
Figure 3
Figure 3
Primary root length and cellular Pi content of the WT and various mutants grown under Pi sufficiency (+Pi) and Pi deficiency (−Pi). A, Morphology of 8-day-old seedlings of various mutants grown under +Pi and −Pi conditions. Bar = 1 cm. The scale bar refers to all images in (A). B and C, The cellular Pi contents of shoots and roots of 10-day-old seedlings grown under +Pi (B) and −Pi (C). Agar was used as the gelling agent for measurement of cellular Pi content. The experiments were repeated three times, and the representative results are shown. The boxplots contain the first and third quartiles, split by the median; Tukey whiskers go to the highest or lowest point. One-way ANOVA and Tukey's multiple comparisons test were used for statistical analysis, P < 0.05.
Figure 4
Figure 4
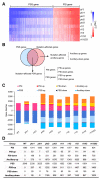
Summary of the differentially expressed genes in the WT and various phr mutants. A, Heatmap showing the expression levels of the PSR genes in the WT and various phr mutants. The value (Log2FC) for each PSR gene in the heatmap was calculated by comparing the expression of Pi-deficient plants of each genotype to the expression of the Pi-sufficient WT. The diagram was generated using an online software, Morpheus (https://software.broadinstitute.org/morpheus/). B, Classifications of the mutation-affected PSR genes and the mutation-affected ancillary genes. C, Histograms showing the number of the six groups of genes in each mutant defined in (B). D, A table showing the number of the six groups of the genes in each mutant defined in (B). PSI, Pi starvation-induced; PSS, Pi starvation-suppressed.
Figure 5
Figure 5
Lists of the GO terms of the mutation-affected PSR genes in the four phr single mutants. A, C, and E, the top GO terms of the phr1-, phl2-, and phl3-affected PSI-up genes, respectively. B, D, and F, the top GO terms of the phr1-, phl2-, and phl3-affected PSI-down genes, respectively. G–I, the top GO terms of the phr1-, phl2-, and phl3-affected PSS-up genes, respectively. The number of genes used for GO analyses in each group is indicated in parentheses. PSI, Pi starvation-induced; PSS, Pi starvation-suppressed.
Figure 6
Figure 6
Different types of PSR genes regulated by the four PHR proteins. A, A table indicating the number of PSR genes by type whose expression was affected in each phr mutant. B, Heatmap showing the relative expression levels of 135 highly responsive PSI genes in the WT and four phr mutants. The value (Log2FC) for each PSR gene in the heatmap was calculated by comparing those of Pi-deficient plants of each genotype to those of Pi-sufficient WT. C, Heatmap showing the relative expression of 34 genes known to be or putatively to be involved in Pi homeostasis in the WT and various phr mutants under Pi deficiency. The TPM (transcripts per million) values used in the heatmaps have been standardized by min–max standardization. No., number of genes; PSI, Pi starvation-induced; PSS, Pi starvation-suppressed.
Figure 7
Figure 7
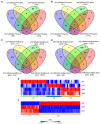
Common and unique PSR and ancillary genes regulated by four PHR proteins. A–D, Venn diagram showing the common and unique PSI (Pi starvation-induced) genes (A), PSS (Pi starvation-suppressed) genes (B), ancillary-up genes (C), and ancillary-down genes (D) whose expression was affected in four individual phr single mutants. The numbers of the genes affected in each mutant are indicated in the parentheses. The letters in the Venn diagrams represent a specific group of the genes. E, Heatmap showing the 44 PSI (in A, part “b”) genes whose expression was commonly affected in phr1, phl2, and phl3. F, Heatmap showing the 206 PSI (in A, part “c”) genes whose expression was commonly affected in phl2 and phl3. E and F, K-means clustering was used to divide these commonly affected genes into three (E) and two (F) groups. The TPM (transcripts per million) values used in the heatmaps have been standardized.
Figure 8
Figure 8
Interactive effects of PHR1 and a PHL protein on the expression of PSI (Pi starvation-induced) genes. A, Venn diagram of the PSI genes whose expression was affected in phr1, phl1, and phr1phl1. B and C, Heatmaps showing the relative expression levels of the PSI genes in part “a” (B) and part “c” (C) in the WT, phr1, phl1, and phr1phl1. In (B) and (C), the histograms next to the heatmap show the different types of interactive effects of PHR1 and PHL1 on the expression of PSI genes. The same displays for the interactive effects of PHR1 and PHL2, and of PHR1 and PHL3 on PSI gene expression are shown in (D–F) and (G–I), respectively. The TPM (transcripts per million) values used in the heatmap have been standardized.

References

    1. Bari R, Datt Pant B, Stitt M, Scheible WR (2006) PHO2, microRNA399, and PHR1 define a phosphate-signaling pathway in plants. Plant Physiol 141(3): 988–999 - PMC - PubMed
    1. Batoko H, Zheng HQ, Hawes C, Moore I (2000) A rab1 GTPase is required for transport between the endoplasmic reticulum and Golgi apparatus and for normal Golgi movement in plants. Plant Cell 12(11): 2201–2218 - PMC - PubMed
    1. Bustos R, Castrillo G, Linhares F, Puga MI, Rubio V, Pérez-Pérez J, Solano R, Leyva A, Paz-Ares J (2010) A central regulatory system largely controls transcriptional activation and repression responses to phosphate starvation in Arabidopsis. PLoS Genet 6(9): e1001102. - PMC - PubMed
    1. Chen C, Chen H, Zhang Y, Thomas HR, Frank MH, He Y, Xia R (2020). TBtools: an integrative toolkit developed for interactive analyses of big biological data. Mol Plant 13(8): 1194–1202 - PubMed
    1. Chen H, Zou Y, Shang Y, Lin H, Wang Y, Cai R, Tang X, Zhou J (2008) Firefly luciferase complementation imaging assay for protein-protein interactions in plants. Plant Physiol 146(2): 368–376 - PMC - PubMed

Publication types

MeSH terms