

Variation in carbon and nitrogen concentrations among peatland categories at the global scale
- PMID: 36417456
- PMCID: PMC9683585
- DOI: 10.1371/journal.pone.0275149
Variation in carbon and nitrogen concentrations among peatland categories at the global scale
Abstract
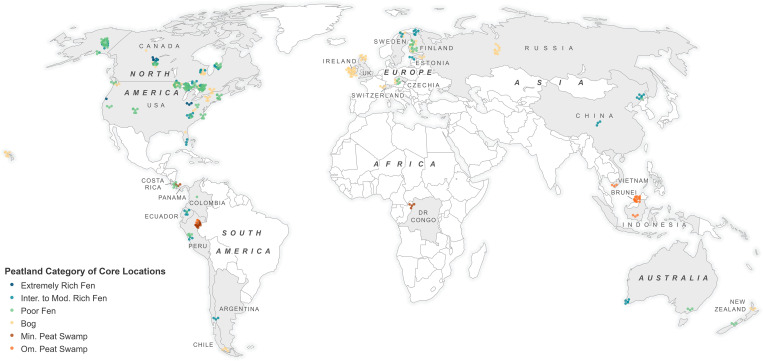
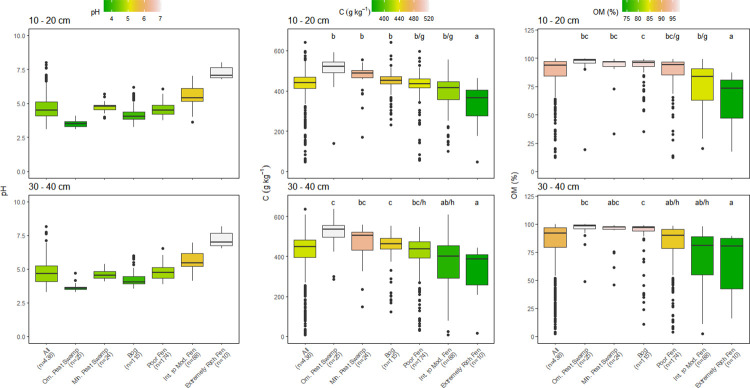
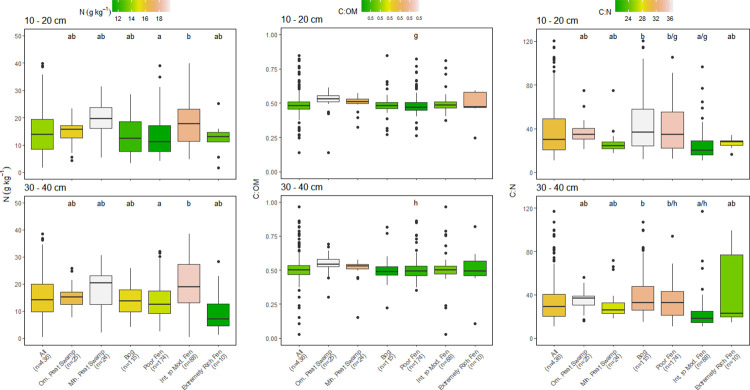
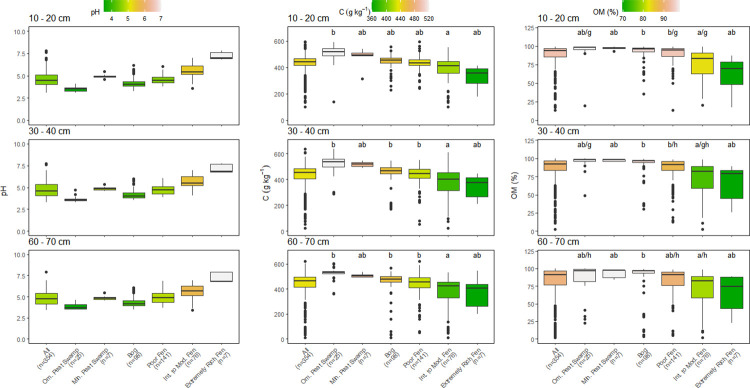
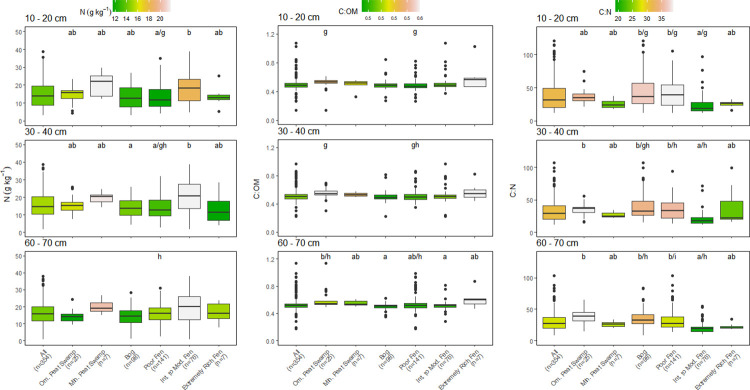
Peatlands account for 15 to 30% of the world's soil carbon (C) stock and are important controls over global nitrogen (N) cycles. However, C and N concentrations are known to vary among peatlands contributing to the uncertainty of global C inventories, but there are few global studies that relate peatland classification to peat chemistry. We analyzed 436 peat cores sampled in 24 countries across six continents and measured C, N, and organic matter (OM) content at three depths down to 70 cm. Sites were distinguished between northern (387) and tropical (49) peatlands and assigned to one of six distinct broadly recognized peatland categories that vary primarily along a pH gradient. Peat C and N concentrations, OM content, and C:N ratios differed significantly among peatland categories, but few differences in chemistry with depth were found within each category. Across all peatlands C and N concentrations in the 10-20 cm layer, were 440 ± 85.1 g kg-1 and 13.9 ± 7.4 g kg-1, with an average C:N ratio of 30.1 ± 20.8. Among peatland categories, median C concentrations were highest in bogs, poor fens and tropical swamps (446-532 g kg-1) and lowest in intermediate and extremely rich fens (375-414 g kg-1). The C:OM ratio in peat was similar across most peatland categories, except in deeper samples from ombrotrophic tropical peat swamps that were higher than other peatlands categories. Peat N concentrations and C:N ratios varied approximately two-fold among peatland categories and N concentrations tended to be higher (and C:N lower) in intermediate fens compared with other peatland types. This study reports on a unique data set and demonstrates that differences in peat C and OM concentrations among broadly classified peatland categories are predictable, which can aid future studies that use land cover assessments to refine global peatland C and N stocks.
Copyright: This is an open access article, free of all copyright, and may be freely reproduced, distributed, transmitted, modified, built upon, or otherwise used by anyone for any lawful purpose. The work is made available under the Creative Commons CC0 public domain dedication.
Conflict of interest statement
There are no competing interests
Figures
References
-
- Gorham E. (1991). Northern peatlands: Role in the global carbon cycle and probable response to climate warming. Ecological Applications, 1, 182–193. - PubMed
-
- Dommain R., Couwenberg J., Glaser P.H., Joosten H., Suryadiputra I.N.N. (2014). Carbon storage and release in Indonesian peatlands since the last deglaciation. Quaternary Science Reviews, 97, 1–32.
-
- Page S. E., Rieley J. O., & Banks C. J. (2011). Global and regional importance of the tropical peatland carbon pool. Global Change Biology, 17, 798–818.
-
- Joosten H. (2004). The IMCG Global Peatland Database, www.imcg.net/gpd/gpd.htm.
Publication types
MeSH terms
Substances
LinkOut - more resources
Full Text Sources
