. 2022 Nov 23;18(11):e1010724.
doi: 10.1371/journal.pcbi.1010724. eCollection 2022 Nov.

Trends in SARS-CoV-2 infection prevalence during England's roadmap out of lockdown, January to July 2021

Affiliations

Trends in SARS-CoV-2 infection prevalence during England's roadmap out of lockdown, January to July 2021

Oliver Eales et al. PLoS Comput Biol. .

Abstract

Background: Following rapidly rising COVID-19 case numbers, England entered a national lockdown on 6 January 2021, with staged relaxations of restrictions from 8 March 2021 onwards.

Aim: We characterise how the lockdown and subsequent easing of restrictions affected trends in SARS-CoV-2 infection prevalence.

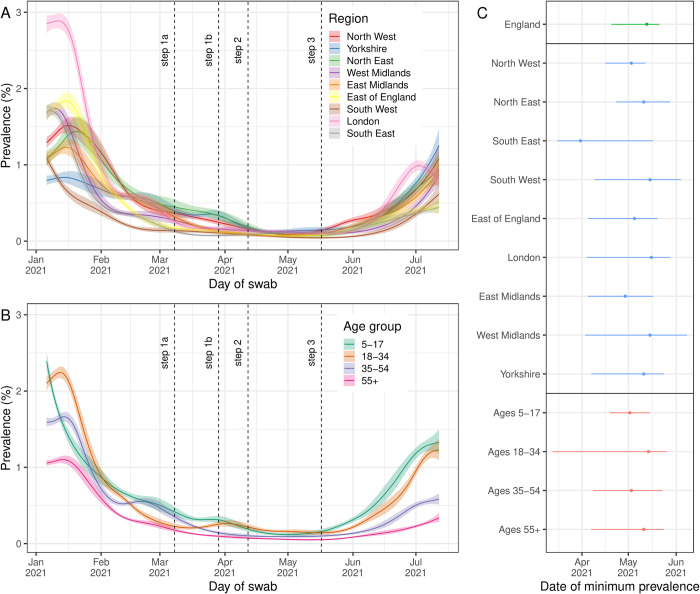
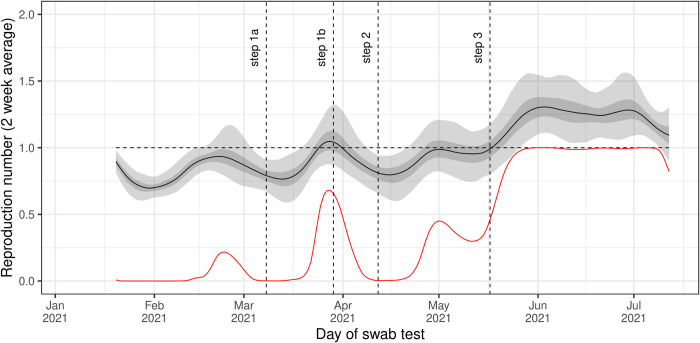
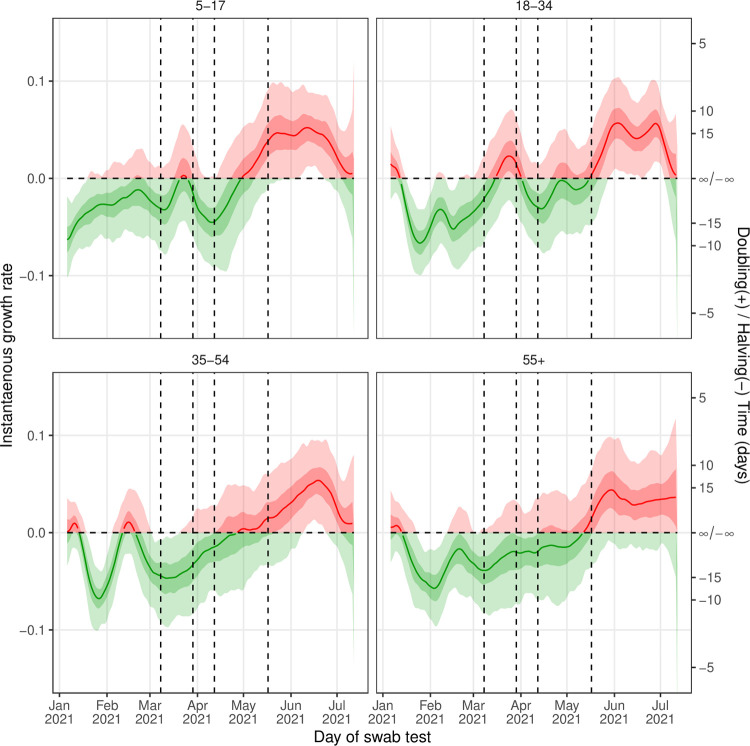
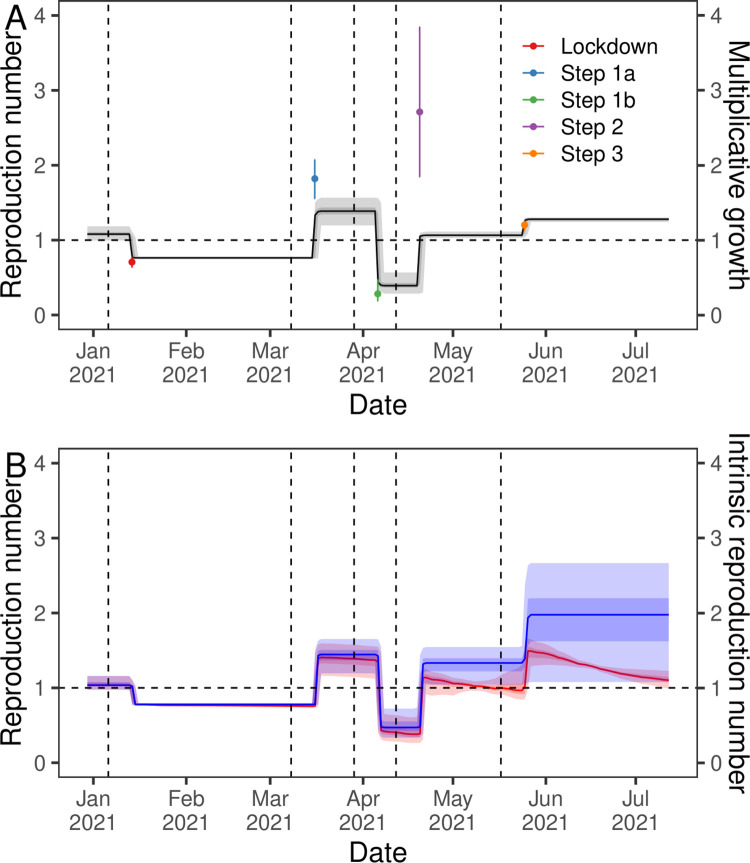
Methods: On average, risk of infection is proportional to infection prevalence. The REal-time Assessment of Community Transmission-1 (REACT-1) study is a repeat cross-sectional study of over 98,000 people every round (rounds approximately monthly) that estimates infection prevalence in England. We used Bayesian P-splines to estimate prevalence and the time-varying reproduction number (Rt) nationally, regionally and by age group from round 8 (beginning 6 January 2021) to round 13 (ending 12 July 2021) of REACT-1. As a comparator, a separate segmented-exponential model was used to quantify the impact on Rt of each relaxation of restrictions.

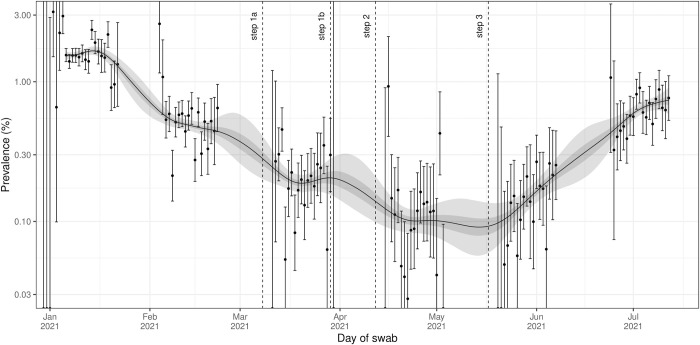
Results: Following an initial plateau of 1.54% until mid-January, infection prevalence decreased until 13 May when it reached a minimum of 0.09%, before increasing until the end of the study to 0.76%. Following the first easing of restrictions, which included schools reopening, the reproduction number Rt increased by 82% (55%, 108%), but then decreased by 61% (82%, 53%) at the second easing of restrictions, which was timed to match the Easter school holidays. Following further relaxations of restrictions, the observed Rt increased steadily, though the increase due to these restrictions being relaxed was offset by the effects of vaccination and also affected by the rapid rise of Delta. There was a high degree of synchrony in the temporal patterns of prevalence between regions and age groups.

Conclusion: High-resolution prevalence data fitted to P-splines allowed us to show that the lockdown was effective at reducing risk of infection with school holidays/closures playing a significant part.


Conflict of interest statement

The authors have declared that no competing interests exist.

Figures

Fig 1
Fig 1. Smoothed estimates of infection prevalence in England.
Modelled infection prevalence in England from 6 January to 12 July 2021 estimated using a Bayesian P-spline model fit to rounds 1–13 of REACT-1 data (only shown for rounds 8–13). Dashed lines show the date of key restriction changes in England. Estimates of infection prevalence are shown with a central estimate (solid line) and 50% (dark shaded region) and 95% (dark shaded region) credible intervals. Daily weighted estimates of swab positivity (points) are shown with 95% confidence intervals (error bars). Dashed lines show the date of key restriction changes in England.
Fig 2
Fig 2. Differences in smoothed estimates of infection prevalence by region and age group.
(A) Regional infection prevalence from 6 January to 12 July 2021 estimated using a Bayesian P-spline model fit to all 13 rounds of REACT-1 (only shown for rounds 8–13) assuming a constant second-order random-walk prior distribution (value set to estimate from national model fit). In the legend Yorkshire is short for Yorkshire and The Humber. (B) Infection prevalence estimates by age group from 6 January to 12 July 2021 estimated using a Bayesian P-spline model fit to all 13 rounds of REACT-1 (only shown for rounds 8–13) assuming a constant second-order random-walk prior distribution (value set to estimate from national model fit). All estimates of infection prevalence are shown with a central estimate (solid line) and 50% credible interval (shaded region). Full data and 95% credible intervals are shown in supplementary Figs 1 and 2. Dashed lines show the date of key restriction changes in England. (C) The inferred date of minimum prevalence from 6 January to 12 July 2021 for all models fit to national prevalence (green), regional prevalence (blue) and prevalence by age group (red) with median (point) and 95% credible intervals (line) shown.
Fig 3
Fig 3. Trends in the time-varying reproduction number.
Rolling two-week average (averaged over prior two weeks) reproduction number as inferred from the Bayesian P-spline model fit to all data assuming a gamma distributed generation time with shape parameter = 2.29, and rate parameter = 0.36. Estimates of the reproduction number are shown with a central estimate (solid line) and 50% (dark shaded region) and 95% (light shaded region) credible intervals. The red line shows the probability that R>1 over time. Vertical dashed lines show the dates of key changes in restrictions. Horizontal dashed line shows R = 1 the threshold for epidemic growth.
Fig 4
Fig 4. Trends in the instantaneous growth rate by age group.
Instantaneous growth rate as inferred from the Bayesian P-spline models fit to data for each age group. Estimates of the instantaneous growth rate are shown with a central estimate (solid line) and 50% (dark shaded region) and 95% (light shaded region) credible intervals. Estimates are colored by whether their value is greater than 0 (red) or less than 0 (green). Vertical dashed lines show the dates of key changes in restrictions. The horizontal dashed line shows growth rate = 0 the threshold for epidemic growth. The right hand axis gives the corresponding doubling / halving times for a given growth rate.
Fig 5
Fig 5. Estimated discrete changes in the reproduction number.
(A) Inferred R over time (black line, left-axis) from the segmented-exponential model fit to rounds 8 to 13 of REACT-1. Also shown is the multiplicative growth in R due to each step change in restrictions (points, right-axis) and their 95% credible intervals (error bars). (B) Inferred R over time (red, left-axis) from the segmented-exponential model including vaccine and Delta fixed effects fit to rounds 8 to 13 of REACT-1. Also shown is the intrinsic R (R if vaccine and Delta effects excluded) over time (blue, right-axis). All estimates of R are shown with a central estimate (solid line) and 50% (dark shaded region) and 95% (light shaded region) credible intervals. Vertical dashed lines show the dates of key changes in restrictions. Horizontal dashed line shows R = 1 the threshold for epidemic growth.

References

    1. Guzzetta G, Riccardo F, Marziano V, Poletti P, Trentini F, Bella A, et al.. Impact of a Nationwide Lockdown on SARS-CoV-2 Transmissibility, Italy. Emerg Infect Dis. 2021;27. doi: 10.3201/eid2701.202114 - DOI - PMC - PubMed
    1. Inglesby TV. Public Health Measures and the Reproduction Number of SARS-CoV-2. JAMA. 2020;323: 2186–2187. doi: 10.1001/jama.2020.7878 - DOI - PubMed
    1. Knock ES, Whittles LK, Lees JA, Perez-Guzman PN, Verity R, FitzJohn RG, et al.. Key epidemiological drivers and impact of interventions in the 2020 SARS-CoV-2 epidemic in England. Sci Transl Med. 2021;13. doi: 10.1126/scitranslmed.abg4262 - DOI - PMC - PubMed
    1. Vlachos J, Hertegård E, B Svaleryd H. The effects of school closures on SARS-CoV-2 among parents and teachers. Proc Natl Acad Sci U S A. 2021;118. doi: 10.1073/pnas.2020834118 - DOI - PMC - PubMed
    1. Voysey M, Clemens SAC, Madhi SA, Weckx LY, Folegatti PM, Aley PK, et al.. Safety and efficacy of the ChAdOx1 nCoV-19 vaccine (AZD1222) against SARS-CoV-2: an interim analysis of four randomised controlled trials in Brazil, South Africa, and the UK. Lancet. 2021;397: 99–111. doi: 10.1016/S0140-6736(20)32661-1 - DOI - PMC - PubMed

Publication types

LinkOut - more resources