. 2022 Nov 23;14(672):eabp8309.
doi: 10.1126/scitranslmed.abp8309. Epub 2022 Nov 23.

CD47-SIRPα axis blockade in NASH promotes necroptotic hepatocyte clearance by liver macrophages and decreases hepatic fibrosis

Affiliations

CD47-SIRPα axis blockade in NASH promotes necroptotic hepatocyte clearance by liver macrophages and decreases hepatic fibrosis

Hongxue Shi et al. Sci Transl Med. .

Abstract

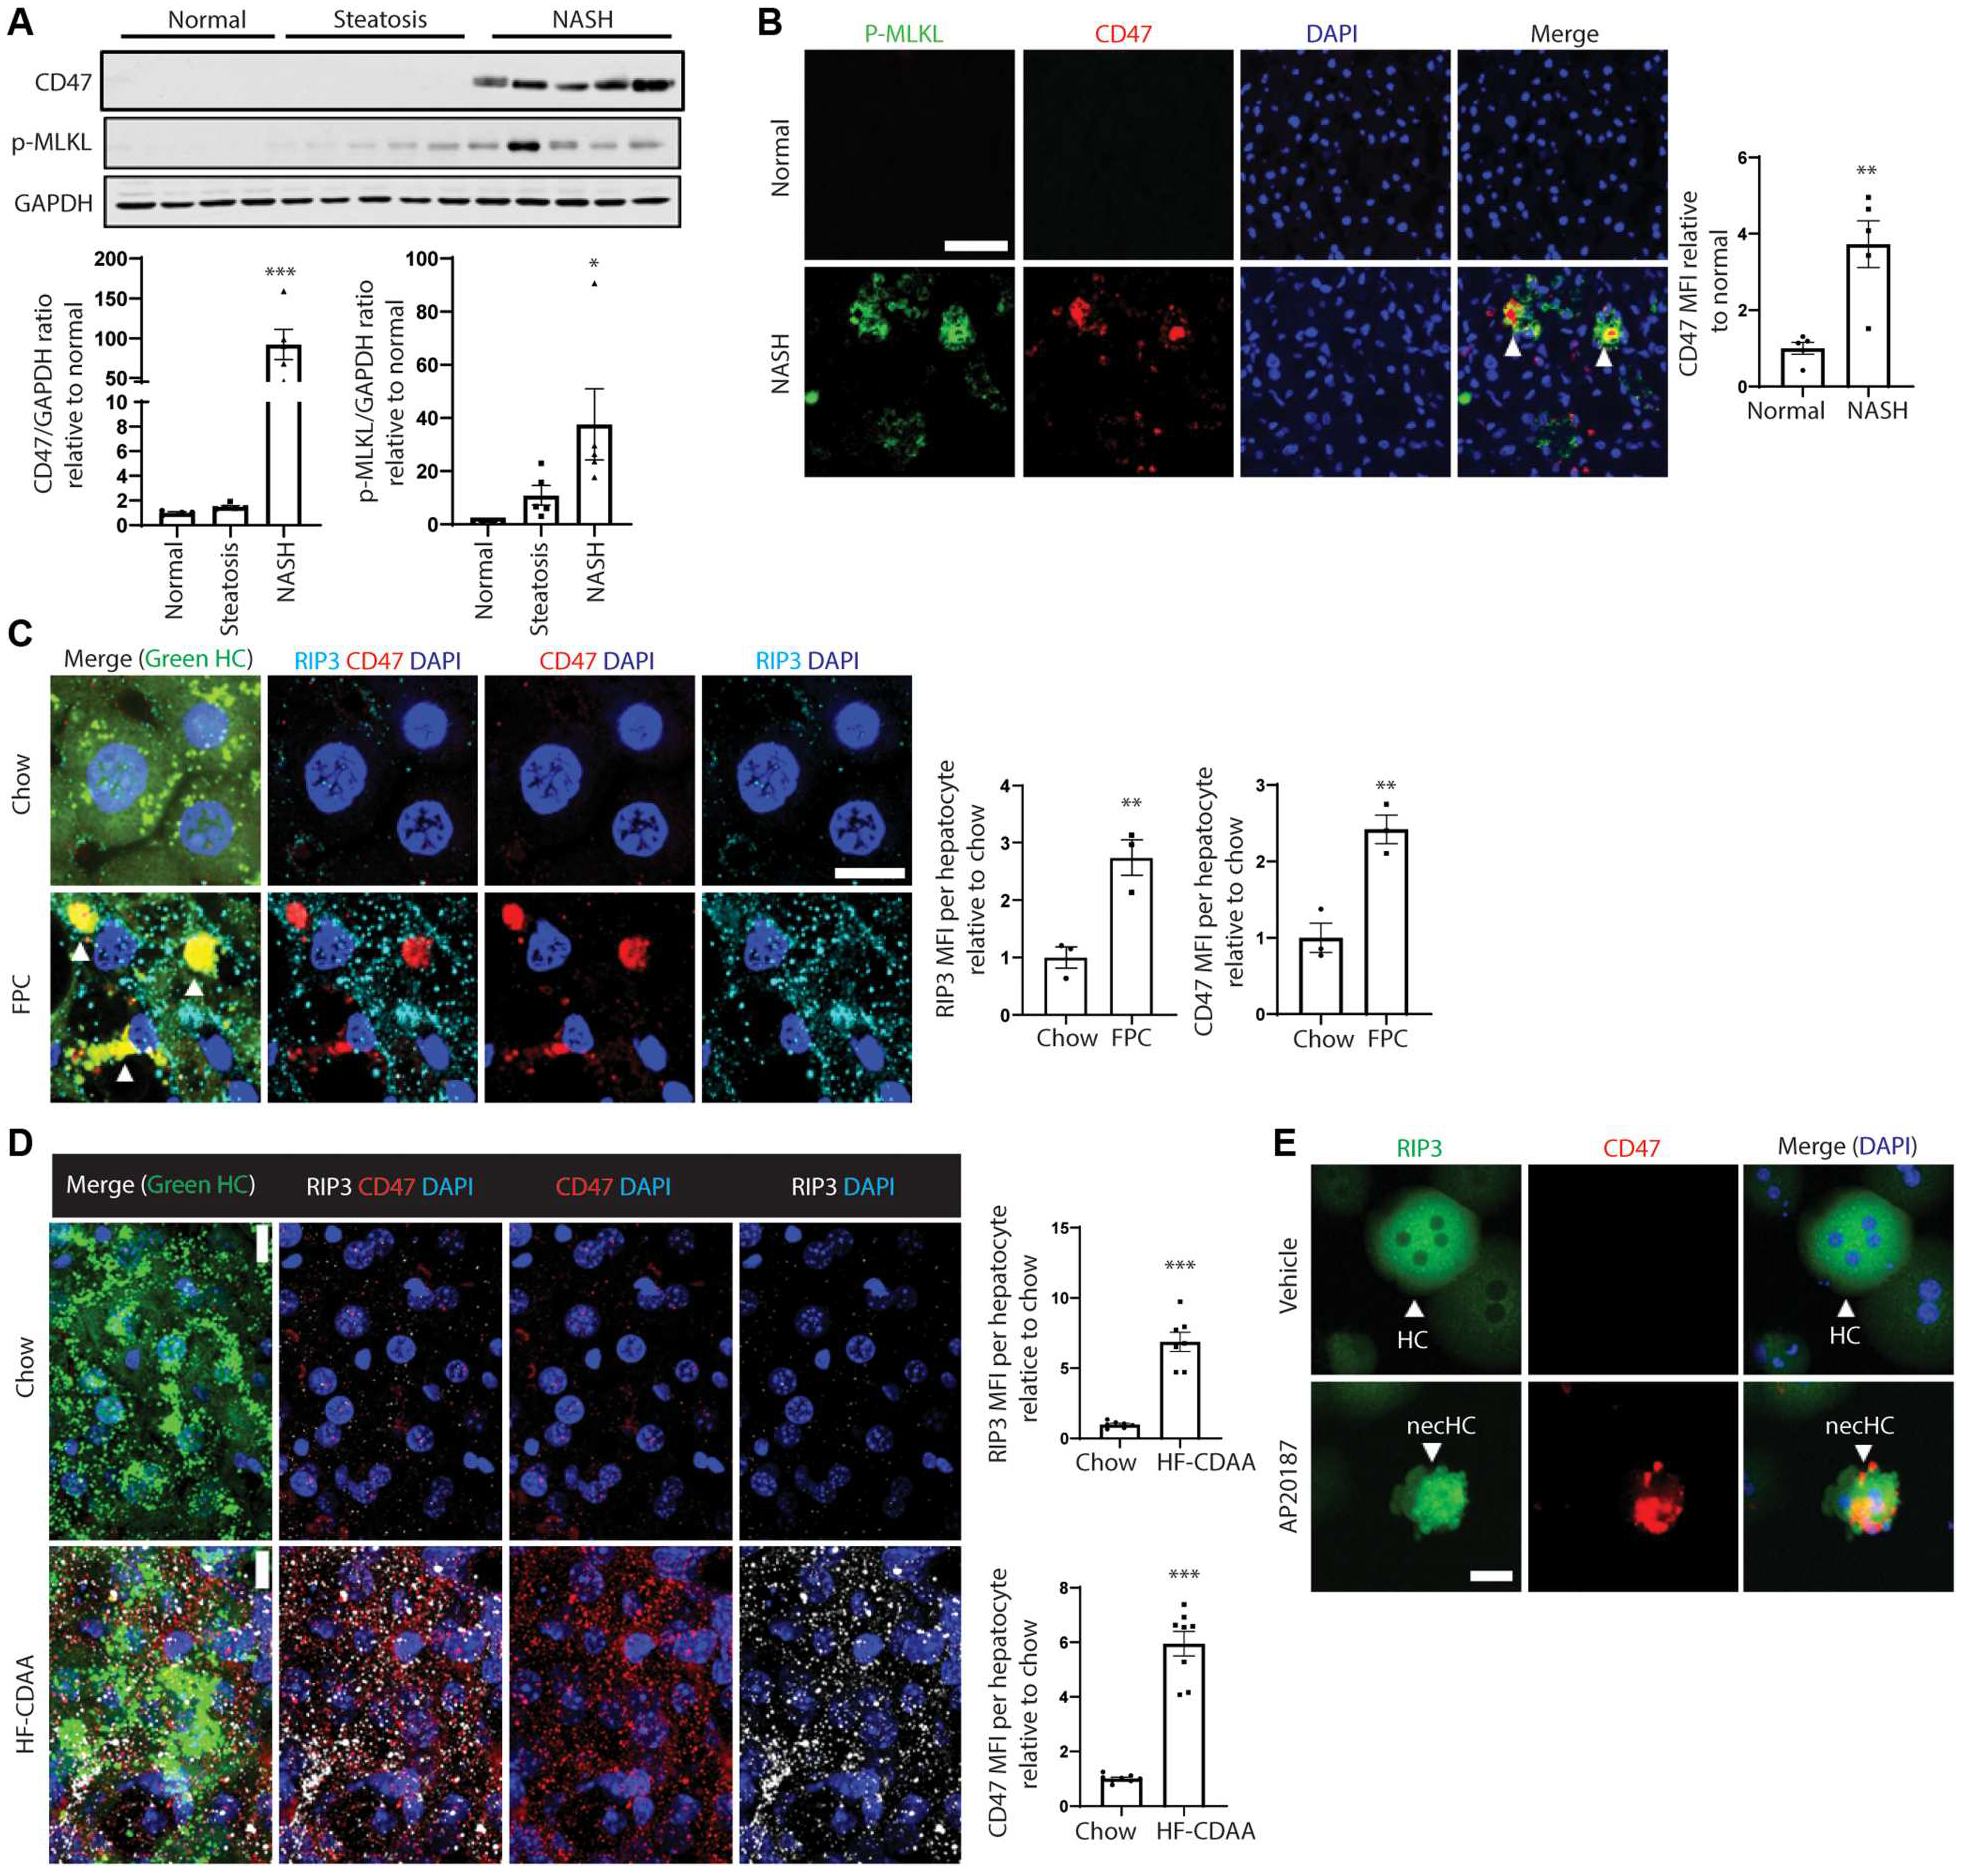
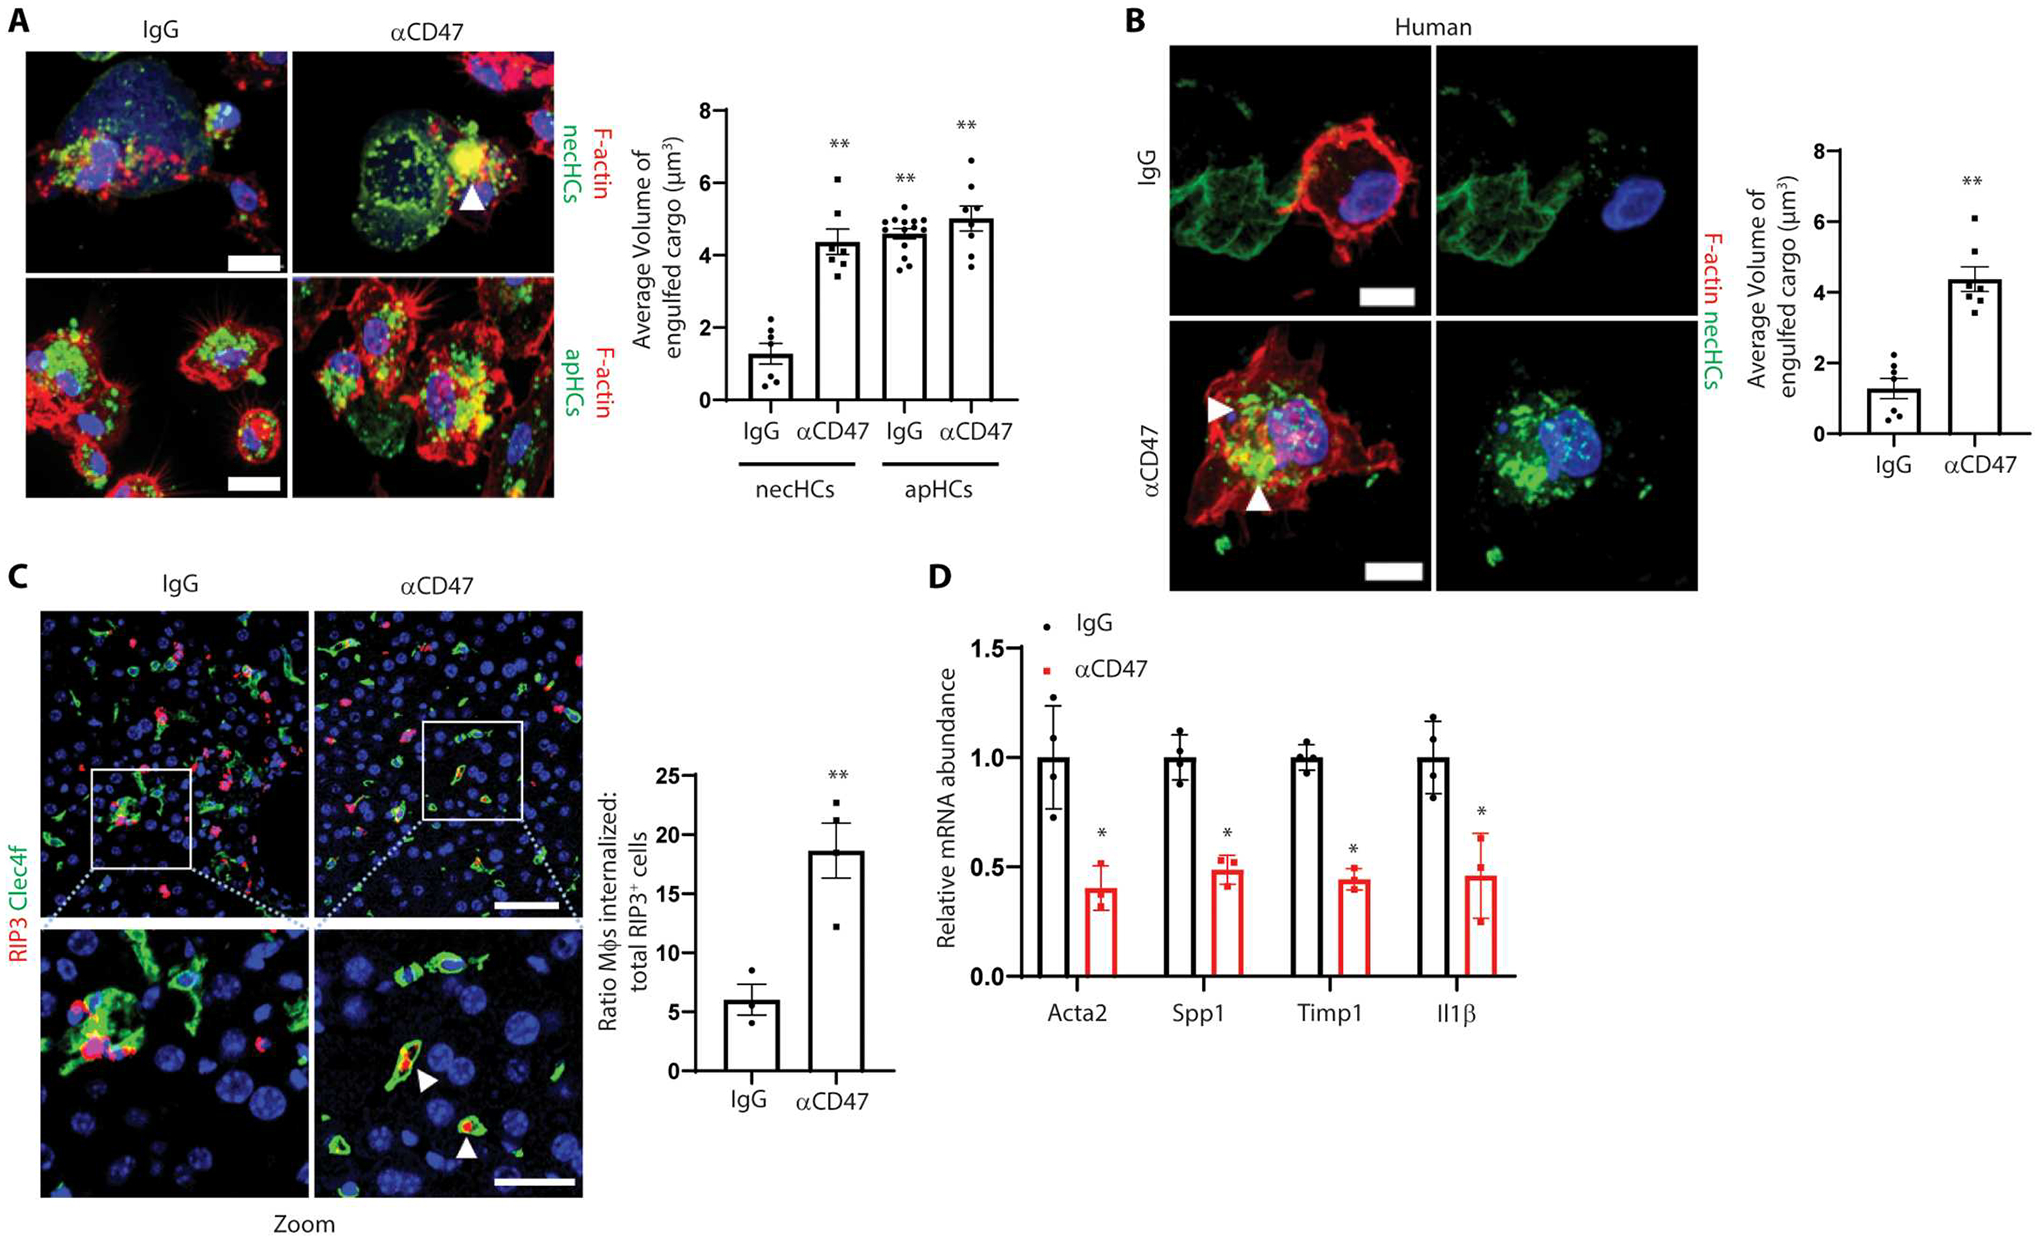
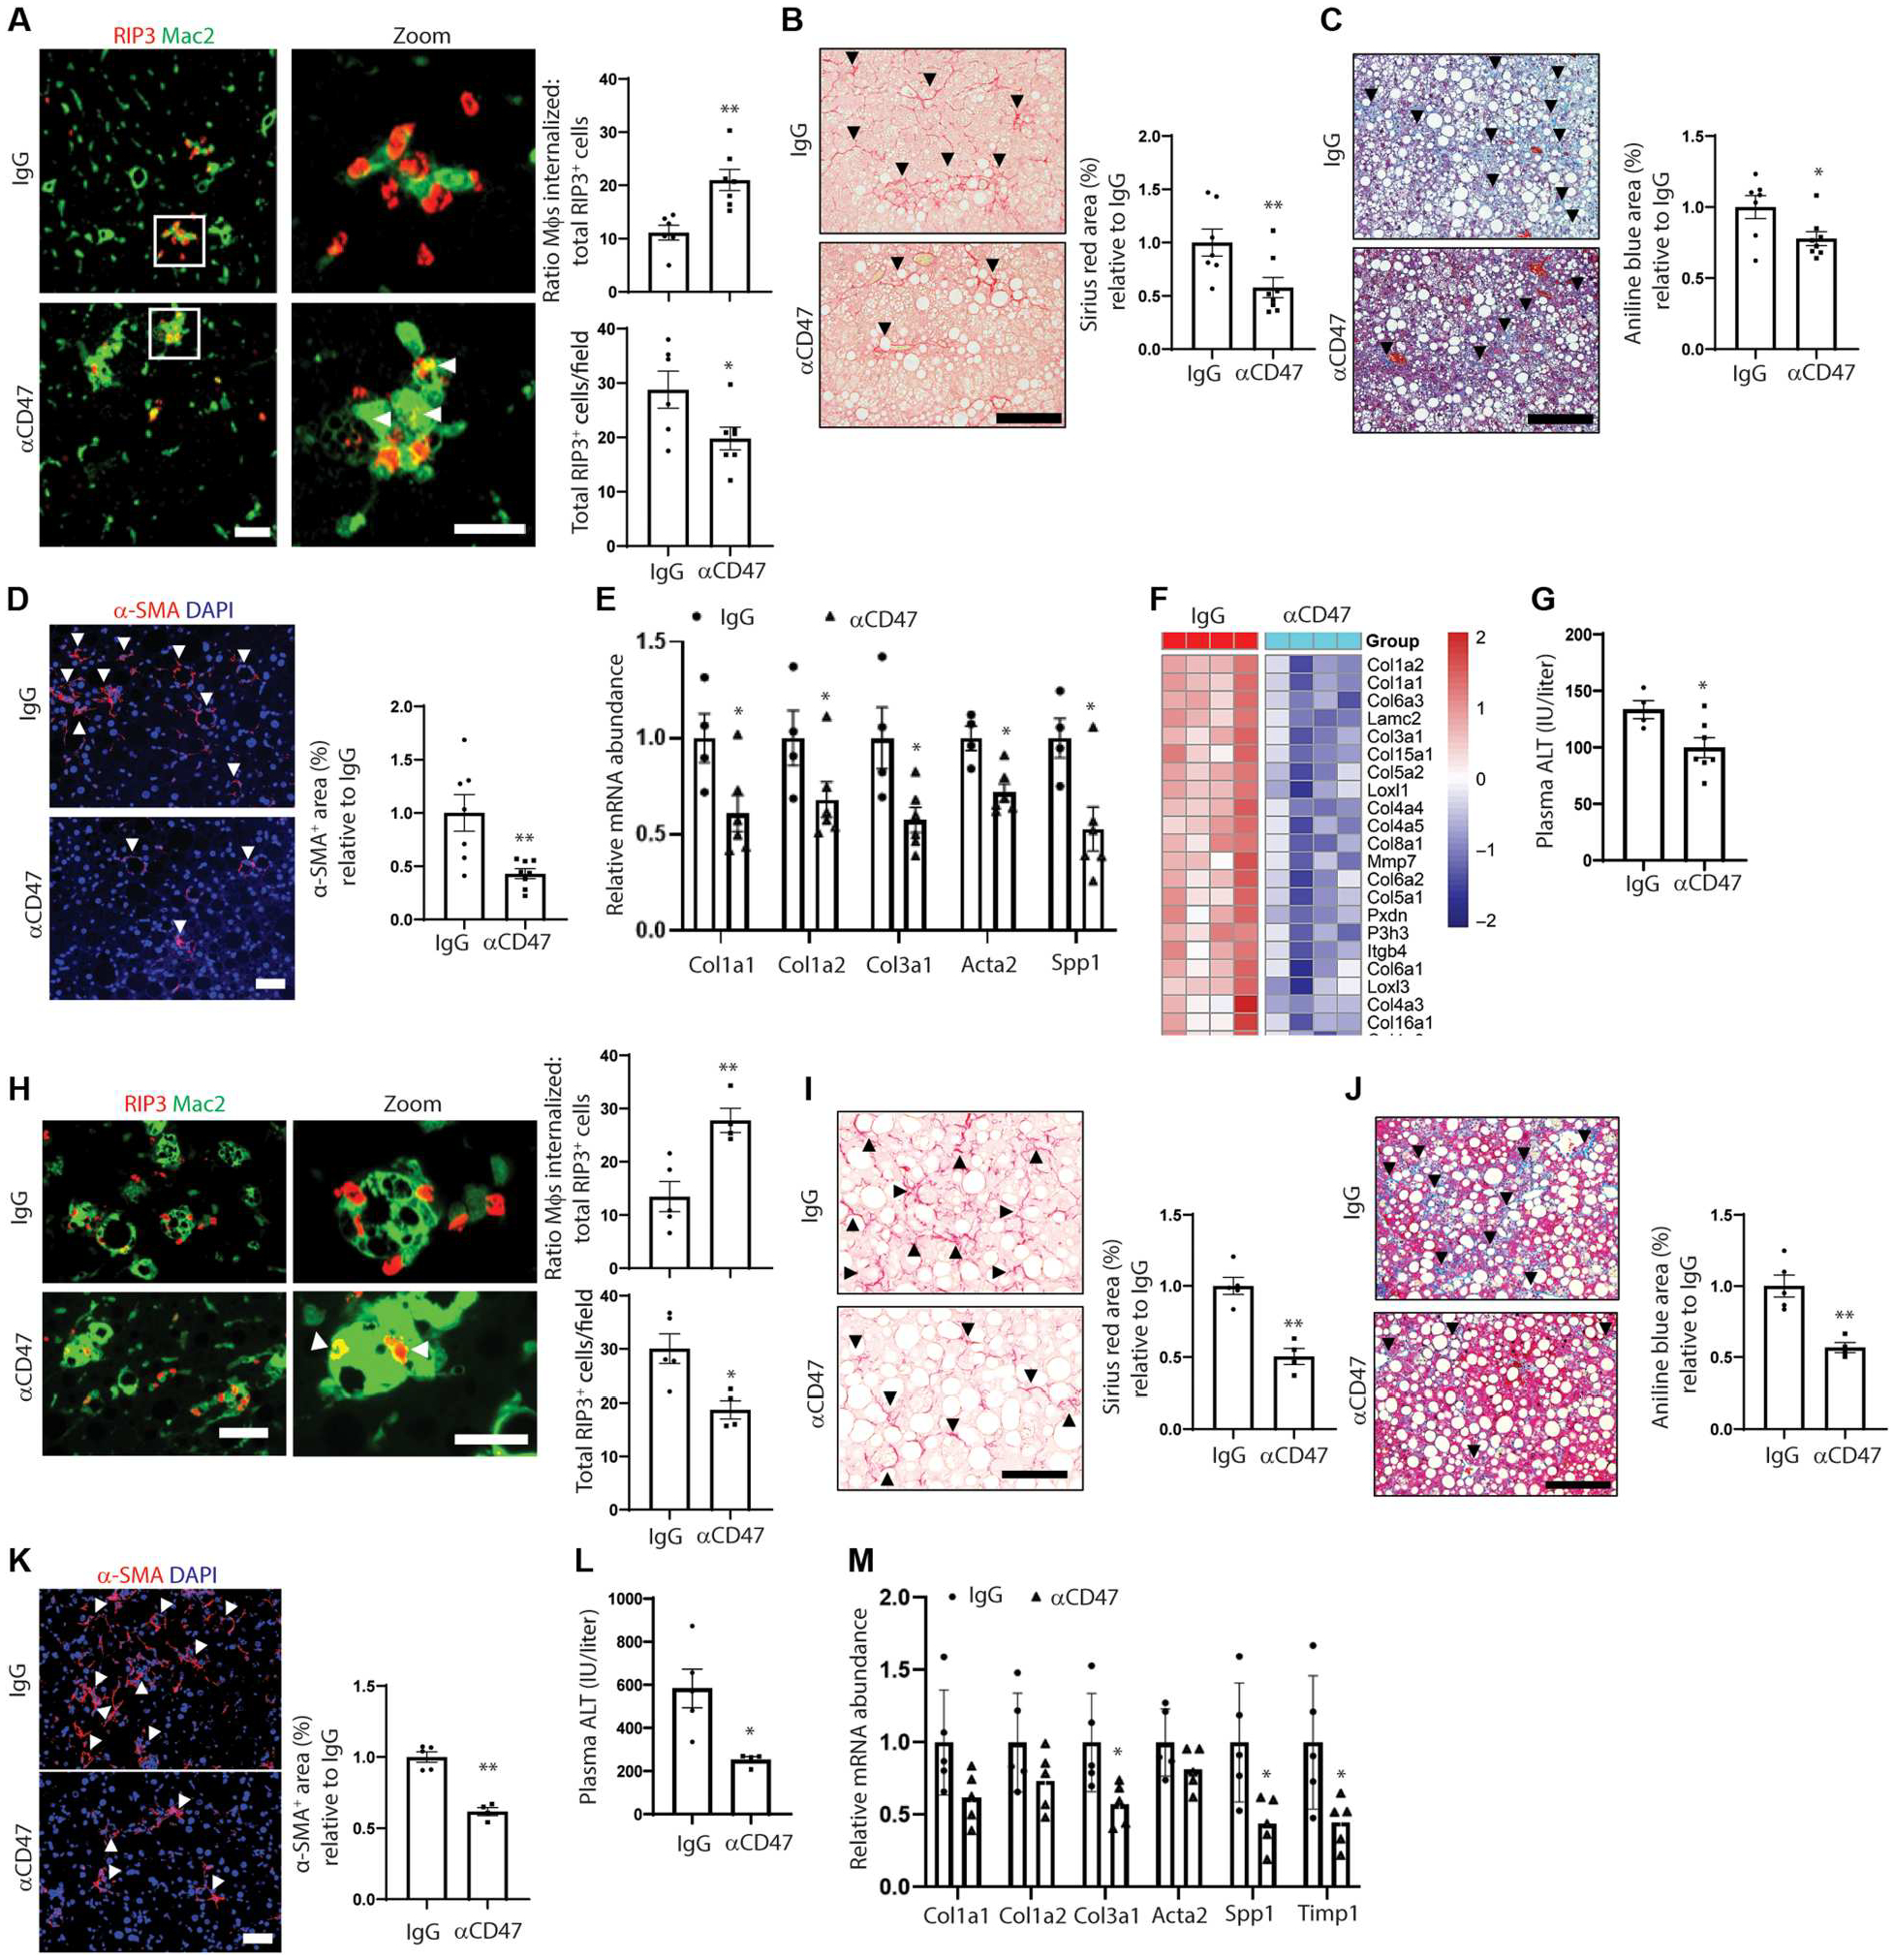
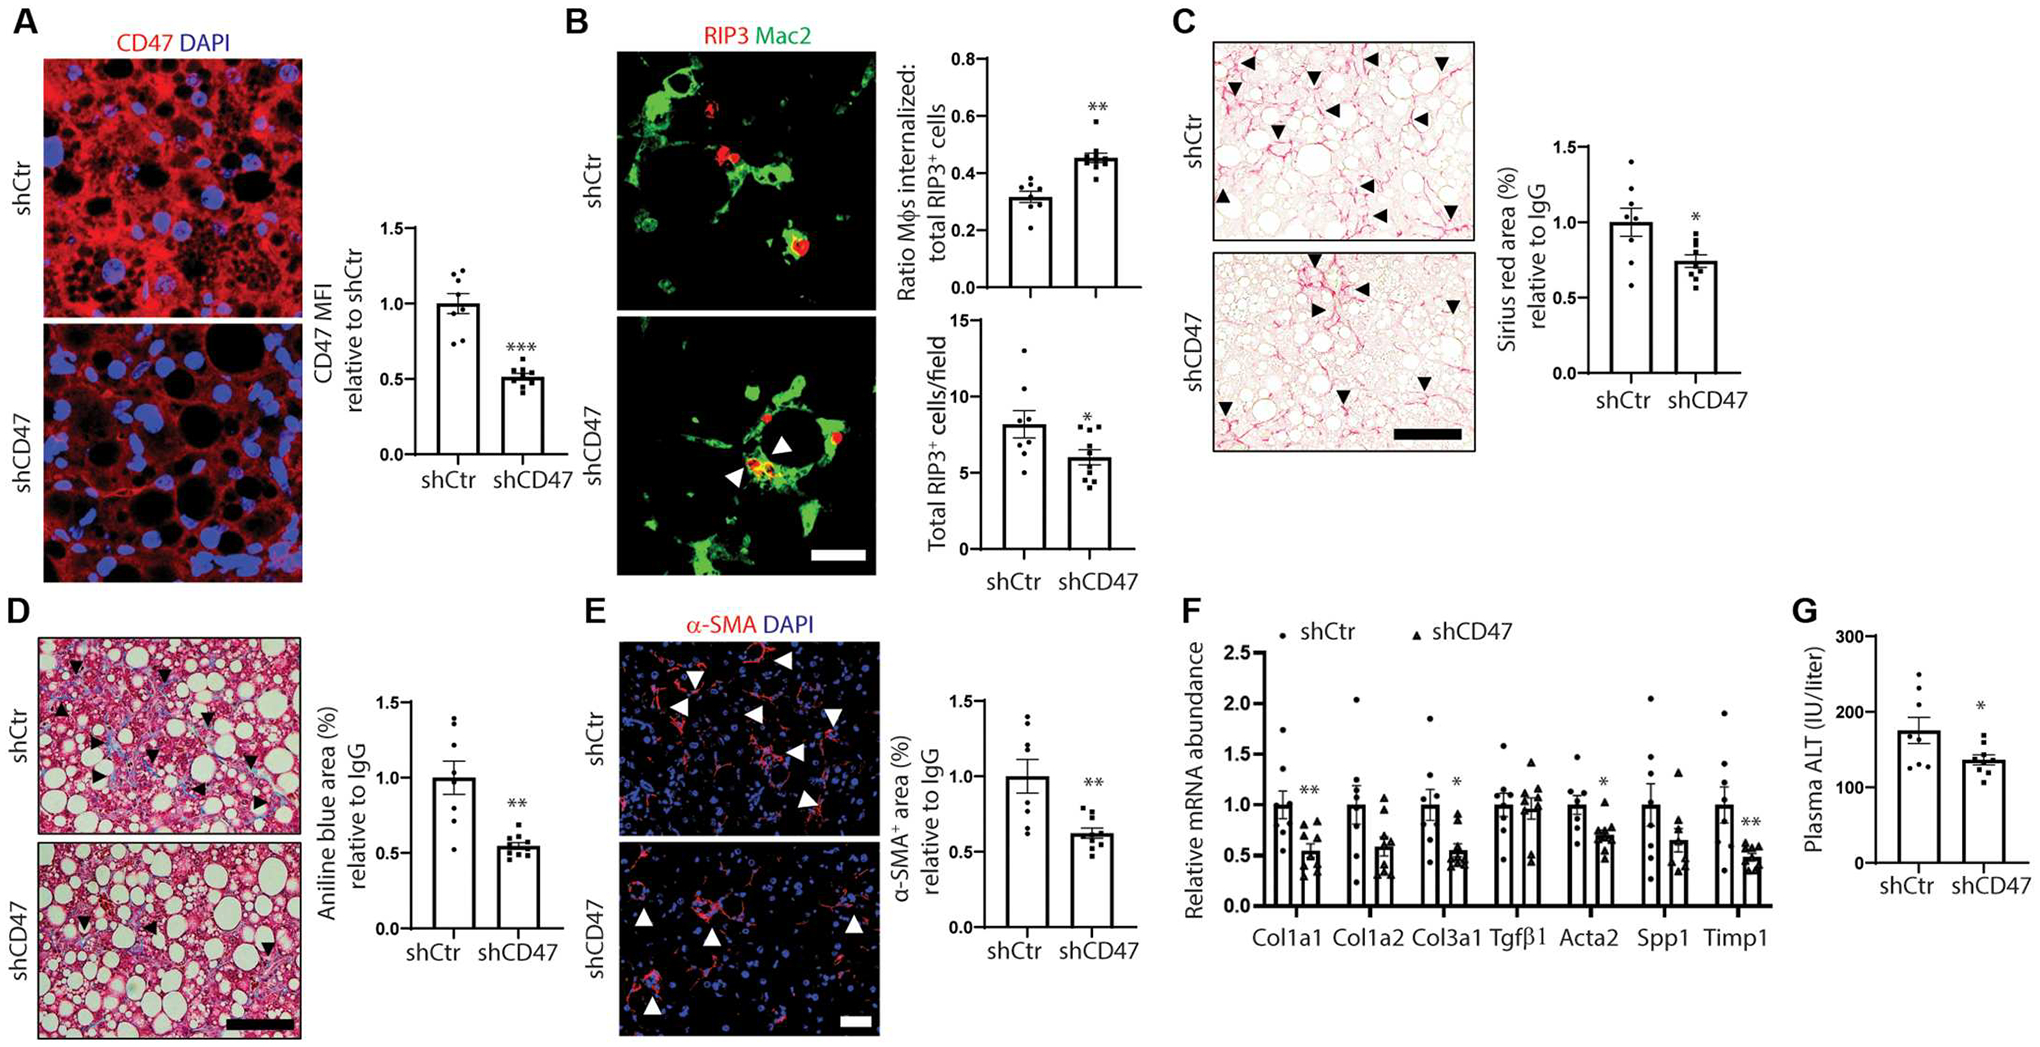
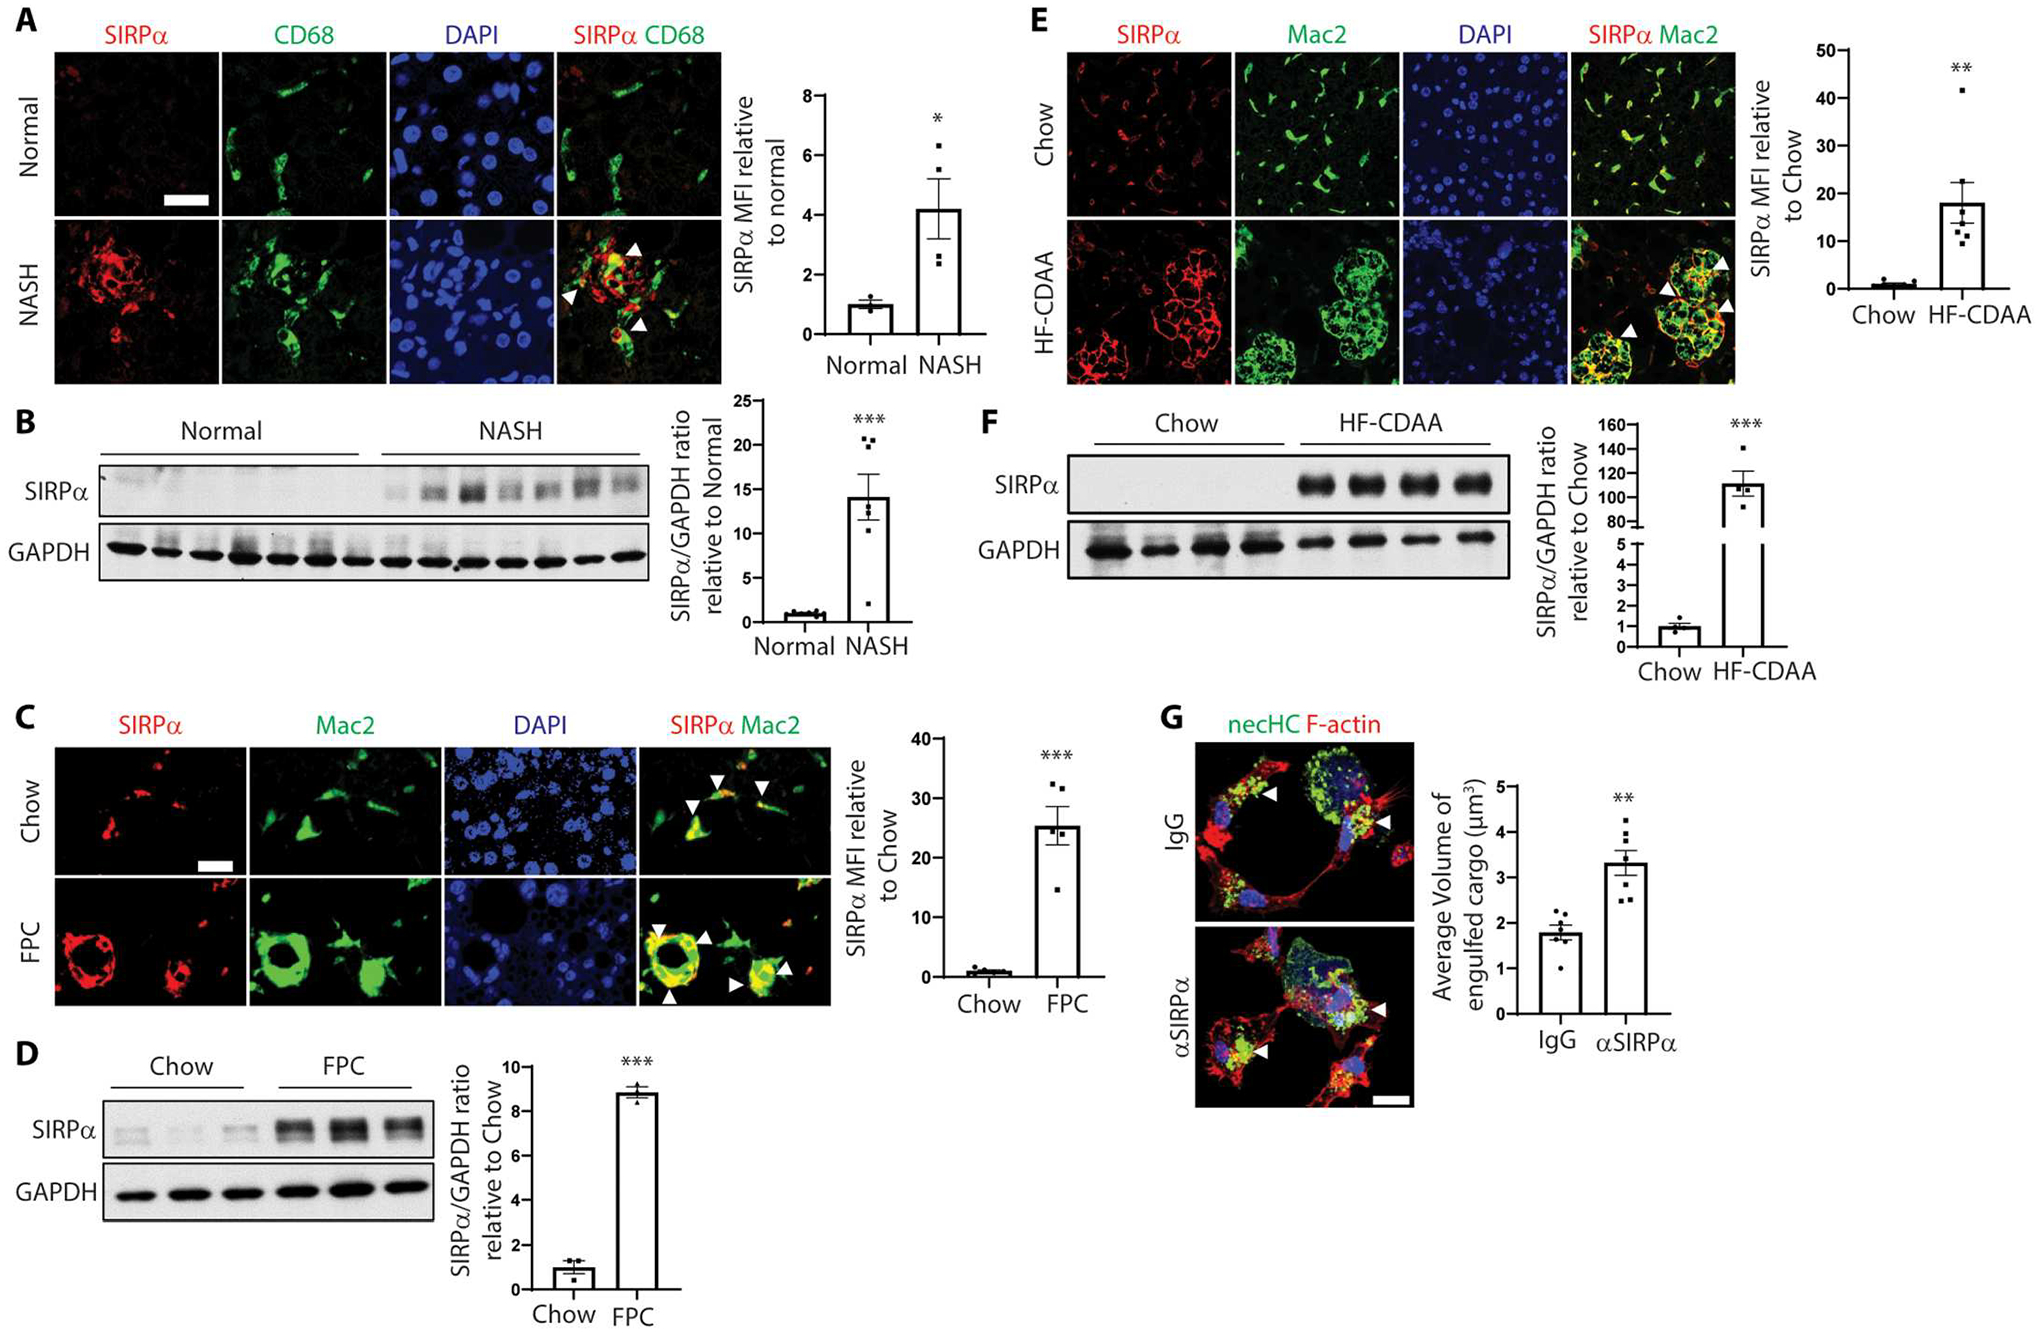
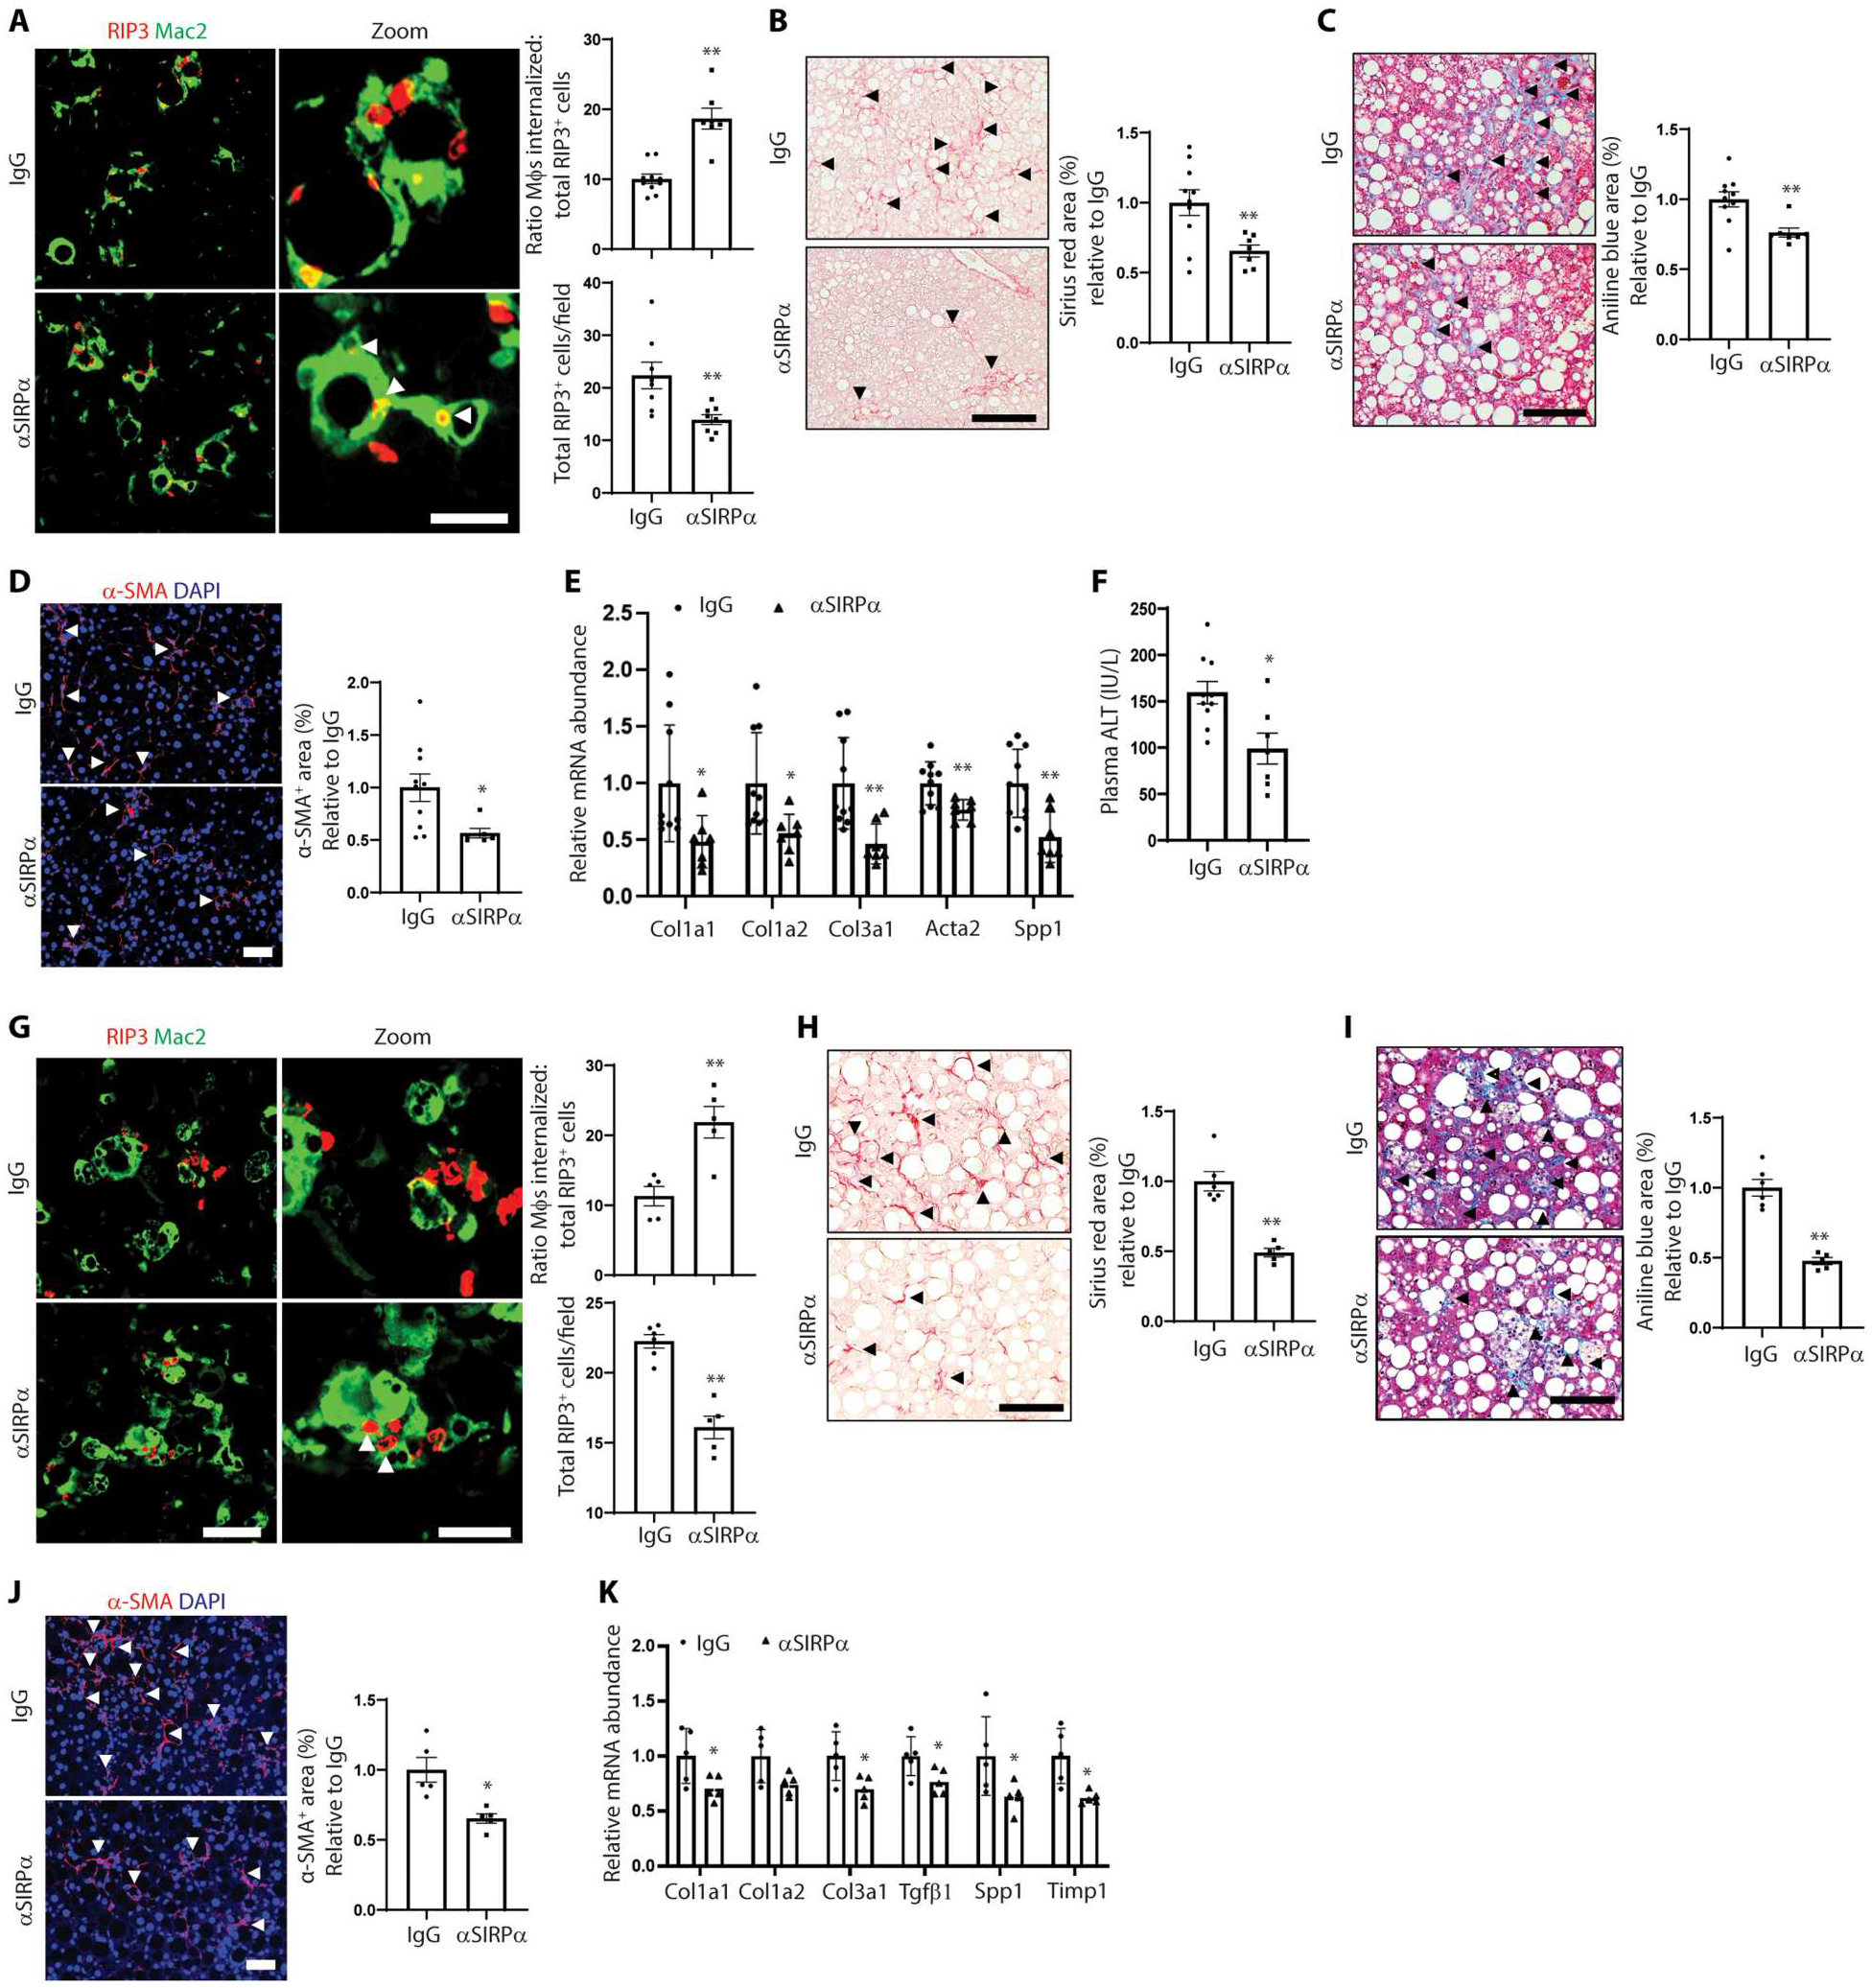
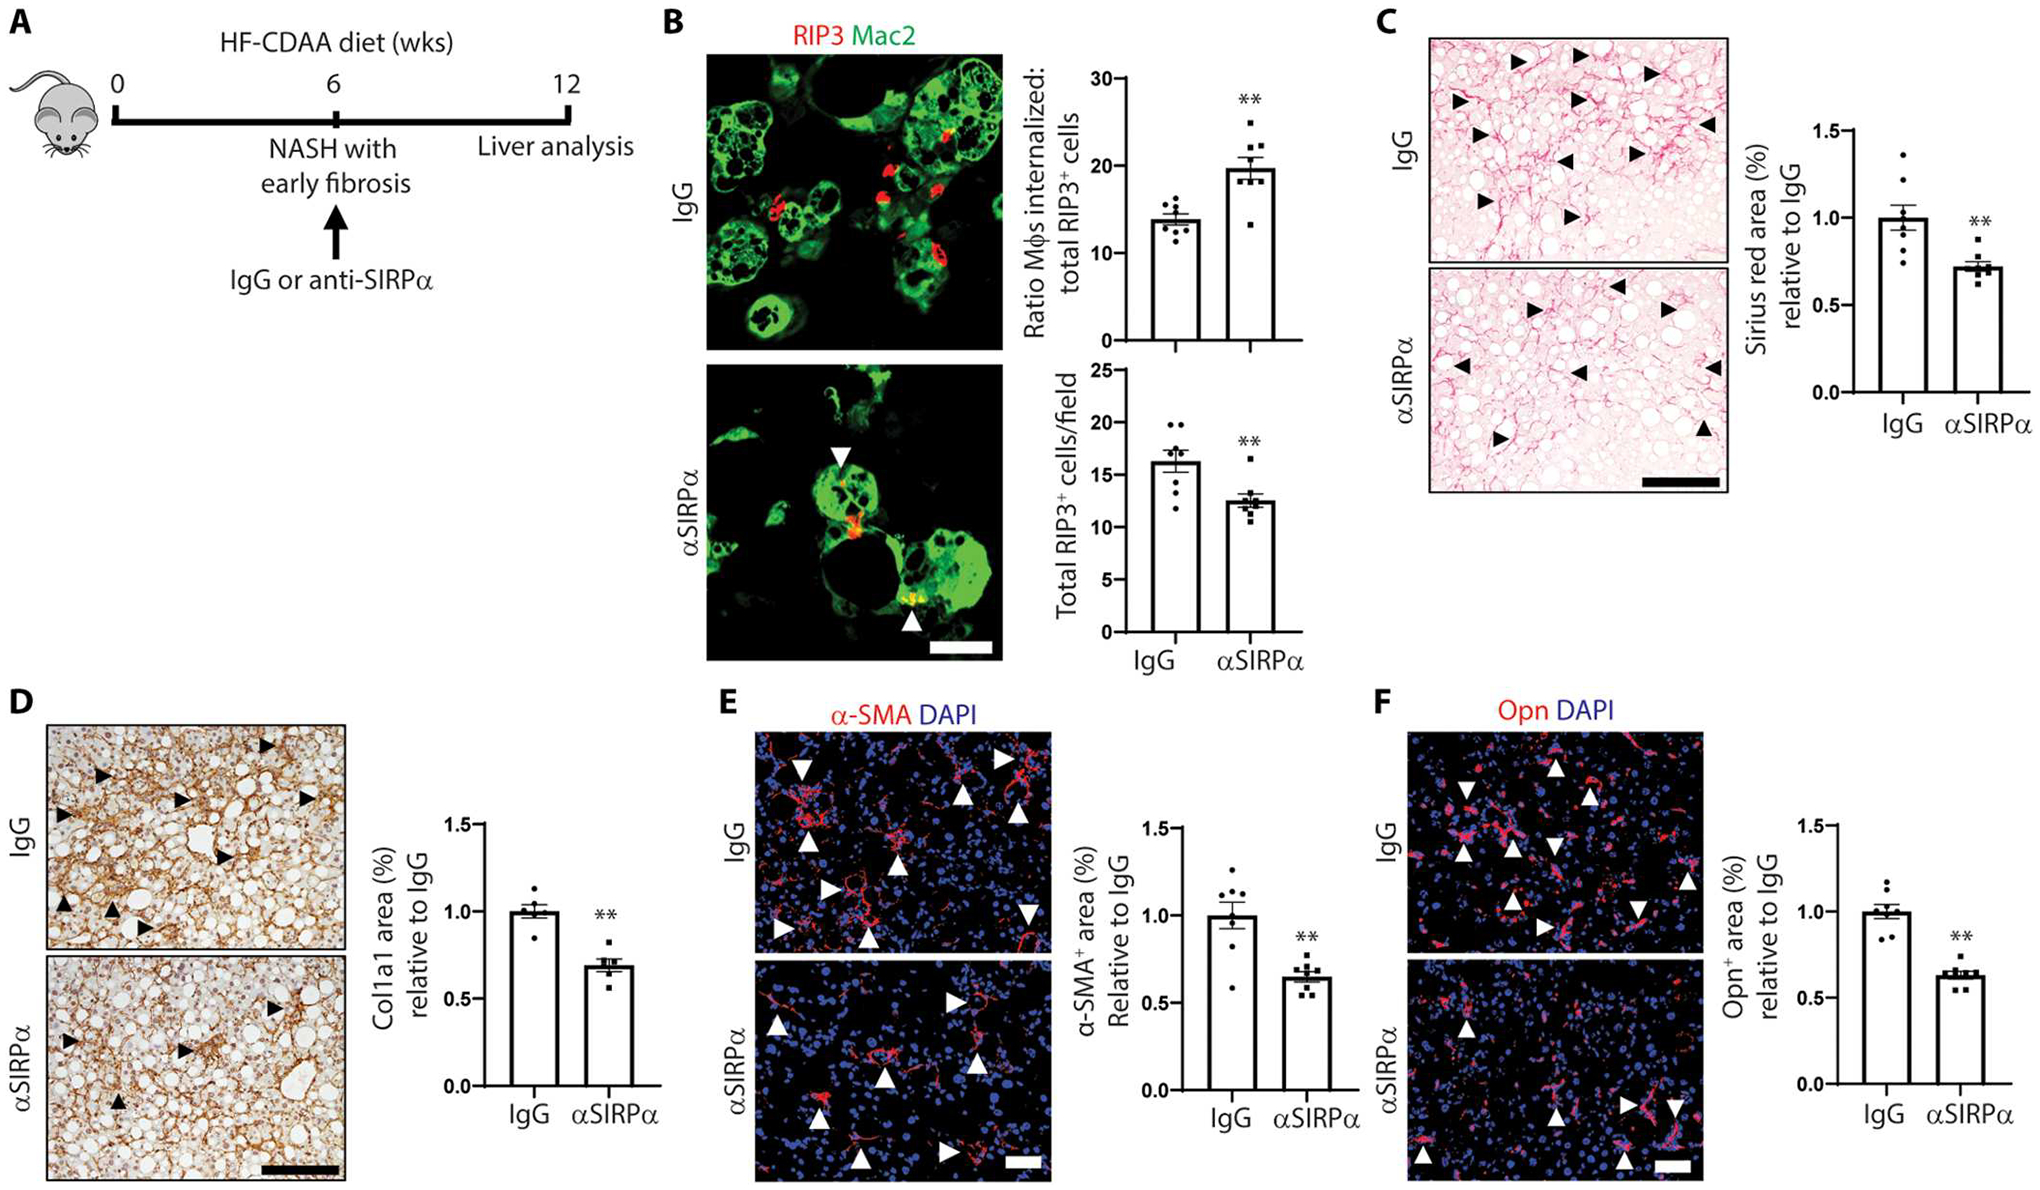
Necroptosis contributes to hepatocyte death in nonalcoholic steatohepatitis (NASH), but the fate and roles of necroptotic hepatocytes (necHCs) in NASH remain unknown. We show here that the accumulation of necHCs in human and mouse NASH liver is associated with an up-regulation of the "don't-eat-me" ligand CD47 on necHCs, but not on apoptotic hepatocytes, and an increase in the CD47 receptor SIRPα on liver macrophages, consistent with impaired macrophage-mediated clearance of necHCs. In vitro, necHC clearance by primary liver macrophages was enhanced by treatment with either anti-CD47 or anti-SIRPα. In a proof-of-concept mouse model of inducible hepatocyte necroptosis, anti-CD47 antibody treatment increased necHC uptake by liver macrophages and inhibited markers of hepatic stellate cell (HSC) activation, which is responsible for liver fibrogenesis. Treatment of two mouse models of diet-induced NASH with anti-CD47, anti-SIRPα, or AAV8-H1-shCD47 to silence CD47 in hepatocytes increased the uptake of necHC by liver macrophages and decreased markers of HSC activation and liver fibrosis. Anti-SIRPα treatment avoided the adverse effect of anemia found in anti-CD47-treated mice. These findings provide evidence that impaired clearance of necHCs by liver macrophages due to CD47-SIRPα up-regulation contributes to fibrotic NASH, and suggest therapeutic blockade of the CD47-SIRPα axis as a strategy to decrease the accumulation of necHCs in NASH liver and dampen the progression of hepatic fibrosis.


Conflict of interest statement

Competing interests: The authors declare that they have no competing interests.

Figures

Fig. 1.
Fig. 1.. CD47 + necHCs are increased in human and mouse NASH.
(A) Immunoblots of CD47 and p-MLKL in normal (n = 4), steatotic (n = 5), and NASH (n = 5) human livers, with data quantification (*P < 0.05; **P < 0.01 versus normal). (B) Immunofluorescence staining of human normal and NASH liver sections using anti–p-MLKL (green) and anti-CD47 (red). Arrowheads indicate p-MLKL and CD47 colocalization. Scale bar, 50 μm (**P < 0.01, n = 5 per group). (C) Male ZsGreen-inducible mice were injected with AAV8-TBG-Cre to label hepatocytes and were then fed the FPC NASH diet for 12 weeks. Liver sections (100 μm thickness) were immunostained with anti-CD47 (red) and anti-RIP3 (white). The green channel, which identifies hepatocytes, is shown in the merge image. Arrowheads indicate RIP3-CD47 colocalization. Scale bar, 10 μm. Data were quantified as mean fluorescence intensity (MFI) of CD47 and RIP3 per hepatocyte (**P < 0.01, n = 3 biological replicate hepatocytes per group). (D) Similar to (C), but the mice were fed the HF-CDAA diet for 4 weeks. Scale bar, 10 μm. ***P < 0.001, n = 7 to 8 biological replicate hepatocytes per group. (E) Primary hepatocytes isolated from AAV8-TBG-mRIP3-2xFV–injected mice were treated with vehicle control or AP20187 treatment (10 nM) to induce necroptosis ex vivo and then immunostained for RIP3 (green) and CD47 (red). Scale bar, 25 μm. necHC, necroptotic hepatocyte; HC, live hepatocyte. For all images, nuclei are stained with 4’,6-diamidino-2-phenylindole (DAPI; blue). All data are means ± SEM.
Fig. 2.
Fig. 2.. Blocking CD47 increases necHC uptake by liver macrophages and blocks markers of HSC activation in a mouse model of hepatocyte necroptosis.
(A) Representative images of primary mouse macrophages stained for F-actin (red) after exposure to mouse necHCs (green) or apoptotic hepatocytes (apHCs; green) in the presence of IgG or anti-CD47 for 5 hours. Scale bars, 10 μm. Arrowheads indicate large volume of engulfed cargo. The data were quantified as the average volume of engulfed cargo (**P < 0.01 versus IgG necHC group, n = 6 biological replicate cells per group). (B) Two representative images of F-actin–labeled primary human macrophages (red) after incubation with human necHCs (green) in the presence of IgG or anti-CD47 for 5 hours. Arrowheads indicate large volume of engulfed cargo. Scale bars, 10 μm. The data were quantified as the average volume of engulfed cargo (**P < 0.01, n = 7 cells per group). (C) Male C57BL/6J mice were injected with AAV8-TBG-mRIP3-2xFV virus, and 10 days later, they were administered AP20187 to induce hepatocyte necroptosis plus either 16 hours of IgG or anti-CD47 treatment. The top images show costaining of Kupffer cells (KCs) using anti-CLEC4F (green) and RIP3 (red) in liver sections. Scale bar, 50 μm. Zoom image areas in the white square are shown in the bottom panel. Arrowheads depict macrophages (Mϕs) with internalized necHCs. Scale bar, 25 μm. The data were quantified as the ratio of macrophage-internalized necHCs to total necHCs (**P < 0.01, n = 3 to 4 mice per group). (D) The livers from (C) were quantified for mRNAs related to HSC activation and liver fibrosis (*P < 0.05, n = 3 to 4 mice per group). For all images, nuclei are stained with DAPI (blue). All data are means ± SEM.
Fig. 3.
Fig. 3.. Anti-CD47 treatment increases necHC engulfment and mitigates hepatic fibrosis in experimental NASH.
(A to G) Male C57BL/6J mice were fed the FPC NASH diet for 16 weeks and treated with IgG or anti-CD47 between weeks 8 and 16 (n = 7 to 8 mice per group). (A) Representative images of liver sections immunostained with anti-Mac2 to stain macrophages (green) and anti-RIP3 (red). Scale bar, 50 μm. Zoom images of the areas in the white square are shown in the right panel. Arrowheads depict macrophages with internalized necHCs. Scale bar, 25 μm. The data were quantified as the ratio of macrophage-internalized necHCs to total necHCs and total RIP3+ cells (*P < 0.05; **P < 0.01). (B) Staining and quantification of picrosirius red–positive area (arrowheads) (*P < 0.05). Scale bar, 100 μm. (C) Trichrome-stained images, with quantification of aniline blue–positive area, indicated by arrowheads (*P < 0.05). Scale bar, 100 μm. (D) Immunofluorescence staining and quantification of α-SMA–positive area (arrowheads) (**P < 0.01). Scale bar, 50 μm. (E) Quantification of mRNAs related to HSC activation and liver fibrosis (*P < 0.05) (n=4 to 7 mice). (F) Heatmap of genes involved in collagen formation in IgG versus anti-CD47 cohorts (n = 4 mice per group). (G) Plasma ALT activity (*P < 0.05) (n=4 to 7 mice). (H to L) Male C57BL/6J mice were fed the HF-CDAA NASH diet for 8 weeks and treated with IgG or anti-CD47 between 2 and 8 weeks (n = 4 to 5 mice per group). (H) Representative images of liver sections immunostained with anti-Mac2 to stain macrophages (green) and RIP3 (red) in liver sections. Scale bar, 100 μm. Zoom images of the areas in the white square are shown in the right panel. Arrowheads depict macrophages with internalized necHCs. Scale bar, 25 μm. The data were quantified as the ratio of macrophage-internalized necHCs to total necHCs and total RIP3+ cells (*P < 0.05; **P < 0.01). (I) Staining and quantification of picrosirius red–positive area (arrowheads) (*P < 0.05). Scale bar, 100 μm. (J) Trichrome-stained images, with quantification of aniline blue–positive area, indicated by arrowheads (**P < 0.01). Scale bar, 100 μm. (K) Immunofluorescence staining and quantification of α-SMA–positive area (arrowheads) (**P < 0.01). Scale bar, 50 μm. (L) Plasma ALT activity (*P < 0.05). (M) Mice were fed the HF-CDAA NASHdiet for 4 weeks and treated with IgG or anti-CD47 between weeks 2 and 4, followed by quantification of mRNAs related to HSC activation and liver fibrosis (*P < 0.05, n = 5 mice per group). All data are means ± SEM.
Fig. 4.
Fig. 4.. Hepatocyte CD47 silencing promotes necHC engulfment and attenuates hepatic fibrosis in experimental NASH.
Male C57BL/6J mice were fed the FPC NASH diet for 16 weeks and treated with AAV8-H1-shControl (shCtr) or AAV8-H1-shCD47 (shCD47) between weeks 8 and 16 (n = 8 to 10 mice per group). (A) Relative hepatocyte CD47 MFI. Scale bar, 25 μm. (B) Representative images of liver sections immunostained with anti-Mac2 to stain macrophages (green) and anti-RIP3 (red). Scale bar, 50 μm. Arrowheads depict macrophages with internalized necHCs. The data were quantified as the ratio of macrophage-internalized necHCs to total necHCs and total RIP3+ cells (*P < 0.05; **P < 0.01). (C) Staining and quantification of picrosirius red–positive area (arrowheads) (*P < 0.05). Scale bar, 50 μm. (D) Trichrome-stained images, with quantification of aniline blue–positive area, indicated by arrowheads (*P < 0.05). Scale bar, 50 μm. (E) Immunofluorescence staining and quantification of α-SMA–positive area (arrowheads) (**P < 0.01). Scale bar, 50 μm. (F) Quantification of mRNAs related to HSC activation and liver fibrosis (*P < 0.05). (G) Plasma ALT activity (*P < 0.05).
Fig. 5.
Fig. 5.. SIRPα+ macrophages are increased in human and mouse NASH.
(A) Immunofluorescence staining of SIRPα (red) and CD68+ macrophage (green) in human normal or NASH liver sections. Arrowheads indicate SIRPα-macrophage colocalization. Scale bar, 25 μm. The data were quantified as MFI of SIRPα relative to the normal liver group (*P < 0.05, n = 4 per group). (B) Immunoblots of SIRPα in human livers of normal or patients with NASH, with data quantification (***P < 0.001, n = 7 livers per group). (C) Immunofluorescence staining of SIRPα (red) and Mac2+ macrophages (green) in liver sections from 16-week FPC-fed mice. Arrowheads indicate SIRPα-macrophage colocalization. Scale bar, 25 μm. The data were quantified as relative SIRPα MFI (***P < 0.001, n = 5 mice per group). (D) Immunoblots of SIRPα in livers from chow-fed or 16-week FPC-fed mice, with data quantification (***P < 0.001, n = 3 mice per group). (E) Immunofluorescence staining of SIRPα (red) and Mac2+ macrophages (green) in liver sections of 12-week HF-CDAA–fed mice. Arrowheads indicate SIRPα-macrophage colocalization. Scale bar, 50 μm. The data were quantified as SIRPα MFI (**P < 0.01, n = 5 mice per group). (F) Immunoblots of SIRPα in livers from chow-fed or 12-week HF-CDAA–fed mice, with data quantification (***P < 0.001, n = 4 mice per group). (G) Representative images of primary mouse macrophages stained for F-actin (red) after exposure to mouse necHCs (green) in the presence of IgG or anti-SIRPα. Scale bar, 10 μm. Arrowheads indicate large volume of engulfed cargo. The data were quantified as the average volume of engulfed cargo (**P < 0.01 versus IgG necHC group; n = 7 biological replicate cells per group). For all images, nuclei are stained with DAPI (blue). All data are means ± SEM.
Fig. 6.
Fig. 6.. Anti-SIRPα increases necHC engulfment and decreases hepatic fibrosis in experimental NASH.
(A to F) Male C57BL/6J mice were fed the FPC NASH diet for 16 weeks and treated with IgG or anti-SIRPα between weeks 8 and 16 (n = 7 to 10 mice per group). (A) Representative images of liver sections immunostained with anti-Mac2 to stain macrophages (green) and RIP3 (red) in liver sections. Scale bar, 50 μm. Zoom images of the areas in the white square are shown in the right panel. Arrowheads depict macrophages with internalized necHCs. Scale bar, 25 μm. The data were quantified as the ratio of macrophage-internalized necHCs to total necHCs and total RIP3+ cells (**P < 0.01). (B) Staining and quantification of picrosirius red–positive area (arrowheads) (**P < 0.01). Scale bar, 100 μm. (C) Trichrome-stained images, with quantification of aniline blue–positive area, indicated by arrowheads (*P < 0.05). Scale bar, 100 μm. (D) Immunofluorescence staining and quantification of α-SMA–positive area (arrowheads) (*P < 0.05). Scale bar, 50 μm. (E) Quantification of mRNAs related to HSC activation and liver fibrosis (*P < 0.05; **P < 0.01). (F) Plasma ALT activity (**P < 0.01). (G to J) Male C57BL/6J mice were fed the HF-CDAA NASH diet for 8 weeks and treated with IgG or anti-SIRPα between 2 and 8 weeks (n = 5 to 6 mice per group). (G) Representative images of liver sections immunostained with anti-Mac2 to stain macrophages (green) and RIP3 (red) in liver sections. Scale bar, 50 μm. Zoom images of the areas in the white square are shown in the right panel. Arrowheads depict macrophages with internalized necHCs. Scale bar, 25 μm. The data were quantified as the ratio of macrophage-internalized necHCs to total necHCs and total RIP3+ cells (**P < 0.01). (H) Staining and quantification of picrosirius red–positive area (arrowheads) (**P < 0.01). Scale bar, 100 μm. (I) Trichrome-stained images, with quantification of aniline blue–positive area, indicated by arrowheads (**P < 0.01). Scale bar, 100 μm. (J) Immunofluorescence staining and quantification of α-SMA–positive area (arrowheads) (*P < 0.05). Scale bar, 50 μm. (K) Mice were fed the HF-CDAA NASH diet for 4 weeks and treated with IgG or anti-SIRPα between weeks 2 and 4, followed by quantification of mRNAs related to HSC activation and liver fibrosis (*P < 0.05, n = 5 mice per group). All data are means ± SEM.
Fig. 7.
Fig. 7.. Anti-SIRPα increases necHC engulfment and ameliorates hepatic fibrosis in mice with established early NASH.
Male C57BL/6J mice were fed the HF-CDAA NASH diet for 12 weeks and treated with anti-SIRPα or IgG between weeks 6 and 12 (n = 6 to 8 mice per group). (A) Illustration of the experimental design. (B) Representative images of liver sections immunostained with anti-Mac2 to stain macrophages (green) and RIP3 (red) in liver sections. Arrowheads depict macrophages with internalized necHCs. Scale bar, 25 μm. The data were quantified as the ratio of macrophage-internalized necHCs to total necHCs and total RIP3+ cells (**P < 0.01). (C) Staining and quantification of picrosirius red–positive area (arrowheads) (**P < 0.01). Scale bar, 100 μm. (D) Liver sections immunostained with anti–collagen 1a1 (Col1a1), with quantification of Col1a1 area, indicated by arrowheads (**P < 0.01). Scale bar, 100 μm. (E) Immunofluorescence staining and quantification of α-SMA–positive area (arrowheads) (**P < 0.05). Scale bar, 50 μm. (F) Immunofluorescence staining and quantification of osteopontin (Opn)–positive area (arrowheads) (**P < 0.05). Scale bar, 50 μm. All data are means ± SEM.

References

    1. Younossi ZM, Non-alcoholic fatty liver disease—A global public health perspective. J. Hepatol 70, 531–544 (2019). - PubMed
    1. Riazi K, Azhari H, Charette JH, Underwood FE, King JA, Afshar EE, Swain MG, Congly SE, Kaplan GG, Shaheen AA, The prevalence and incidence of NAFLD worldwide: A systematic review and meta-analysis. Lancet Gastroenterol. Hepatol 7, 851–861 (2022). - PubMed
    1. Harrison SA, Gawrieh S, Roberts K, Lisanti CJ, Schwope RB, Cebe KM, Paradis V, Bedossa P, Aldridge Whitehead JM, Labourdette A, Miette V, Neubauer S, Fournier C, Paredes AH, Alkhouri N, Prospective evaluation of the prevalence of non-alcoholic fatty liver disease and steatohepatitis in a large middle-aged US cohort. J. Hepatol 75, 284–291 (2021). - PubMed
    1. Sanyal AJ, Van Natta ML, Clark J, Neuschwander-Tetri BA, Diehl A, Dasarathy S, Loomba R, Chalasani N, Kowdley K, Hameed B, Wilson LA, Yates KP, Belt P, Lazo M, Kleiner DE, Behling C, Tonascia J, Prospective study of outcomes in adults with nonalcoholic fatty liver disease. N. Engl. J. Med 385, 1559–1569 (2021). - PMC - PubMed
    1. Angulo P, Kleiner DE, Dam-Larsen S, Adams LA, Bjornsson ES, Charatcharoenwitthaya P, Mills PR, Keach JC, Lafferty HD, Stahler A, Haflidadottir S, Bendtsen F, Liver fibrosis, but no other histologic features, is associated with long-term outcomes of patients with nonalcoholic fatty liver disease. Gastroenterology 149, 389–397.e10 (2015). - PMC - PubMed

Publication types