. 2022 Nov 25;8(47):eabo3648.
doi: 10.1126/sciadv.abo3648. Epub 2022 Nov 23.

Integration of 3D genome topology and local chromatin features uncovers enhancers underlying craniofacial-specific cartilage defects

Affiliations

Integration of 3D genome topology and local chromatin features uncovers enhancers underlying craniofacial-specific cartilage defects

Qiming Chen et al. Sci Adv. .

Abstract

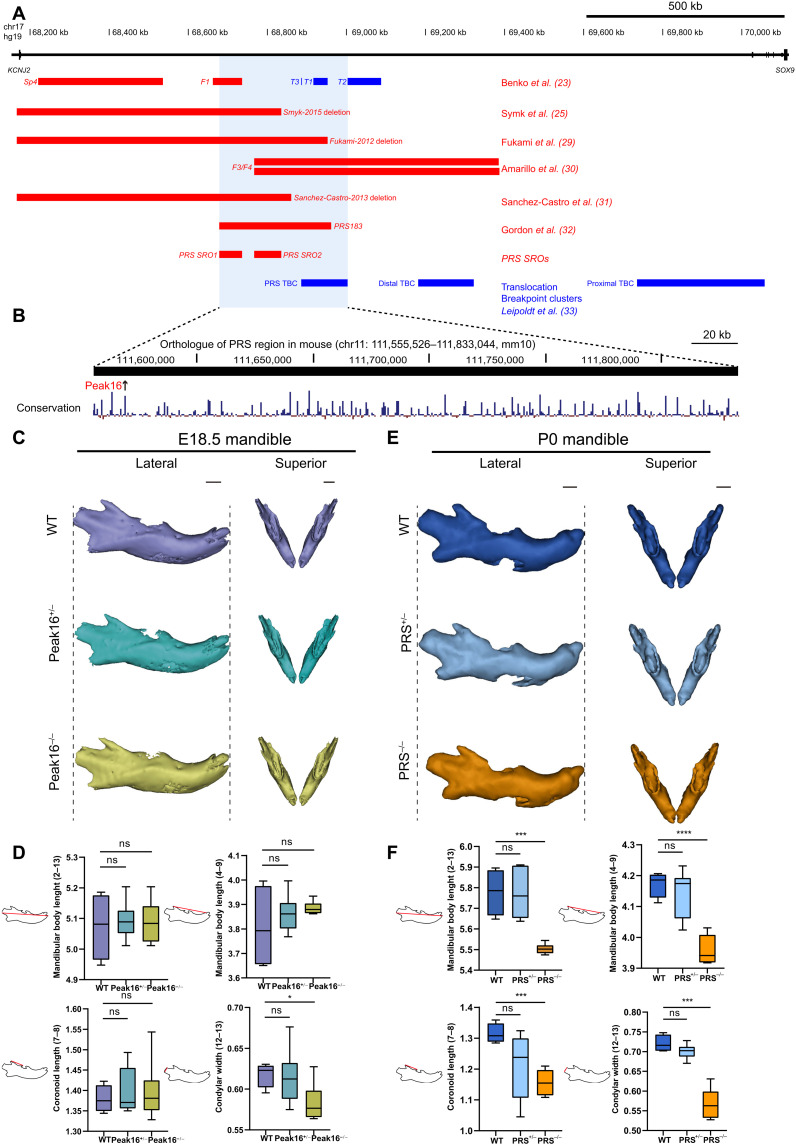
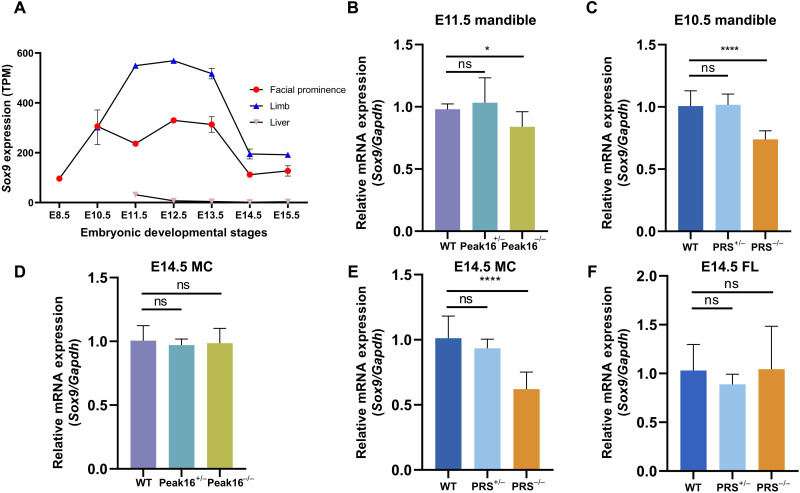
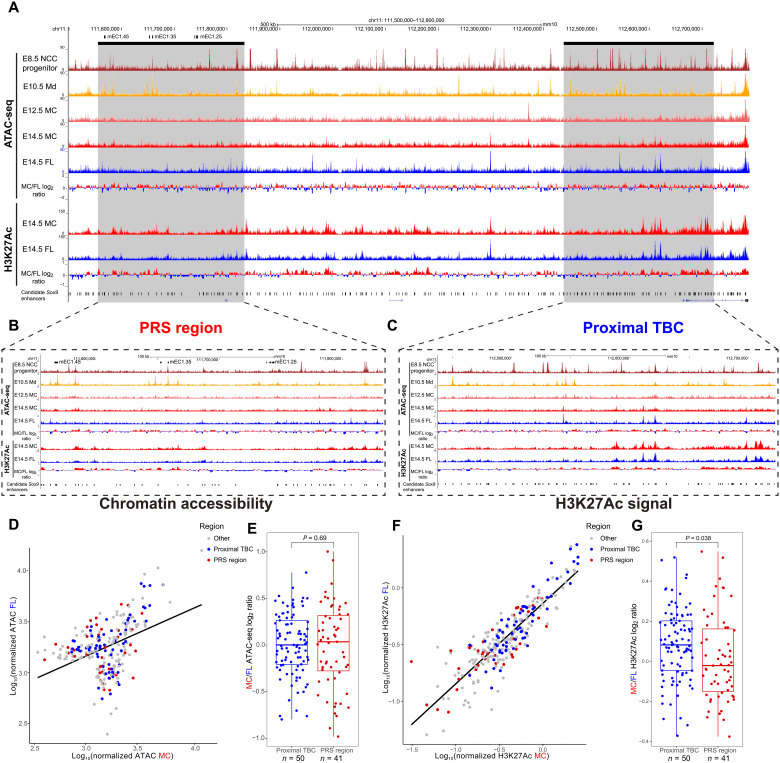
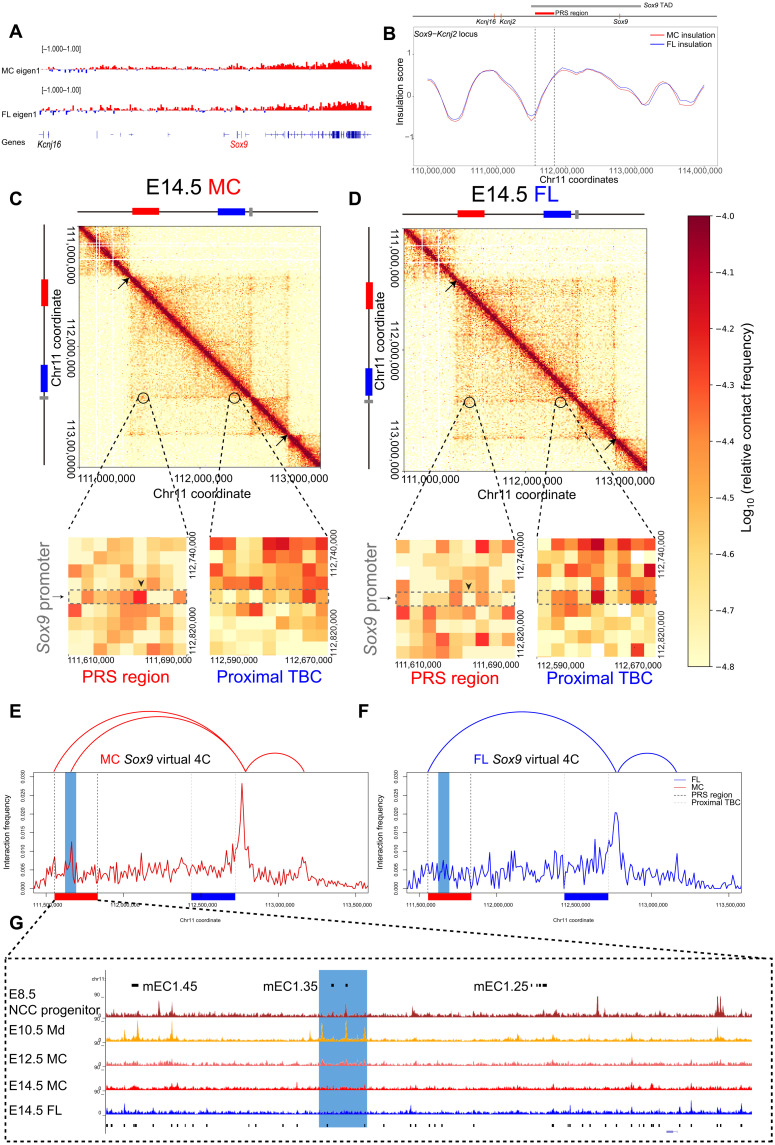
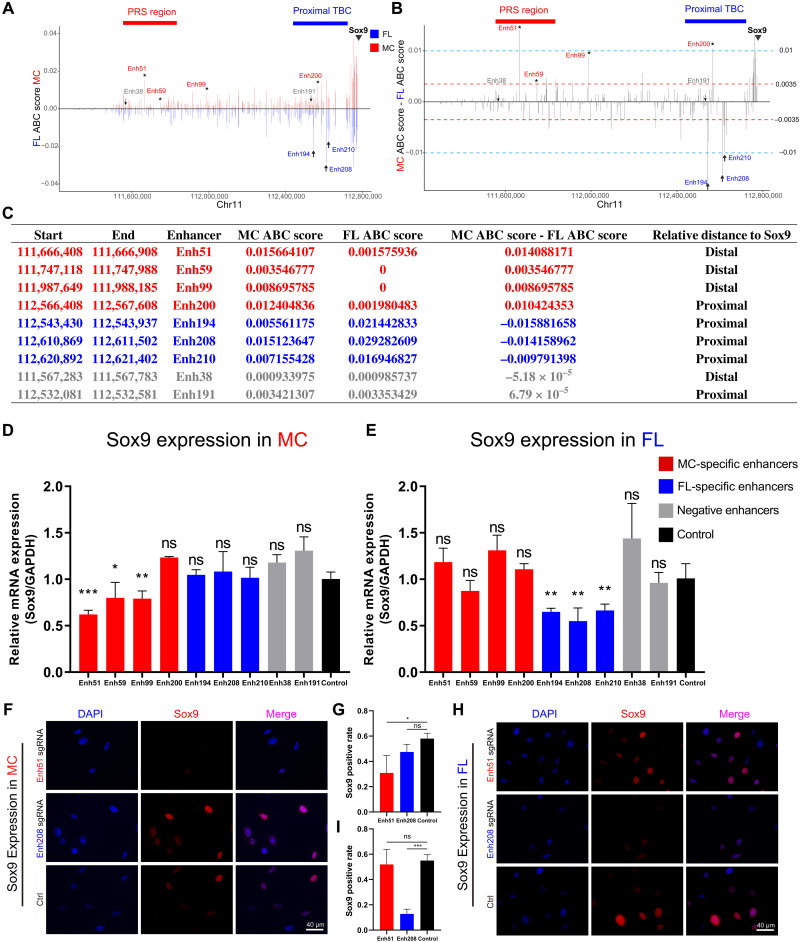
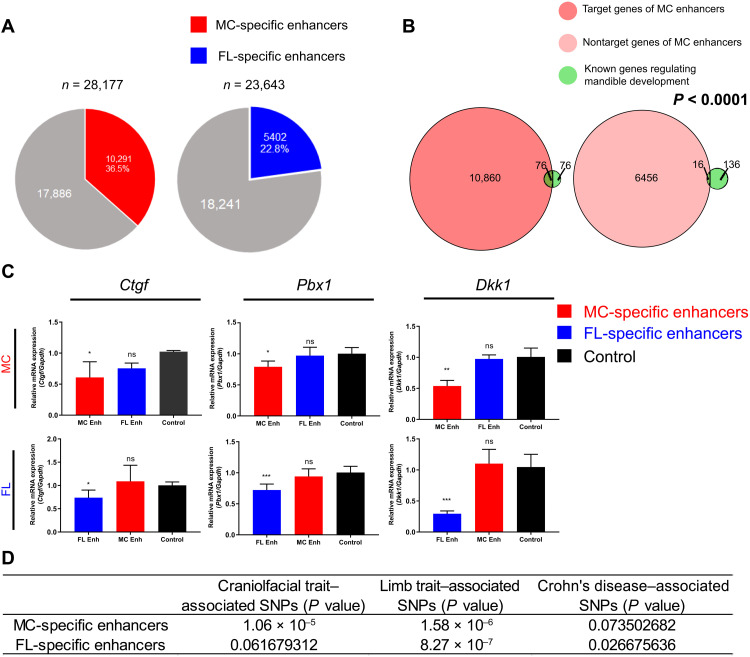
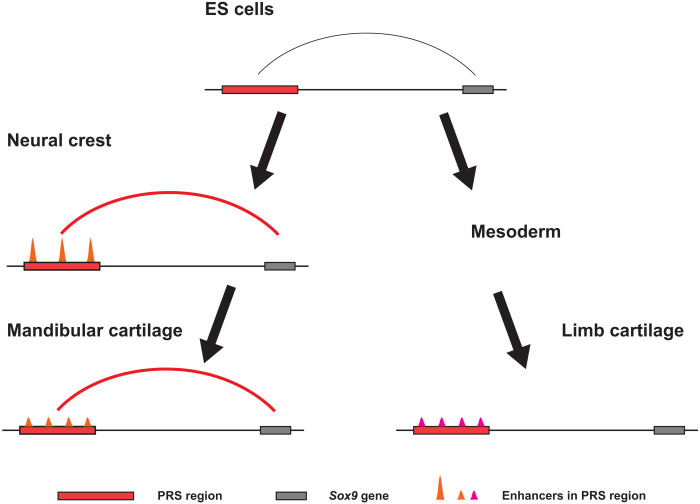
Aberrations in tissue-specific enhancers underlie many developmental defects. Disrupting a noncoding region distal from the human SOX9 gene causes the Pierre Robin sequence (PRS) characterized by the undersized lower jaw. Such a craniofacial-specific defect has been previously linked to enhancers transiently active in cranial neural crest cells (CNCCs). We demonstrate that the PRS region also strongly regulates Sox9 in CNCC-derived Meckel's cartilage (MC), but not in limb cartilages, even after decommissioning of CNCC enhancers. Such an MC-specific regulatory effect correlates with the MC-specific chromatin contacts between the PRS region and Sox9, highlighting the importance of lineage-dependent chromatin topology in instructing enhancer usage. By integrating the enhancer signatures and chromatin topology, we uncovered >10,000 enhancers that function differentially between MC and limb cartilages and demonstrated their association with human diseases. Our findings provide critical insights for understanding the choreography of gene regulation during development and interpreting the genetic basis of craniofacial pathologies.


Figures

Fig. 1.
Fig. 1.. Deletion of a 278kb genomic region far upstream of Sox9 in mouse led to underdevelopment of the lower jaw.
(A) The PRS region (shaded) was defined by the overlaps among deletions (, , –32) (red) or translocations (23, 33) (blue) detected in multiple PRS patients. SRO, the smallest region of overlap; TBC, translocation breakpoint cluster. (B) The 278-kb region in mouse (chr11: 111,555,526 to 111,833,944, mm10) orthologous of the human PRS region is zoomed and highlighted. Sequence conservation between mouse and human is shown. Arrow, the Peak16 enhancer. (C) 3D reconstruction of mandibles from E18.5 Peak16−/−, Peak16+/−, and wild-type (WT) embryos using MicroCT scans. Scale bars, 500 μm. (D) Boxplots summarizing the morphological changes in the mandible in Peak16 deletion embryos. Mandibular body length (2 to 13 and 4 to 9, the numbers correspond to the anatomic landmarks used for quantifying mandibular morphology as indicated in fig. S1B) and coronoid length (7 to 8) remained unchanged in Peak16−/− embryos (n = 4) compared to Peak16+/− (n = 6) and WT (n = 2) embryos, while condylar width (12 to 13) showed a significant decrease in Peak16−/− embryos. (E) 3D reconstruction of mandibles from PRS−/−, PRS+/−, and WT mice. Note the visible shortening of the mandible in PRS−/− mice compared to the mandible in WT as indicated by the dashed lines. (F) Boxplots summarizing the morphological changes in the mandible in PRS region deletion mice. Homozygous deletion of PRS region (PRS−/−, n = 3) resulted in a significant reduction in mandible length, hypoplasia of coronoid process, and reduced condylar width compared to PRS +/− (n = 3) and WT (n = 2). For all boxplots in (D) and (F): center line, median; box limits, upper and lower quartiles; whiskers, 1.5× interquartile range. P values (two-tailed t tests): ns, not significant, *P < 0.05, ***P < 0.001, and ****P < 0.0001.
Fig. 2.
Fig. 2.. The PRS region confers a strong regulatory effect on Sox9 transcription in mandibular cartilage.
(A) Line graphs summarize the temporal expression changes of Sox9 in facial prominences, limb, and liver during murine embryonic development. The murine transcriptome data are taken from ENCODE. (B to F) RT-qPCR quantification of Sox9 transcripts in different tissues and developmental stages. Data are from three independently replicated experiments. *P < 0.05 and ****P < 0.0001. (B) The Peak16 deletion causes moderate down-regulation of Sox9 in E11.5 mandible tissues. (C) The deletion of the entire PRS region results in down-regulation of Sox9 in E10.5 mandible tissues. Both the E10.5 and E11.5 mandibles are composed of largely undifferentiated ectomesenchyme, while the MC has not emerged. (D) The Peak16 deletion does not affect Sox9 expression in E14.5 MC. (E and F) The deletion of the PRS region causes significant down-regulation of Sox9 in E14.5 MC (E) but not in E14.5 FLs (F).
Fig. 3.
Fig. 3.. Mandibular cartilage-specific regulatory function of the PRS region cannot be attributed to differences in local enhancer signatures.
(A) Normalized ATAC-seq and H3K27Ac signals in the 1.3-Mb noncoding region upstream of Sox9. The ATAC-seq data for E8.5 NCC progenitor and E10.5 mandibular tissues are from (34). The ATAC-seq data for E12.5 MC, E14.5 MC, and E14.5 FL, as well as H3K27Ac CUT&Tag data for E14.5 MC and E14.5 FL, are generated from this study. (B and C) Zoomed-in views of ATAC-seq and H3K27Ac tracks in PRS region (B) and proximal TBC (C). (D) Scatterplot showing differential chromatin accessibility at ATAC-seq peaks in E14.5 MC and FL. Each dot represents an ATAC-seq peak within the 1.3-Mb Sox9 genomic neighborhood. Red dots, peaks located in the distal PRS region; blue dots, peaks located in the proximal TBC region; gray dots, peaks not located in the distal PRS region or the proximal TBC region. (E) Boxplot comparing the log2 ratios of E14.5 MC and E14.5 FL ATAC-seq signals for peaks located in the proximal TBC region (blue) versus PRS region (red). Centerline, median; box limits, upper and lower quartiles; whiskers, 1.5× interquartile range. n, number of peaks in each region. P value is calculated from the two-tailed t test. (F and G) Comparison of H3K27Ac signal in MC and FL with scatterplot (F) and boxplot (G) as in (D) and (E).
Fig. 4.
Fig. 4.. Different 3D chromatin topology at the Sox9 locus in MC and FL.
(A) Eigen1 profiles at 10-kb resolution for the 1.3-Mb Sox9 genomic neighborhood in MC (top) and FL (bottom). (B) Insulation profiles at 10-kb resolution for the Sox9 genomic neighborhood in MC (red) and FL (blue). The local minima on the insulation profiles denote TAD boundaries. The TAD encompassing the Sox9 gene is largely invariant in the two cartilage types. (C and D) Hi-C interaction heatmaps at Sox9 locus in E14.5 MC (C) and FL (D) with the boundaries of the Sox9 TAD indicated by arrows. The enlarged regions indicate the chromatin interaction patterns between the PRS or proximal TBC region and the Sox9 promoter. Note that a genomic bin in the PRS region (arrowheads) exhibits higher interaction frequencies in MC than in FL. Bin size, 10 kb. (E and F) Virtual 4C profiles using the Sox9 promoter as the viewpoint in MC (E) and FL (F). Chromatin loops identified using MUSTACHE are shown above the virtual 4C plots. Blue vertical bars indicate the genomic bin within the PRS region that forms an MC-specific loop with the Sox9 promoter. (G) ATAC-seq tracks show that the MC-specific loop occurs between the mEC1.35 enhancer cluster and the Sox9 promoter.
Fig. 5.
Fig. 5.. Identification and validation of cartilage type–specific Sox9 enhancers.
(A and B) ABC scores of putative Sox9 enhancers in E14.5 MC (red) and FL (blue) (A) and their differences (B) revealed several enhancers that exhibit higher activities in MC (asterisk) or FL (arrows), respectively. Red bar, PRS region; blue bar, proximal TBC region; arrowhead, Sox9 promoter. (C) Several Sox9 enhancers are selected for in vitro functional validation based on the ABC score differences between MC and FL. Enhancers that are predicted to be MC- or FL-specific are colored in red and blue, respectively. Negative control enhancers that exhibit low ABC scores and minimal ABC score differences in both cartilage types are colored in gray. (D and E) RT-qPCR quantification of Sox9 transcripts shows that silencing MC-specific enhancers could induce down-regulation of Sox9 expression only in MC (D), whereas inactivating Sox9 FL-specific enhancers could lead to Sox9 reduction specifically in FL (E). Data are from three independently replicated experiments. (F to I) Confirmation of tissue-specific down-regulation of SOX9 by inactivating Enh51 and Enh208 in MC and FL at the protein level by immunofluorescence. (F and H) Representative microscopic fields showing the expression level of SOX9 in MC (F) and FL (H) upon the inactivation of Enh51 or Enh208. Antibody staining signals of SOX9 are shown in green. 4′,6-Diamidino-2-phenylindole (DAPI)–stained DNA is shown in blue. (G and I) Bar graphs summarizing percentages of SOX9-positive cells in MC (G) and FL (I) quantified by microscopic imaging. Cell counting was performed for three independent biological replicates (n = 3). For (D), (E), (G), and (I), error bars are SEM. P values (two-tailed t tests): *P < 0.05, **P < 0.01, and ***P < 0.001.
Fig. 6.
Fig. 6.. Genome-wide assessment of differential enhancer functions in MC and FL.
(A) Fractions of MC-specific enhancers (left, red) or FL-specific enhancers (right, blue) in all enhancers identified in MC and FL. (B) Target genes of MC enhancers show a higher degree of overlap with known genes involved in mandible development (left) than the actively expressed genes in E14.5 facial prominence not associated with any MC enhancer (nontarget genes of MC enhancers, right). P value is calculated from the chi-square test. (C) Inactivation of MC-specific and FL-specific enhancers of Ctgf, Pbx1, and Dkk1 resulted in down-regulation of target genes in a tissue-specific manner (n = 3). Error bars are SEM. P values (two-tailed t tests): *P < 0.05, **P < 0.01, and ***P < 0.001. (D) GREGOR analysis reveals differential enrichment of the SNPs associated with limb diseases/traits and craniofacial diseases/traits in FL-specific and MC-specific enhancers. SNPs associated with Crohn’s disease are used as control. Enrichment P values are calculated using GREGOR.
Fig. 7.
Fig. 7.. A model for differential regulatory functions of PRS region in cartilages originating from different cell lineages.
A simplified model that illustrates how the PRS region may interact with the Sox9 promoter in a lineage-dependent manner to instruct the enhancer usage. In neural crest cells, multiple strong enhancers within the PRS region emerge. At the same time, the interaction between the PRS region and the Sox9 gene is established. In neural crest–derived mandibular cartilage, although the activities of the strong neural crest enhancers diminish, the interaction between the PRS region and the Sox9 gene is maintained. As a result, the weak enhancers within the PRS region still exert a strong regulatory function on Sox9 expression. In mesoderm-derived limb cartilage, the enhancers within the PRS play a less significant role in Sox9 regulation due to the absence of long-range chromatin contact.

Similar articles

Cited by

References

    1. de Laat W., Duboule D.,Topology of mammalian developmental enhancers and their regulatory landscapes. Nature 502,499–506 (2013). - PubMed
    1. Shlyueva D., Stampfel G., Stark A.,Transcriptional enhancers: From properties to genome-wide predictions. Nat. Rev. Genet. 15,272–286 (2014). - PubMed
    1. Long H. K., Prescott S. L., Wysocka J.,Ever-changing landscapes: Transcriptional enhancers in development and evolution. Cell 167,1170–1187 (2016). - PMC - PubMed
    1. Furlong E. E. M., Levine M.,Developmental enhancers and chromosome topology. Science 361,1341–1345 (2018). - PMC - PubMed
    1. The ENCODE Project Consortium ,An integrated encyclopedia of DNA elements in the human genome. Nature 489,57–74 (2012). - PMC - PubMed

Substances