. 2022 Nov 25;8(47):eabn0238.
doi: 10.1126/sciadv.abn0238. Epub 2022 Nov 23.

Widespread hypertranscription in aggressive human cancers

Affiliations

Widespread hypertranscription in aggressive human cancers

Matthew Zatzman et al. Sci Adv. .

Abstract

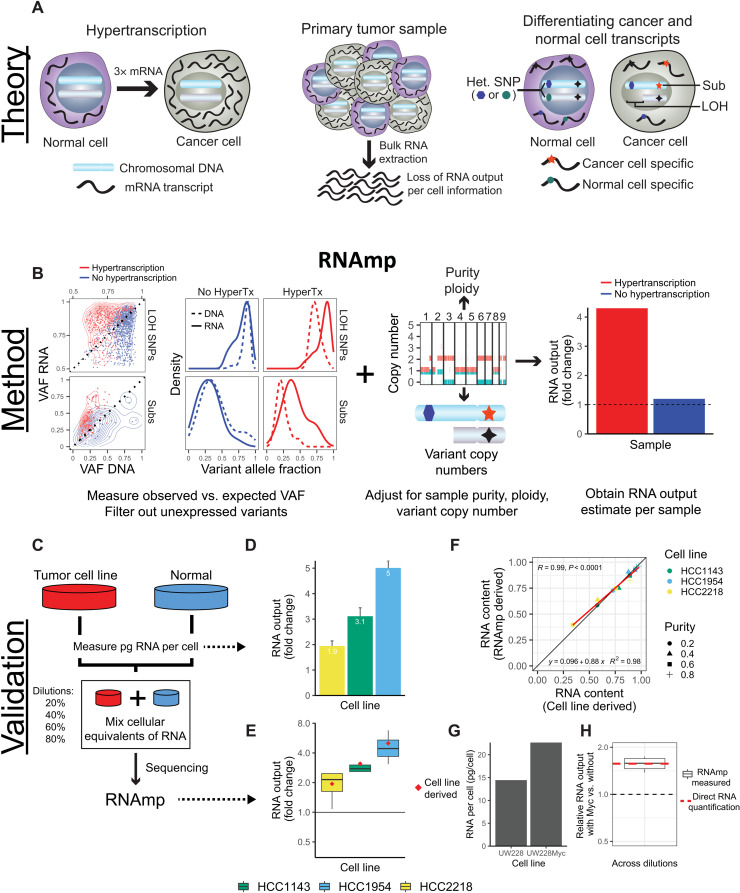
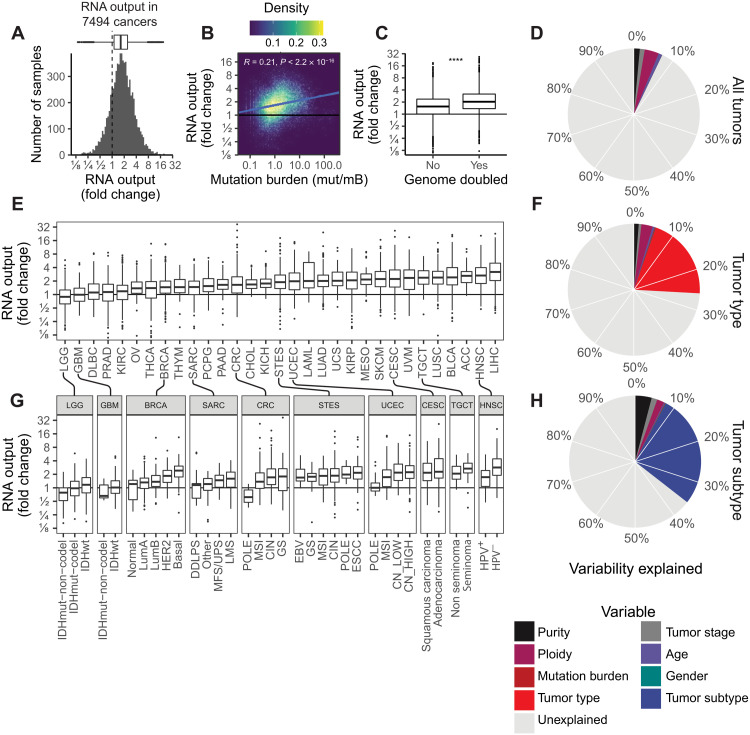
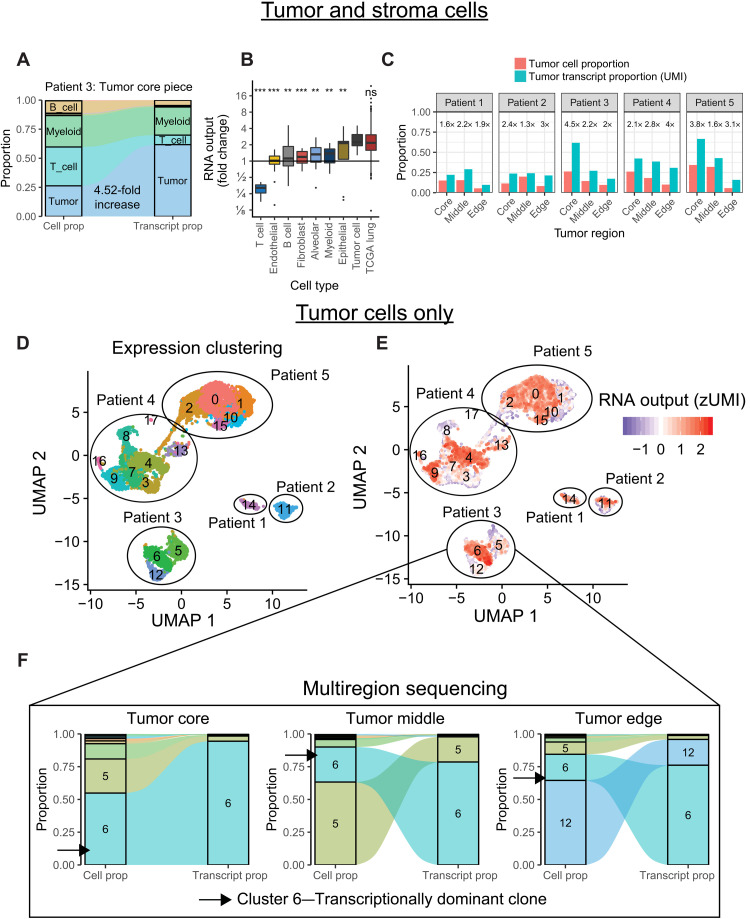
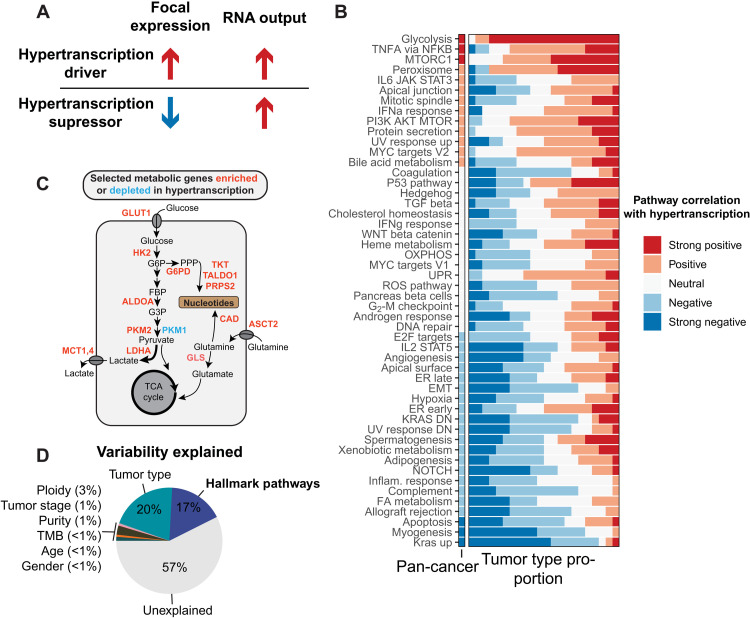
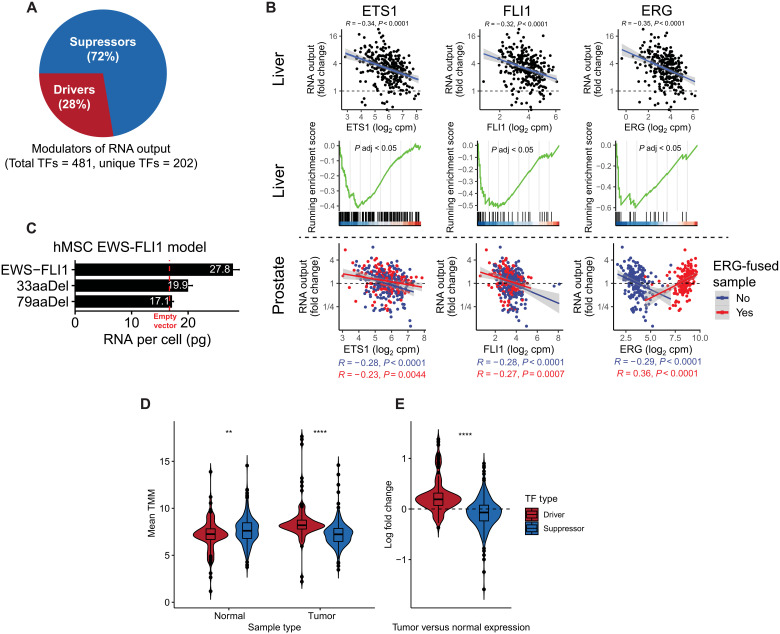
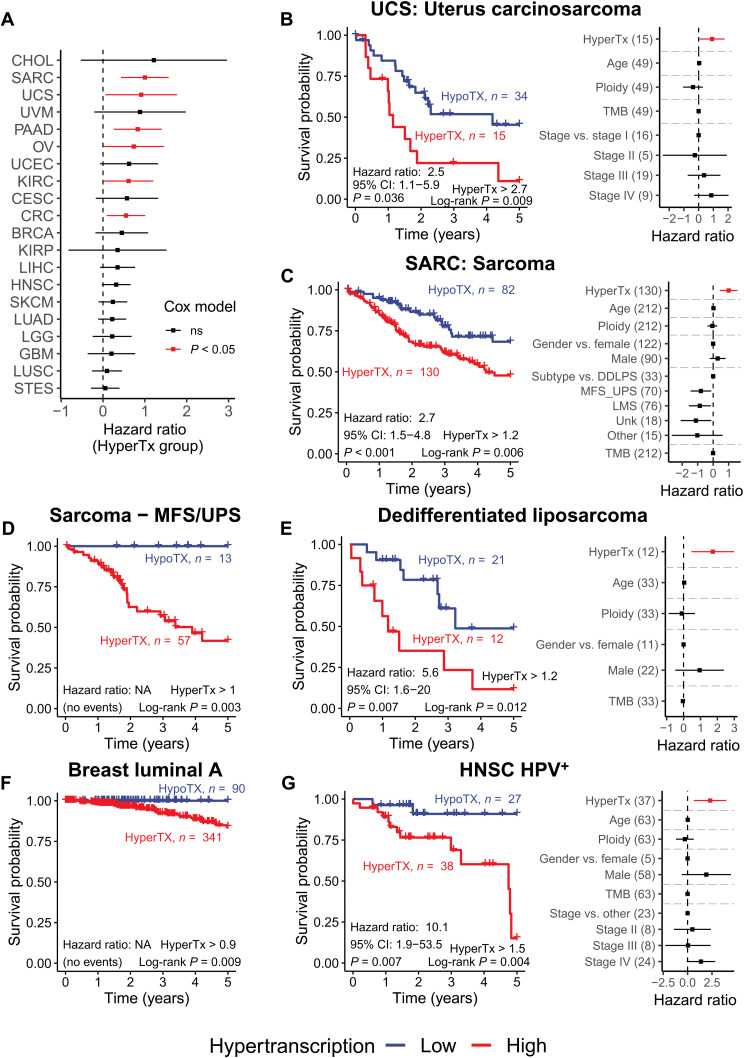
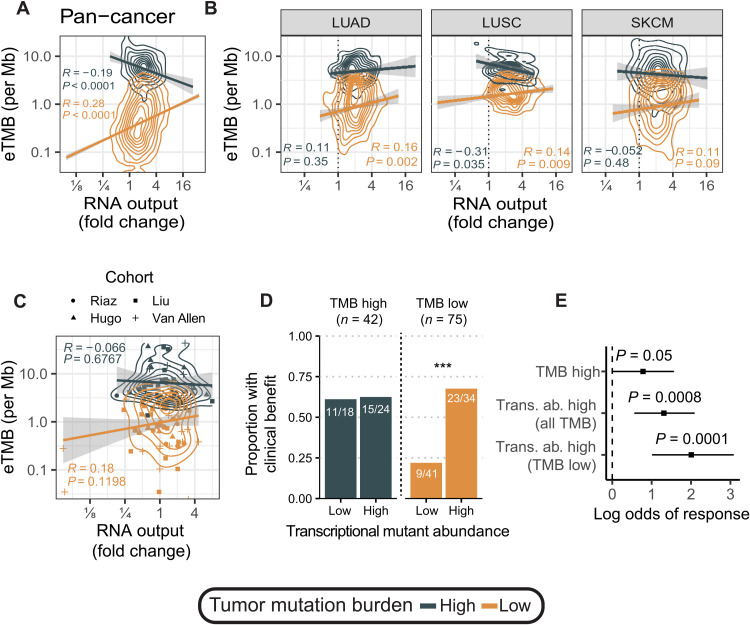
Cancers are often defined by the dysregulation of specific transcriptional programs; however, the importance of global transcriptional changes is less understood. Hypertranscription is the genome-wide increase in RNA output. Hypertranscription's prevalence, underlying drivers, and prognostic significance are undefined in primary human cancer. This is due, in part, to limitations of expression profiling methods, which assume equal RNA output between samples. Here, we developed a computational method to directly measure hypertranscription in 7494 human tumors, spanning 31 cancer types. Hypertranscription is ubiquitous across cancer, especially in aggressive disease. It defines patient subgroups with worse survival, even within well-established subtypes. Our data suggest that loss of transcriptional suppression underpins the hypertranscriptional phenotype. Single-cell analysis reveals hypertranscriptional clones, which dominate transcript production regardless of their size. Last, patients with hypertranscribed mutations have improved response to immune checkpoint therapy. Our results provide fundamental insights into gene dysregulation across human cancers and may prove useful in identifying patients who would benefit from novel therapies.


Figures

Fig. 1.
Fig. 1.. Overview of RNA output analysis with RNAmp.
(A) Hypertranscription occurs when cancer cells elevate their RNA output above normal cell levels (left). Upon RNA extraction from primary tumor tissue, RNA output per cell information is lost (middle). Cancer cell– and normal cell–specific transcripts can be identified using tumor-specific marker variants, such as somatic substitutions (Subs) and LOH-SNPs (right). (B) DNA and RNA VAF distributions in samples with and without hypertranscription (HyperTX). Positive shifts in the RNA VAF of tumor-specific variants indicate that RNA output has increased. To estimate the overall fold change in RNA output of cancer versus normal cells, RNAmp incorporates these VAF shifts with tumor purity, ploidy, and local copy number data. (C) Cell number–normalized RNA-seq was performed on tumor and normal cell mixtures to validate RNAmp’s accuracy. RNA output per cell was measured before cell mixing. These mixtures were then sequenced and processed by RNAmp. (D) Fold change in RNA output levels of cancer cell lines measured by direct RNA quantification. Error bars correspond to SD. (E) RNAmp-derived RNA output measures (boxplots) compared to direct RNA quantification measures (red diamonds). Boxplot center line corresponds to the median, box limits are upper and lower quartiles, and whiskers represent 1.5 × interquartile range. (F) Pearson correlation of RNAmp-derived tumor RNA content estimates compared to direct RNA content quantification (R = 0.99, P < 0.0001). (G) RNA output per cell measured in medulloblastoma cells with and without MYC induction. (H) RNAmp-derived fold change in RNA output between UW228 Myc and UW228 wild-type cells (boxplot) compared to direct RNA quantification (red line). Boxplots are defined in (E).
Fig. 2.
Fig. 2.. The landscape of hypertranscription in primary human cancer.
(A) Histogram showing RNA output, expressed as a fold change, across 7494 primary tumor samples. Dashed line indicates onefold, meaning no change in RNA output level. (B) Pearson correlation between RNA output and TMB (P < 0.0001, R = 0.21). (C) Boxplot of RNA output levels in genome-doubled tumors versus nondoubled tumors (****P < 0.0001, Student’s two-sided t test). (D) Pie chart depicting the proportion of variability in RNA output that is explained by clinical features (purity, ploidy, tumor stage, age, mutation burden, and gender). The overall variability (7.1%) is explained by these features. (E) Boxplots of RNA output levels in tumor types. (F) Pie chart depicting the proportion of variability in RNA output explained including tumor type information. Nineteen percent more variance is explained by this model, for a total of 26%. (G) RNA output levels in tumor subtypes. (H) Pie chart depicting the proportion of variability in RNA output explained including tumor-type information. Nine percent more variance is explained by this model, for a total of 35%. Boxplots are defined in Fig. 1E. ESCC, esophageal squamous cell carcinoma; GS, genomically stable; LMS, leiomyosarcoma; SKCM, skin cutaneous melanoma; KIRC, kidney renal clear cell carcinoma; OV, ovarian; PAAD, pancreatic adenocarcinoma; CHOL, cholangiocarcinoma; UCS, uterine carcinosarcoma; KIRP, kidney renal papillary cell carcinoma; CESC, cervical squamous cell carcinoma and endocervical adenocarcinoma; UVM, uveal melanoma; LIHC, liver hepatocellular carcinoma. Tumor-type abbreviations can be found in table S1.
Fig. 3.
Fig. 3.. Hypertranscription in single cells.
(A) Flow diagram depicting the proportional cell counts and transcript counts for different cell types from a primary lung cancer sample. Fold changes in RNA output between tumor and normal cell populations can be estimated from these data, similar to RNAmp. (B) Boxplot summarizing the relative fold change values in RNA output for various cell populations identified from scRNA-seq. Tumor cells have consistently elevated RNA output levels, equivalent to values derived from the bulk TCGA lung dataset (***P < 0.001 and **P < 0.01, Student’s two-sided t test). ns, not significant. (C) Bar charts of tumor cell proportion and tumor transcript proportion from five patients with multiregion scRNA-sequenced lung cancer. Cancer cells consistently increase their relative transcript proportion regardless of tumor region or tumor cellularity. Numbers above each set of bar plots indicate relative fold change in RNA output of tumor cells. (D) Uniform Manifold Approximation and Projection (UMAP) distance plot showing scRNA-seq expression clustering results for tumor cell populations. Subclusters were identified in patients 3 to 5. (E) RNA output of single cells overlaid onto the UMAP expression clusters reveals distinct subclusters of tumor cells within each sample undergoing hypertranscription. (F) Flow diagram depicting the proportional cell counts and transcript counts for different tumor subclusters across spatially distinct tumor regions from patient 3. Subcluster 6 maintains transcriptional dominance across tumor regions, even when it becomes a minority population by cell proportion. Boxplots are defined in Fig. 1E.
Fig. 4.
Fig. 4.. Integrating focal and global gene expression data reveals pathways of oncogenic hypertranscription.
(A) Hypertranscription can be driven by specific genes and expression pathways either through their focal expression gain (drivers) or through their focal expression loss (suppressors). (B) Correlations between 50 hallmark signaling pathways and RNA output across the pan-cancer cohort and across individual tumor types (displayed as the proportion of tumor types with a given correlation) KRAS DN, KRAS down; DN, down. (C) Diagram depicting selected metabolic genes either enriched (red) or depleted (blue) in hypertranscribing samples. Genes involved in shunting glucose and glutamine toward nucleosynthetic pathways are all elevated in the hypertranscriptional state. TCA, tricarboxylic acid. (D) The proportion of variability explained in the pan-cancer cohort when including hallmark pathway expression. IL6, interleukin-6; JAK, Janus kinase; STAT3, signal transducer and activator of transcription 3; IFNa, interferon-a; PI3K, phosphatidylinositol 3-kinase; UV, ultraviolet; TGF, transforming growth factor; OXPHOS, oxidative phosphorylation; UPR, unfolded protein response; ROS, reactive oxygen species; ER, endoplasmic reticulum; EMT, epithelial-mesenchymal transition; FA, fatty acid.
Fig. 5.
Fig. 5.. Evidence of transcriptional derepression as a mechanism driving oncogenic hypertranscription.
(A) Pie chart depicting the proportion of TF drivers and suppressors of hypertranscription. (B) Top: Pearson correlation between ETS1, FLI1, and ERG and RNA output in liver cancer. Middle: ETS1, FLI1, and ERG target genes are enriched in hypotranscribing liver cancers and depleted in hypertranscriptional samples. Bottom: Pearson correlation between ETS1, FLI1, and ERG and RNA output in prostate cancers with or without ERG fusions. (C) RNA per cell measurements from a human mesenchymal cell model expression either full-length EWS-FLI1, empty vector, or C-terminal truncating mutations in FLI1 of either 33 or 79 amino acids in length. Error bars correspond to SD. hMSC, human mesenchymal stem cell. (D) Mean expression values of TF drivers and suppressors of transcriptional output in GTEx normal and TCGA tumor samples. TMM, trimmed mean of M values (E) Summarized log fold change in expression of TF driver and suppressor expression between tissue-matched tumor and normal samples. **P < 0.01; ****P < 0.0001.
Fig. 6.
Fig. 6.. Hypertranscription defines patient subgroups with worse overall survival.
(A) Cox regression HRs for hypertranscriptional patients across 20 tumor types. Hypertranscriptional patients have consistently worse overall survival. In six tumor types, hypertranscription acts as an independent prognostic factor (red bars indicate Cox-HR, P < 0.05). (B to G) Kaplan-Meier survival plots (left) and Cox regression model HRs (right) for (B) uterus carcinosarcoma, (C) sarcoma, (D) myxofibrosarcoma and undifferentiated pleomorphic sarcoma (MFS/UPS), (E) dedifferentiated liposarcoma (DDLPS), (F) luminal A BRCA, and (G) HPV+ HNSC. Only Kaplan-Meier plots are shown for patients with MFS/UPS sarcoma and luminal A BRCA, as all hypotranscriptional patients survive preventing analysis by Cox regression. Error bars on all HR coefficients represent the 95% CI. NA, not applicable.
Fig. 7.
Fig. 7.. Transcriptional mutant abundance as a biomarker for ICI response.
(A) Pan-cancer correlation between eTMB and hypertranscription for hypermutant (>10 mut/Mb) and nonhypermutant tumors (<10 mut/Mb). (B) Correlation between eTMB and hypertranscription for hypermutant (>10 mut/Mb) and nonhypermutant tumors (<10 mut/Mb) in lung cancers (LUAD and LUSC), and SKCM. (C) Correlation between eTMB and hypertranscription for hypermutant (>10 mut/Mb) and nonhypermutant tumors (<10 mut/Mb) in four melanoma ICI cohorts. (D) Proportion of patients with clinical benefit from ICI therapy in high- and low-TMB groups split by transcriptional mutant abundance levels. ***P < 0.001. (E) Log odds of response to ICI therapy for different TMB markers. Transcriptional mutant abundance is an overall better predictor of ICI response compared to genomic TMB. Error bars on log odds coefficients represent the 95% CI.

References

    1. Bielski C. M., Zehir A., Penson A. V., Donoghue M. T. A., Chatila W., Armenia J., Chang M. T., Schram A. M., Jonsson P., Bandlamudi C., Razavi P., Iyer G., Robson M. E., Stadler Z. K., Schultz N., Baselga J., Solit D. B., Hyman D. M., Berger M. F., Taylor B. S., Genome doubling shapes the evolution and prognosis of advanced cancers. Nat. Genet. 50, 1189–1195 (2018). - PMC - PubMed
    1. Li Y., Roberts N. D., Wala J. A., Shapira O., Schumacher S. E., Kumar K., Khurana E., Waszak S., Korbel J. O., Haber J. E., Imielinski M.; PCAWG Structural Variation Working Group, Weischenfeldt J., Beroukhim R., Campbell P. J.; PCAWG Consortium , Patterns of somatic structural variation in human cancer genomes. Nature 578, 112–121 (2020). - PMC - PubMed
    1. Nik-Zainal S., Alexandrov L. B., Wedge D. C., Van Loo P., Greenman C. D., Raine K., Jones D., Hinton J., Marshall J., Stebbings L. A., Menzies A., Martin S., Leung K., Chen L., Leroy C., Ramakrishna M., Rance R., Lau K. W., Mudie L. J., Varela I., McBride D. J., Bignell G. R., Cooke S. L., Shlien A., Gamble J., Whitmore I., Maddison M., Tarpey P. S., Davies H. R., Papaemmanuil E., Stephens P. J., McLaren S., Butler A. P., Teague J. W., Jönsson G., Garber J. E., Silver D., Miron P., Fatima A., Boyault S., Langerod A., Tutt A., Martens J. W. M., Aparicio S. A. J. R., Borg Å., Salomon A. V., Thomas G., Borresen-Dale A. L., Richardson A. L., Neuberger M. S., Futreal P. A., Campbell P. J., Stratton M. R., Mutational processes molding the genomes of 21 breast cancers. Cell 149, 979–993 (2012). - PMC - PubMed
    1. Campbell B. B., Light N., Fabrizio D., Zatzman M., Fuligni F., de Borja R., Davidson S., Edwards M., Elvin J. A., Hodel K. P., Zahurancik W. J., Suo Z., Lipman T., Wimmer K., Kratz C. P., Bowers D. C., Laetsch T. W., Dunn G. P., Johanns T. M., Grimmer M. R., Smirnov I. V., Larouche V., Samuel D., Bronsema A., Osborn M., Stearns D., Raman P., Cole K. A., Storm P. B., Yalon M., Opocher E., Mason G., Thomas G. A., Sabel M., George B., Ziegler D. S., Lindhorst S., Issai V. M., Constantini S., Toledano H., Elhasid R., Farah R., Dvir R., Dirks P., Huang A., Galati M. A., Chung J., Ramaswamy V., Irwin M. S., Aronson M., Durno C., Taylor M. D., Rechavi G., Maris J. M., Bouffet E., Hawkins C., Costello J. F., Meyn M. S., Pursell Z. F., Malkin D., Tabori U., Shlien A., Comprehensive analysis of hypermutation in human cancer. Cell 171, 1042–1056.e10 (2017). - PMC - PubMed
    1. Lin C. Y., Lovén J., Rahl P. B., Paranal R. M., Burge C. B., Bradner J. E., Lee T. I., Young R. A., Transcriptional amplification in tumor cells with elevated c-Myc. Cell 151, 56–67 (2012). - PMC - PubMed