. 2022 Nov 25;8(47):eabq1984.
doi: 10.1126/sciadv.abq1984. Epub 2022 Nov 23.

Macrophage acetyl-CoA carboxylase regulates acute inflammation through control of glucose and lipid metabolism

Affiliations

Macrophage acetyl-CoA carboxylase regulates acute inflammation through control of glucose and lipid metabolism

Scott Yeudall et al. Sci Adv. .

Abstract

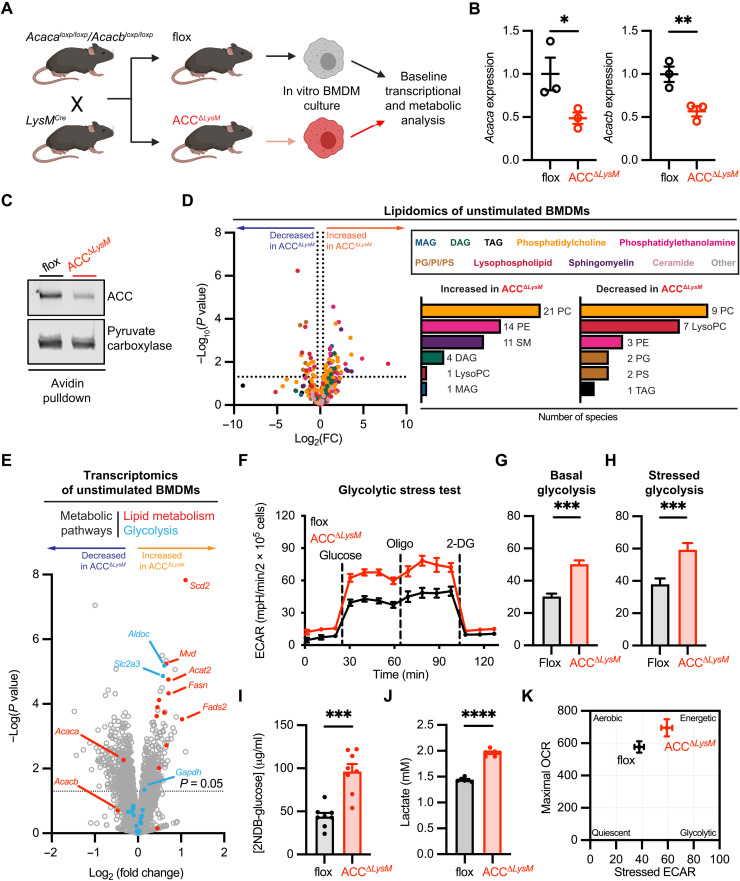
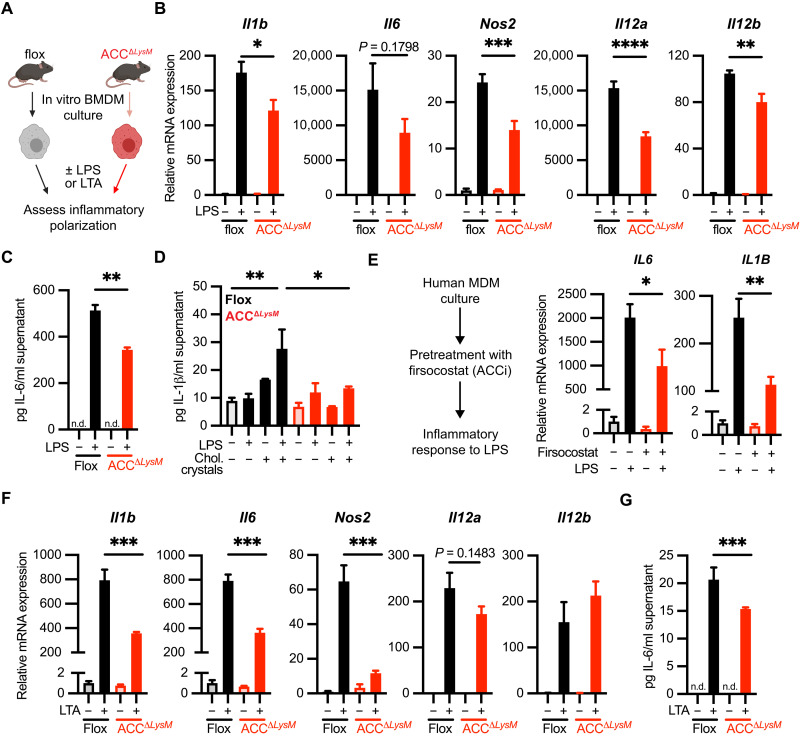
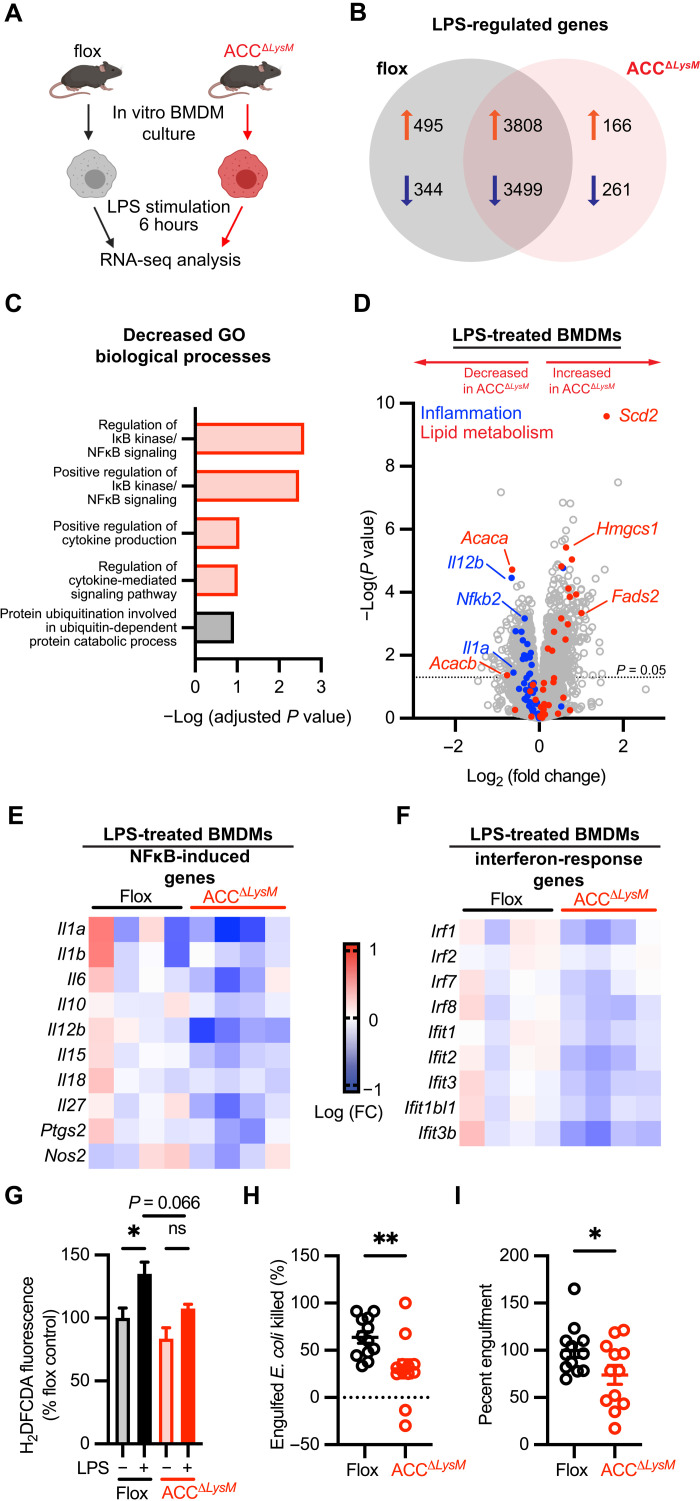
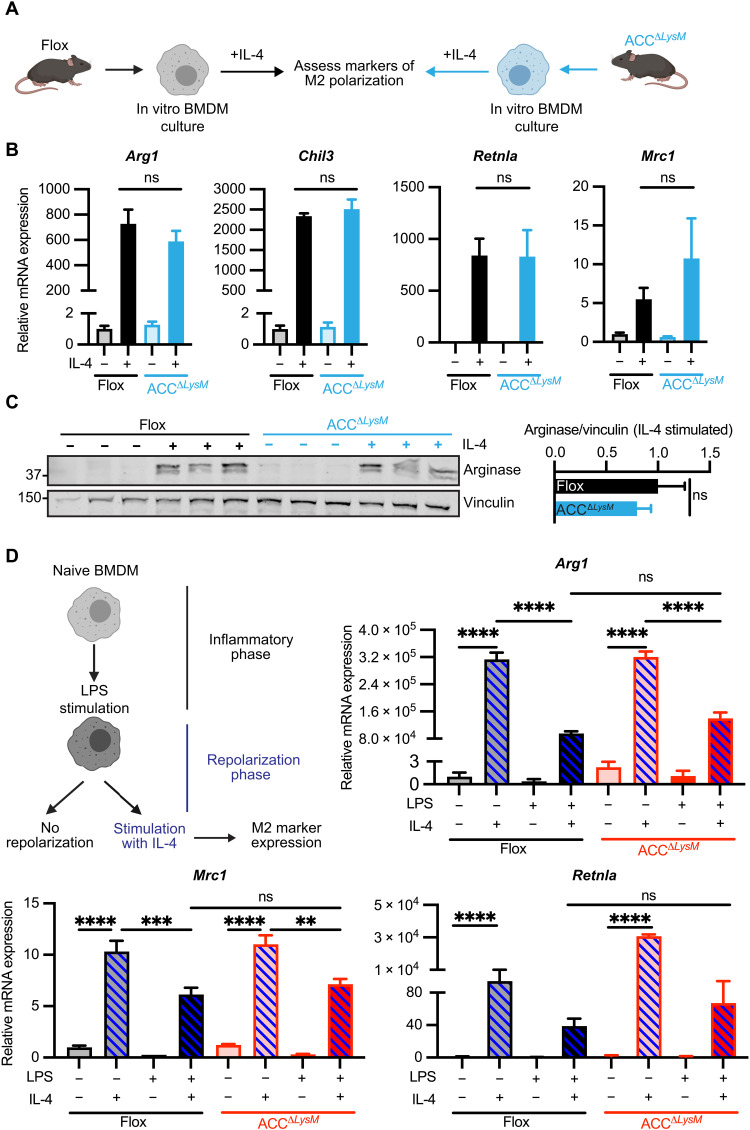
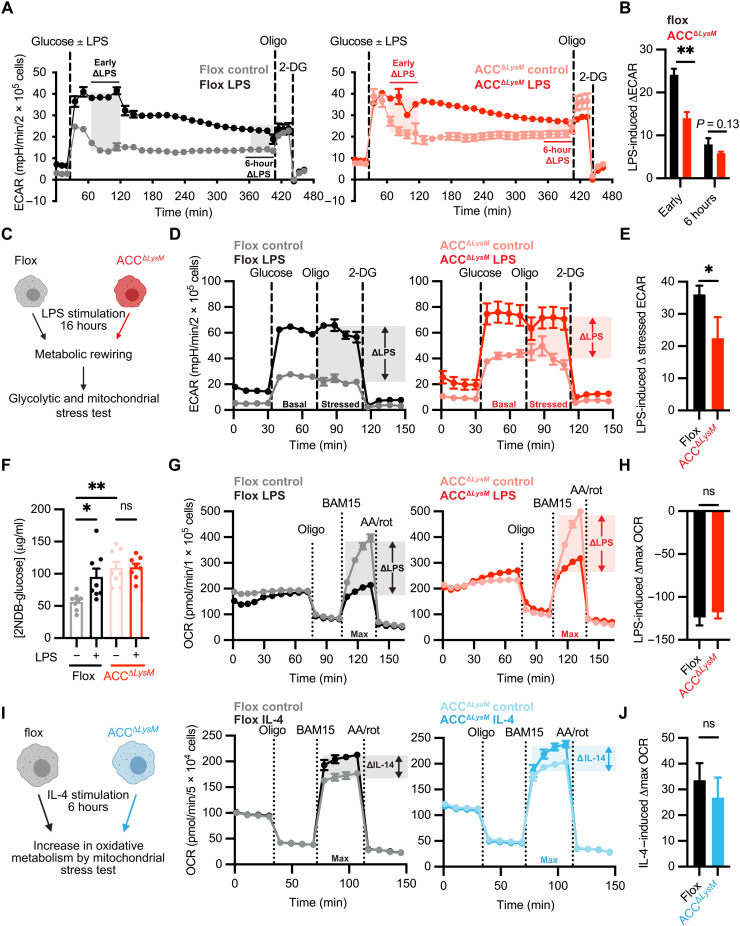
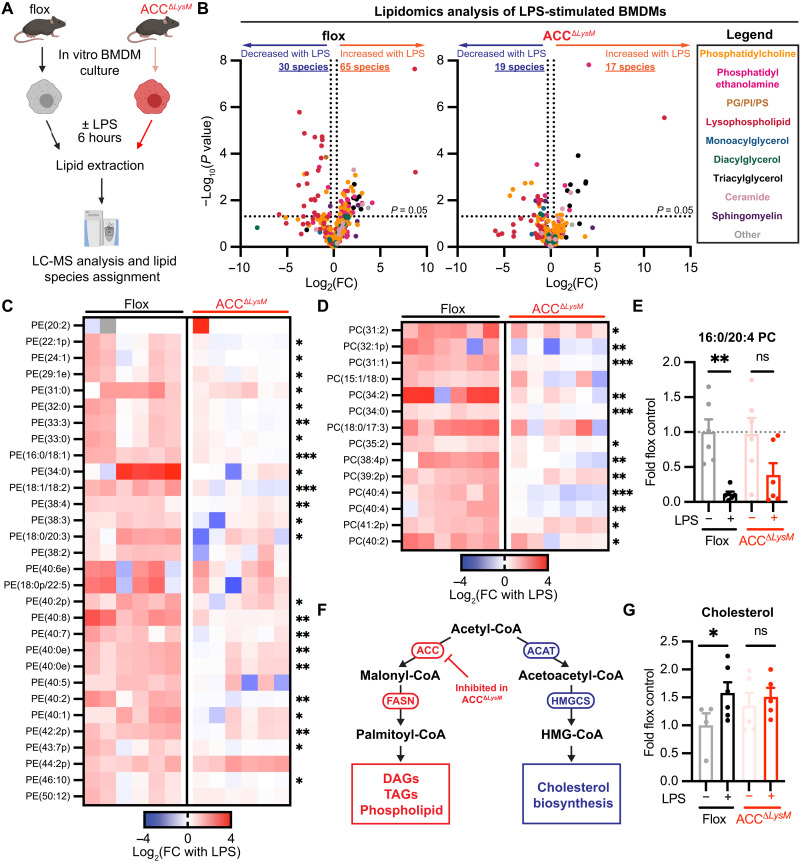
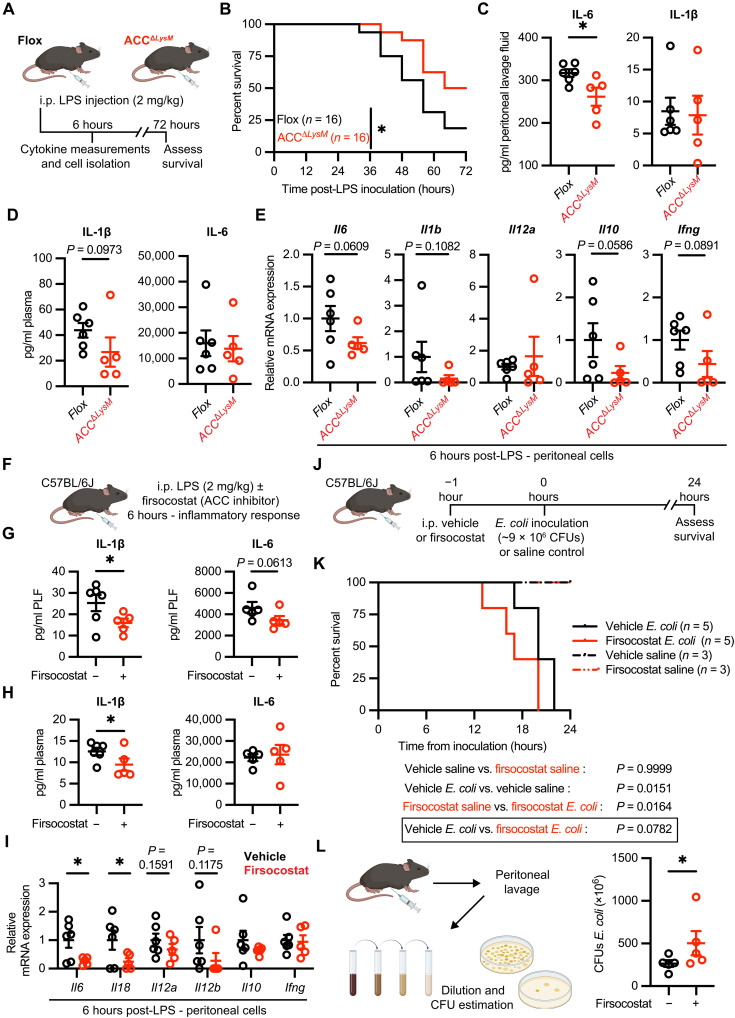
Acetyl-CoA carboxylase (ACC) regulates lipid synthesis; however, its role in inflammatory regulation in macrophages remains unclear. We generated mice that are deficient in both ACC isoforms in myeloid cells. ACC deficiency altered the lipidomic, transcriptomic, and bioenergetic profile of bone marrow-derived macrophages, resulting in a blunted response to proinflammatory stimulation. In response to lipopolysaccharide (LPS), ACC is required for the early metabolic switch to glycolysis and remodeling of the macrophage lipidome. ACC deficiency also resulted in impaired macrophage innate immune functions, including bacterial clearance. Myeloid-specific deletion or pharmacological inhibition of ACC in mice attenuated LPS-induced expression of proinflammatory cytokines interleukin-6 (IL-6) and IL-1β, while pharmacological inhibition of ACC increased susceptibility to bacterial peritonitis in wild-type mice. Together, we identify a critical role for ACC in metabolic regulation of the innate immune response in macrophages, and thus a clinically relevant, unexpected consequence of pharmacological ACC inhibition.


Figures

Fig. 1.
Fig. 1.. Deletion of ACC shifts macrophage metabolism to hyperenergetic, glycolytic state.
(A) Mice carrying loxP-flanked alleles of Acaca and Acacb were crossed with LysMCre mice to generate mice with a myeloid-specific deletion of ACC (ACCΔLysM). (B) Relative mRNA levels of Acaca and Acacb in BMDMs from flox or ACCΔLysM mice (n = 3). (C) Representative immunoblot of ACC after avidin pulldown of biotin-containing proteins from flox or ACCΔLysM BMDMs. Pyruvate carboxylase was used as a loading control. (D) Relative levels of lipid species in unstimulated BMDMs from flox and ACCΔLysM mice. Left: Number of lipids increased [fold change (FC) > 1.25] in unstimulated BMDMs from ACCΔLysM mice. Right: Number of lipids decreased (fold change < 1.25) in BMDMs from ACCΔLysM mice (n = 6). TAG, triacylglycerol; PE, phosphatidylethanolamine; PC, phosphatidylcholine; MAG, monoacylglycerol; SM, sphingomyelin; PS, phosphatidylserine; PI, phosphatidylinositol; LysoPC, lysophosphatidylcholine; DAG, diacylglycerol. (E) Volcano plot of RNA-seq from unstimulated flox or ACCΔLysM BMDMs (n = 4). (F) Glycolytic stress test of flox or ACCΔLysM BMDMs (n = 5). 2-DG, 2-deoxyglucose. (G) Basal glycolytic rate of flox or ACCΔLysM BMDMs (n = 5). (H) Stressed glycolytic rate of flox or ACCΔLysM BMDMs (n = 5). (I) Six-hour 2NDB-glucose uptake in flox or ACCΔLysM BMDMs (n = 8). (J) Lactate levels in supernatant of unstimulated flox or ACCΔLysM BMDMs after 6 hours (n = 6). (K) Bioenergetics phenogram reveals a shift to a more energetic phenotype in ACCΔLysM BMDMs. Data are represented as means ± SEM. Significance determined by one-tailed Welch’s t test (B and G to J) or two-tailed Student’s t test (D). *P < 0.05, **P < 0.01, and ***P < 0.001. (A) Created using BioRender.com. See also fig. S1, related to Fig. 1.
Fig. 2.
Fig. 2.. ACC regulates TLR-induced macrophage polarization.
(A) Schematic of M1 polarization of flox and ACCΔLysM BMDMs. (B) Relative mRNA expression of Il1b, Il6, Nos2, Il12a, and Il12b genes in flox or ACCΔLysM BMDMs stimulated for 6 hours with LPS (100 ng/ml) (n = 4). (C) Levels of IL-6 protein in supernatant of flox or ACC BMDMs stimulated with LPS for 18 hours (n = 4). n.d., not detected. (D) Levels of IL-1β protein in supernatant of flox or ACC BMDMs stimulated with LPS for 4 hours followed by cholesterol crystals for 18 hours (n = 3 to 4). (E) Relative mRNA expression of IL1B and Il6 in human MDMs pretreated with the ACC inhibitor (ACCi) firsocostat (10 μM) before stimulation with LPS (100 ng/ml) for 6 hours (n = 4 replicates). (F) Relative mRNA expression of Il1b, Il6, Nos2, Il12a, and Il12b genes in flox or ACCΔLysM BMDMs stimulated for 6 hours with LTA (1 μg/ml) (n = 4). (G) Levels of IL-6 protein in supernatant of flox or ACCΔLysM BMDMs stimulated with LTA for 18 hours (n = 4). Data are represented as means ± SEM. Significance determined by one-way analysis of variance (ANOVA) (B and D to F) or one-tailed Welch’s t test (C and G). *P < 0.05, **P < 0.01, ***P < 0.001, and ****P < 0.0001. (A) Created using BioRender.com. See also figs. S2 and S3, related to Fig. 2.
Fig. 3.
Fig. 3.. ACC deficiency inhibits LPS-induced macrophage polarization and effector function.
(A) Schematic showing experimental design of RNA-seq experiment from flox or ACCΔLysM BMDMs at baseline or after stimulation with LPS (100 ng/ml) for 6 hours. (B) Venn diagram showing number of genes uniquely regulated in flox or ACCΔLysM BMDMs stimulated with LPS and number of commonly regulated genes. (C) GO of genes with decreased expression [−log2 (fold change), P < 0.05)]. Processes related to inflammation highlighted in red. (D) Volcano plot showing relative gene expression of genes in LPS-stimulated ACCΔLysM BMDMs compared with LPS-stimulated flox controls. Blue circles represent genes related to the inflammatory response, and red circles represent lipid metabolism genes. (E) Heatmap showing relative expression of NFκB-induced genes in LPS-stimulated flox and ACCΔLysM BMDMs. (F) Heatmap showing relative expression of interferon-responsive genes in LPS-stimulated flox and ACCΔLysM BMDMs. (G) Relative H2DFCDA fluorescence in flox or ACCΔLysM BMDMs stimulated with LPS for 6 hours (n = 8). ns, not significant. (H) Fraction of engulfed E. coli killed by BMDMs 2 hours after engulfment (n = 12). (I) Percent engulfment of E. coli by flox or ACCΔLysM BMDMs after 30 min (n = 12). Data are represented as means ± SEM. Significance determined by one-way ANOVA (G) or one-tailed Welch’s t test (H and I). *P < 0.05 and **P < 0.01. (A) Created using BioRender.com.
Fig. 4.
Fig. 4.. ACC is dispensable for in vitro polarization in response to IL-4.
(A) Schematic of M2 polarization of flox and ACCΔLysM BMDMs. (B) Relative mRNA expression of M2 marker genes Arg1, Chil3, Mrc1, and Retnla in flox or ACCΔLysM BMDMs stimulated with vehicle or IL-4 (10 ng/ml) for 6 hours (n = 4). (C) Whole-cell immunoblot analysis of arginase protein levels in flox or ACCΔLysM BMDMs stimulated with IL-4 (10 ng/ml) for 6 hours (n = 3 mice per group). Vinculin was used as a loading control. (D) Flox or ACCΔLysM BMDMs were polarized with LPS (100 ng/ml) for 24 hours before repolarization with IL-4 (10 ng/ml) for an additional 24 hours, and expression of Arg1, Mrc1, and Retnla was measured (n = 4). Data are represented as means ± SEM. Significance determined by one-way ANOVA (B and D) or one-tailed Welch’s t test (C). **P < 0.01. ***P < 0.001, and ****P < 0.0001. (A and D) Created using BioRender.com. See also figs. S3 and S4, related to Fig. 4.
Fig. 5.
Fig. 5.. ACC in macrophages regulates the TLR-induced increase in aerobic glycolysis.
(A) BMDMs from flox or ACCΔLysM mice were stimulated with glucose ± LPS (100 ng/ml), and glycolytic rate was assessed by following ECAR for 6 hours before sequential stimulation with oligomycin and 2-deoxyglucose. The LPS-induced increase in ECAR approximately 30 min after LPS stimulation (early ΔECAR) and approximately 6 hours after LPS stimulation (6 hour ΔECAR) is represented with shaded areas (n = 4). (B) Quantification of LPS-induced ΔECAR in flox and ACCΔLysM BMDMs (n = 4). (C) Flox and ACCΔLysM BMDMs were stimulated with LPS for 16 hours before assessment of glycolytic rate, glucose uptake, and mitochondrial function. (D) Glycolytic stress test of flox or ACCΔLysM BMDMs after stimulation with LPS (n = 5). (E) Quantification of LPS-induced change in stressed ECAR in flox or ACCΔLysM BMDMs after 16 hours of stimulation with LPS (n = 5). (F) 2NDB-glucose uptake in flox or ACCΔLysM BMDMs stimulated with LPS (n = 8). (G) Flox or ACCΔLysM BMDMs were stimulated with LPS for 16 hours, and OCR was measured (n = 5 to 6). (H) LPS-induced change in maximal OCR in flox or ACCΔLysM BMDMs (n = 5 to 6). (I) Flox or ACCΔLysM BMDMs were stimulated with IL-4 for 6 hours before mitochondrial stress test (n = 6). (J) Quantification of IL-4–induced change in maximal OCR (n = 6). Data represented as means ± SEM. Significance determined by one-tailed Welch’s t test (B, E, H, and J) or one-way ANOVA (F). *P < 0.05 and **P < 0.01. (C and I) Created using BioRender.com. See also fig. S5, related to Fig. 5.
Fig. 6.
Fig. 6.. ACC is required for LPS-induced rewiring of the macrophage lipidome.
(A) Schematic of lipidomic analysis workflow from flox or ACCΔLysM BMDMs stimulated with LPS (100 ng/ml) for 6 hours. (B) Volcano plots representing fold change of lipid species abundance in flox or ACCΔLysM BMDMs stimulated with LPS (100 ng/ml) for 6 hours (n = 6). (C) Heatmap of significantly increased phosphatidylethanolamine (PE) species in LPS-stimulated flox and ACCΔLysM BMDMs, relative to respective unstimulated cells (n = 6). (D) Heatmap of significantly increased phosphatidylcholine (PC) species in LPS-stimulated flox and ACCΔLysM BMDMs relative to respective unstimulated cells (n = 6). (E) Levels of 16:0/20:4 phosphatidylcholine in flox or ACCΔLysM BMDMs stimulated with LPS (100 ng/ml) for 6 hours (n = 6). (F) Schematic showing fates of acetyl-CoA in the de novo lipogenesis and sterol biosynthesis pathways. (G) Levels of cholesterol in flox or ACCΔLysM BMDMs stimulated with LPS (100 ng/ml) for 6 hours (n = 4 to 6). Data are represented as means ± SEM (E and G). Significance determined by two-tailed Student’s t test (C and D) or one-way ANOVA (E and G). *P < 0.05, **P < 0.01, and ***P < 0.001. (A) Created using BioRender.com. See also fig. S6, related to Fig. 6.
Fig. 7.
Fig. 7.. Genetic or pharmacologic manipulation of ACC1 and ACC2 attenuates LPS-induced peritoneal inflammation but exacerbates bacterial peritonitis in mice.
(A) Experimental schematic of LPS-induced model of systemic inflammation. (B) Survival curves of male flox or ACCΔLysM mice after intraperitoneal LPS administration (n = 16). (C) Peritoneal lavage cytokine levels 6 hours after LPS administration (n = 5 to 6). (D) Plasma cytokine levels 6 hours after LPS administration (n = 5 to 6). (E) Relative mRNA levels in peritoneal cells from flox or ACCΔLysM mice 6 hours after LPS (n = 5 to 6). (F) C57BL/6J mice were injected with LPS (2 mg/kg) and either DMSO control or firsocostat (25 mg/kg), and cytokines and peritoneal cell mRNA expression were measured at 6 hours. (G) Peritoneal lavage cytokine levels 6 hours after LPS (n = 5 to 6). (H) Plasma cytokine levels 6 hours after LPS (n = 5 to 6). (I) Relative mRNA levels in peritoneal cells isolated 6 hours after LPS administration (n = 5 to 6). For (G) to (I), one outlier in the firsocostat treatment group was removed (ROUT Q = 1%). (J) C57BL/6J mice were pretreated with firsocostat (25 mg/kg) before E. coli inoculation [~9 × 10⁶ colony-forming units (CFUs) per mouse] or saline. (K) Survival of mice pretreated with control or firsocostat before E. coli inoculation or saline (saline, n = 3; E. coli, n = 5). (L) Peritoneal lavage of inoculated mice was serially diluted, and bacterial CFUs were estimated (n = 5). Data represented as means ± SEM. Significance determined by one-tailed Welch’s t test (C to E and G to I), Mantel-Cox test (B and K), or one-tailed Mann-Whitney test (L). *P < 0.05 and **P < 0.01. (A, F, J, and L) Created using BioRender.com.

References

    1. O’Neill L. A. J., Kishton R. J., Rathmell J.,A guide to immunometabolism for immunologists. Nat. Rev. Immunol. 16,553–565 (2016). - PMC - PubMed
    1. Freemerman A. J., Zhao L., Pingili A. K., Teng B., Cozzo A. J., Fuller A. M., Johnson A. R., Milner J. J., Lim M. F., Galanko J. A., Beck M. A., Bear J. E., Rotty J. D., Bezavada L., Smallwood H. S., Puchowicz M. A., Liu J., Locasale J. W., Lee D. P., Bennett B. J., Abel E. D., Rathmell J. C., Makowski L.,Myeloid Slc2a1-deficient murine model revealed macrophage activation and metabolic phenotype are fueled by GLUT1. J. Immunol. 202,1265–1286 (2019). - PMC - PubMed
    1. Tannahill G. M., Curtis A. M., Adamik J., Palsson-McDermott E. M., McGettrick A. F., Goel G., Frezza C., Bernard N. J., Kelly B., Foley N. H., Zheng L., Gardet A., Tong Z., Jany S. S., Corr S. C., Haneklaus M., Caffrey B. E., Pierce K., Walmsley S., Beasley F. C., Cummins E., Nizet V., Whyte M., Taylor C. T., Lin H., Masters S. L., Gottlieb E., Kelly V. P., Clish C., Auron P. E., Xavier R. J., O’Neill L. A. J.,Succinate is an inflammatory signal that induces IL-1β through HIF-1α. Nature 496,238–242 (2013). - PMC - PubMed
    1. Huang S. C.-C., Everts B., Ivanova Y., O’Sullivan D., Nascimento M., Smith A. M., Beatty W., Love-Gregory L., Lam W. Y., O’Neill C. M., Yan C., Du H., Abumrad N. A., Urban J. F. Jr., Artyomov M. N., Pearce E. L., Pearce E. J.,Cell-intrinsic lysosomal lipolysis is essential for alternative activation of macrophages. Nat. Immunol. 15,846–855 (2014). - PMC - PubMed
    1. Vats D., Mukundan L., Odegaard J. I., Zhang L., Smith K. L., Morel C. R., Greaves D. R., Murray P. J., Chawla A.,Oxidative metabolism and PGC-1β attenuate macrophage-mediated inflammation. Cell Metab. 4,13–24 (2006). - PMC - PubMed

Supplementary concepts