. 2022 Nov 22;41(8):111704.
doi: 10.1016/j.celrep.2022.111704.

MYC regulates a pan-cancer network of co-expressed oncogenic splicing factors

Affiliations

MYC regulates a pan-cancer network of co-expressed oncogenic splicing factors

Laura Urbanski et al. Cell Rep. .

Abstract

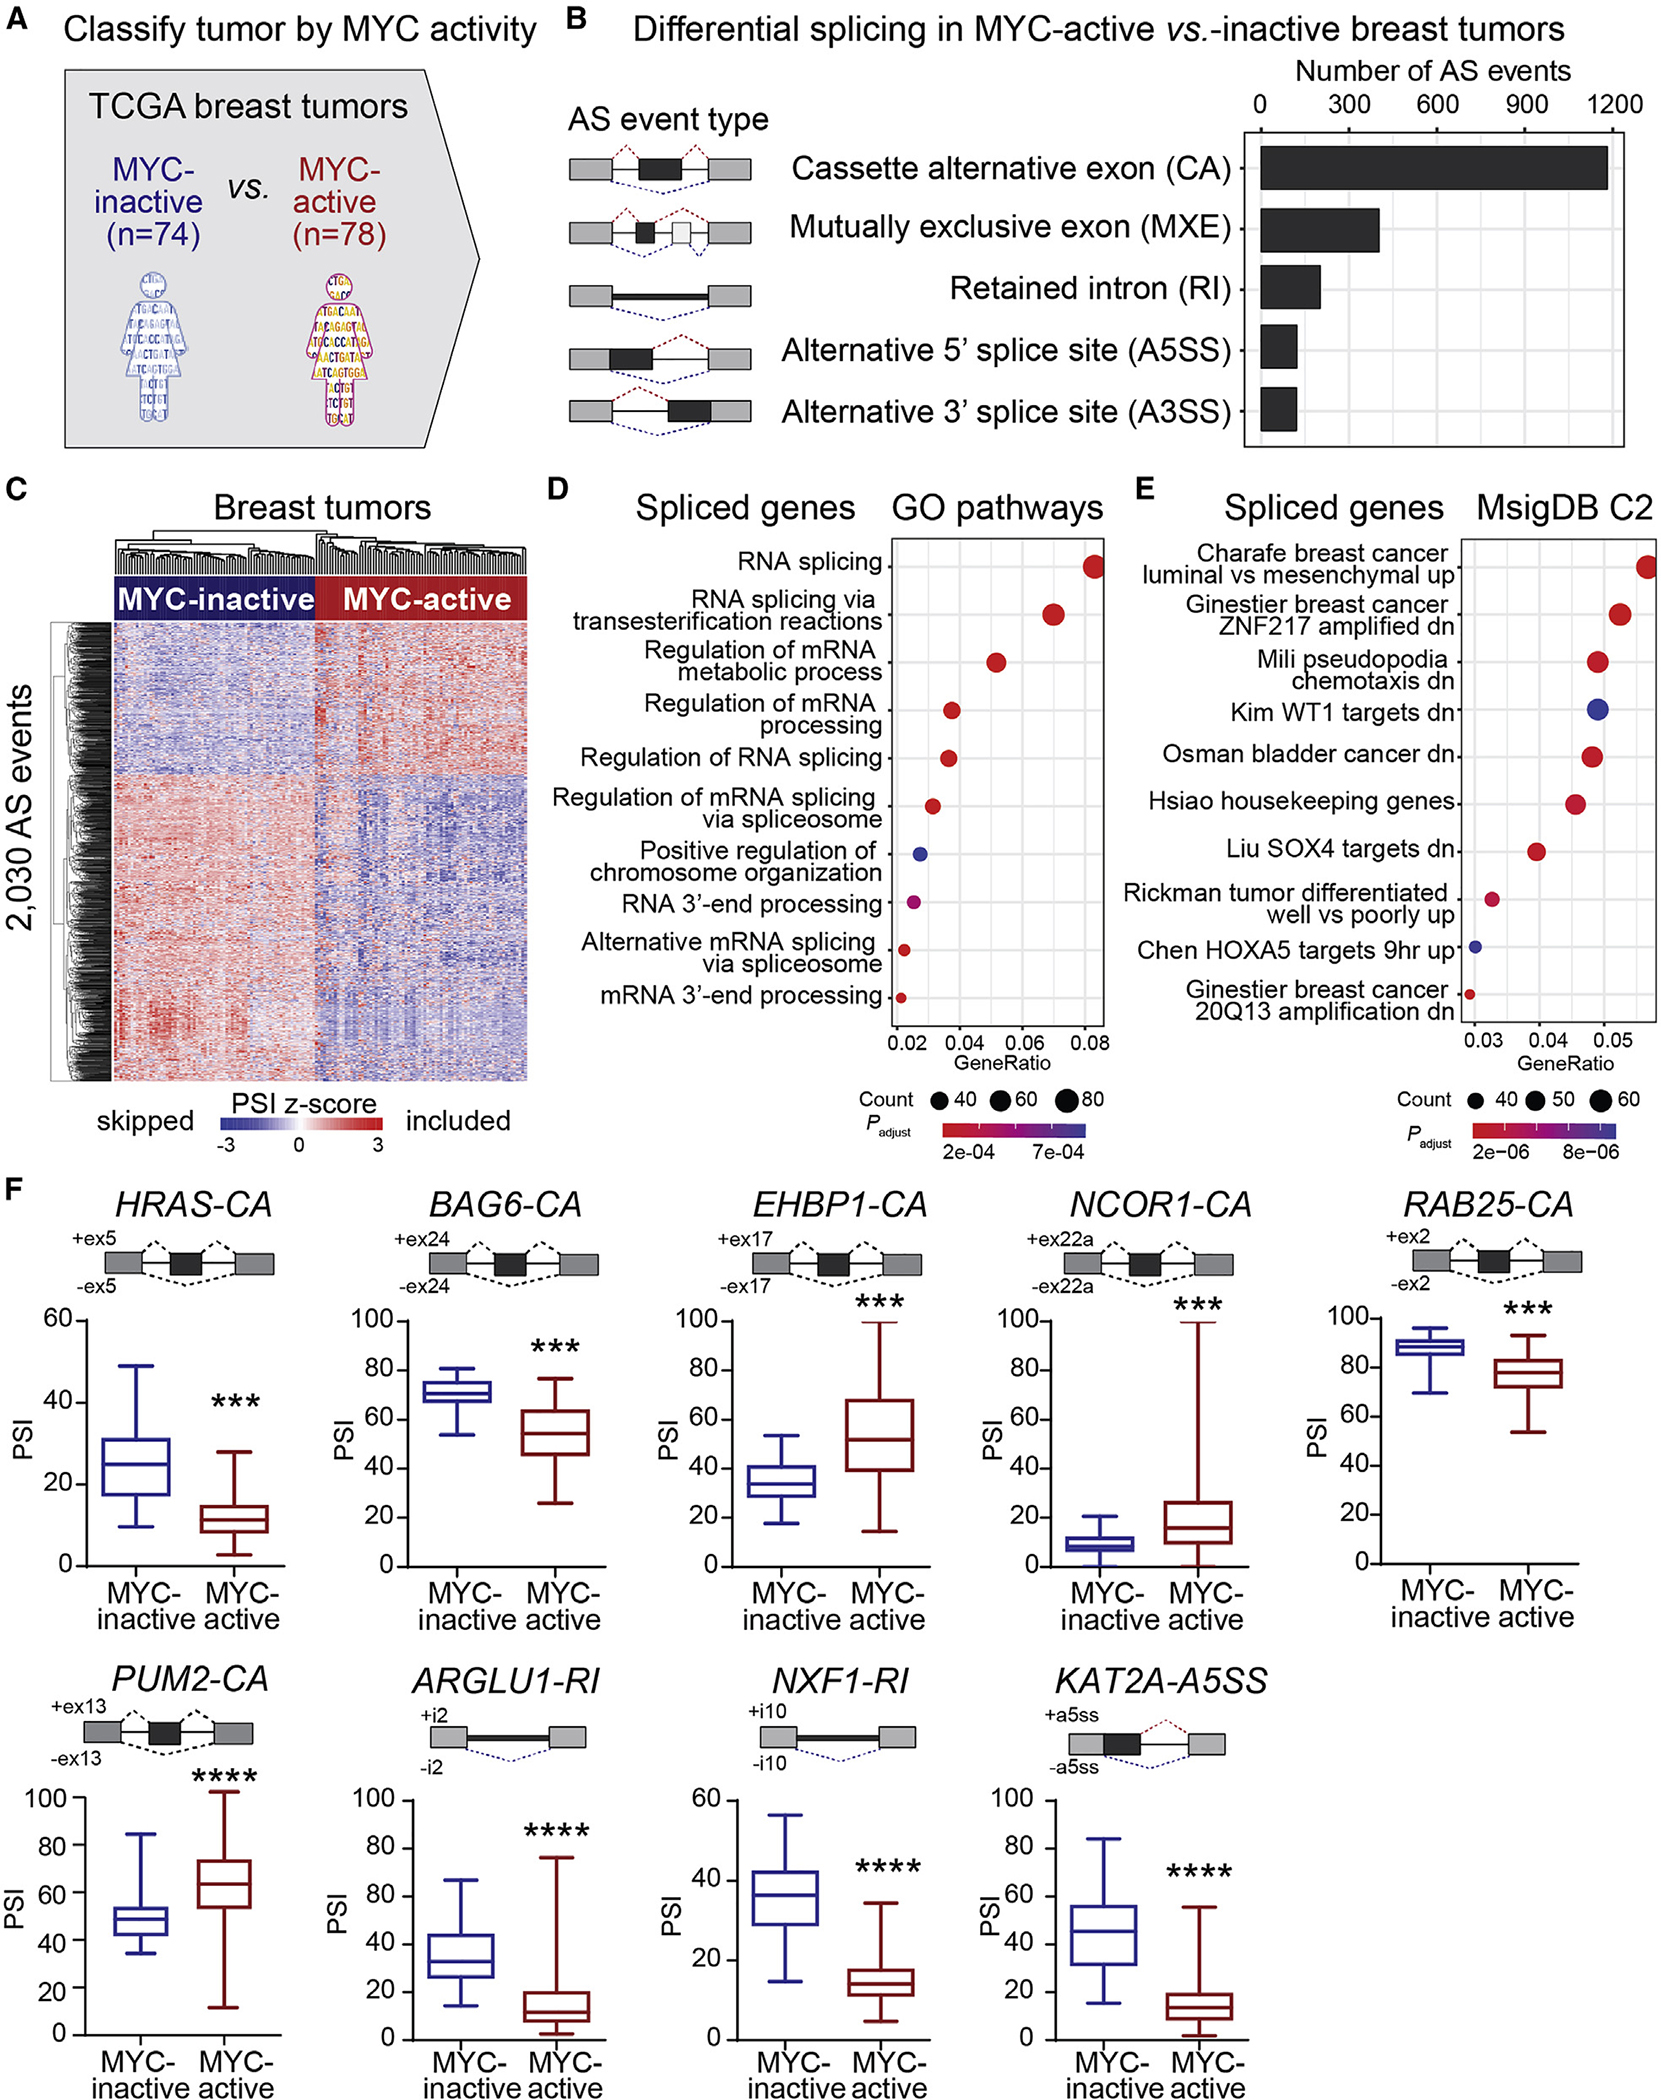
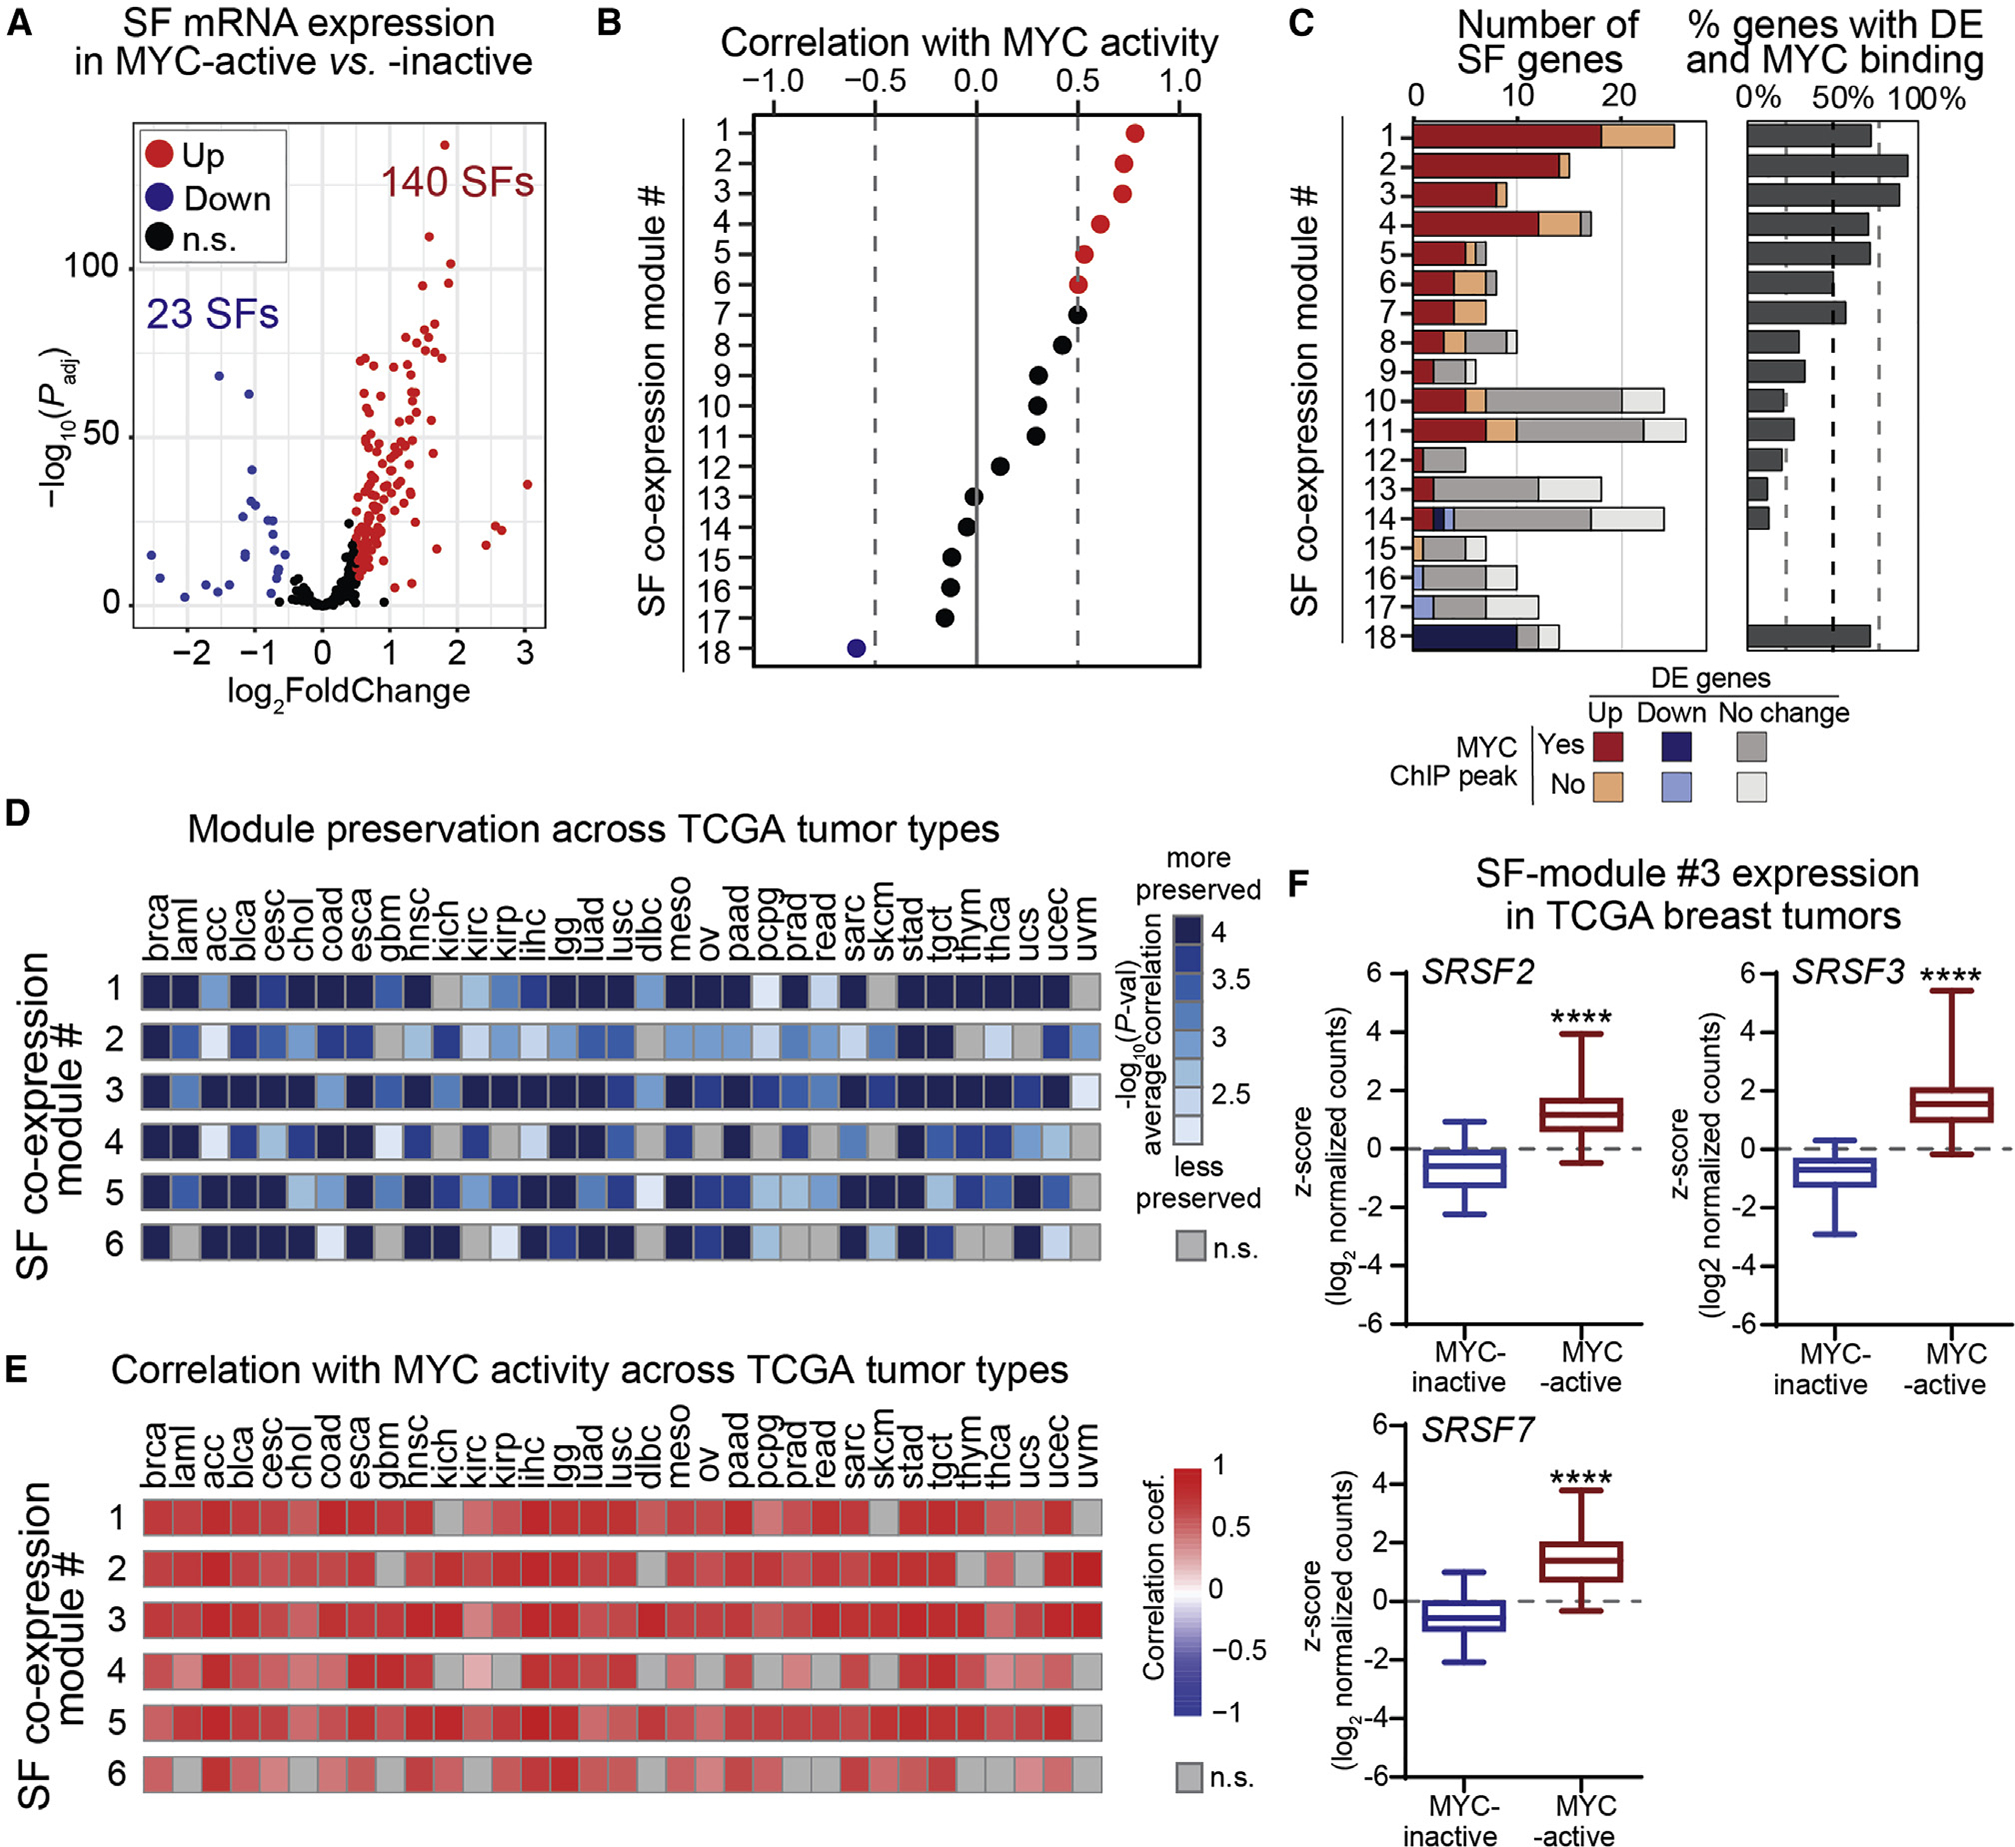
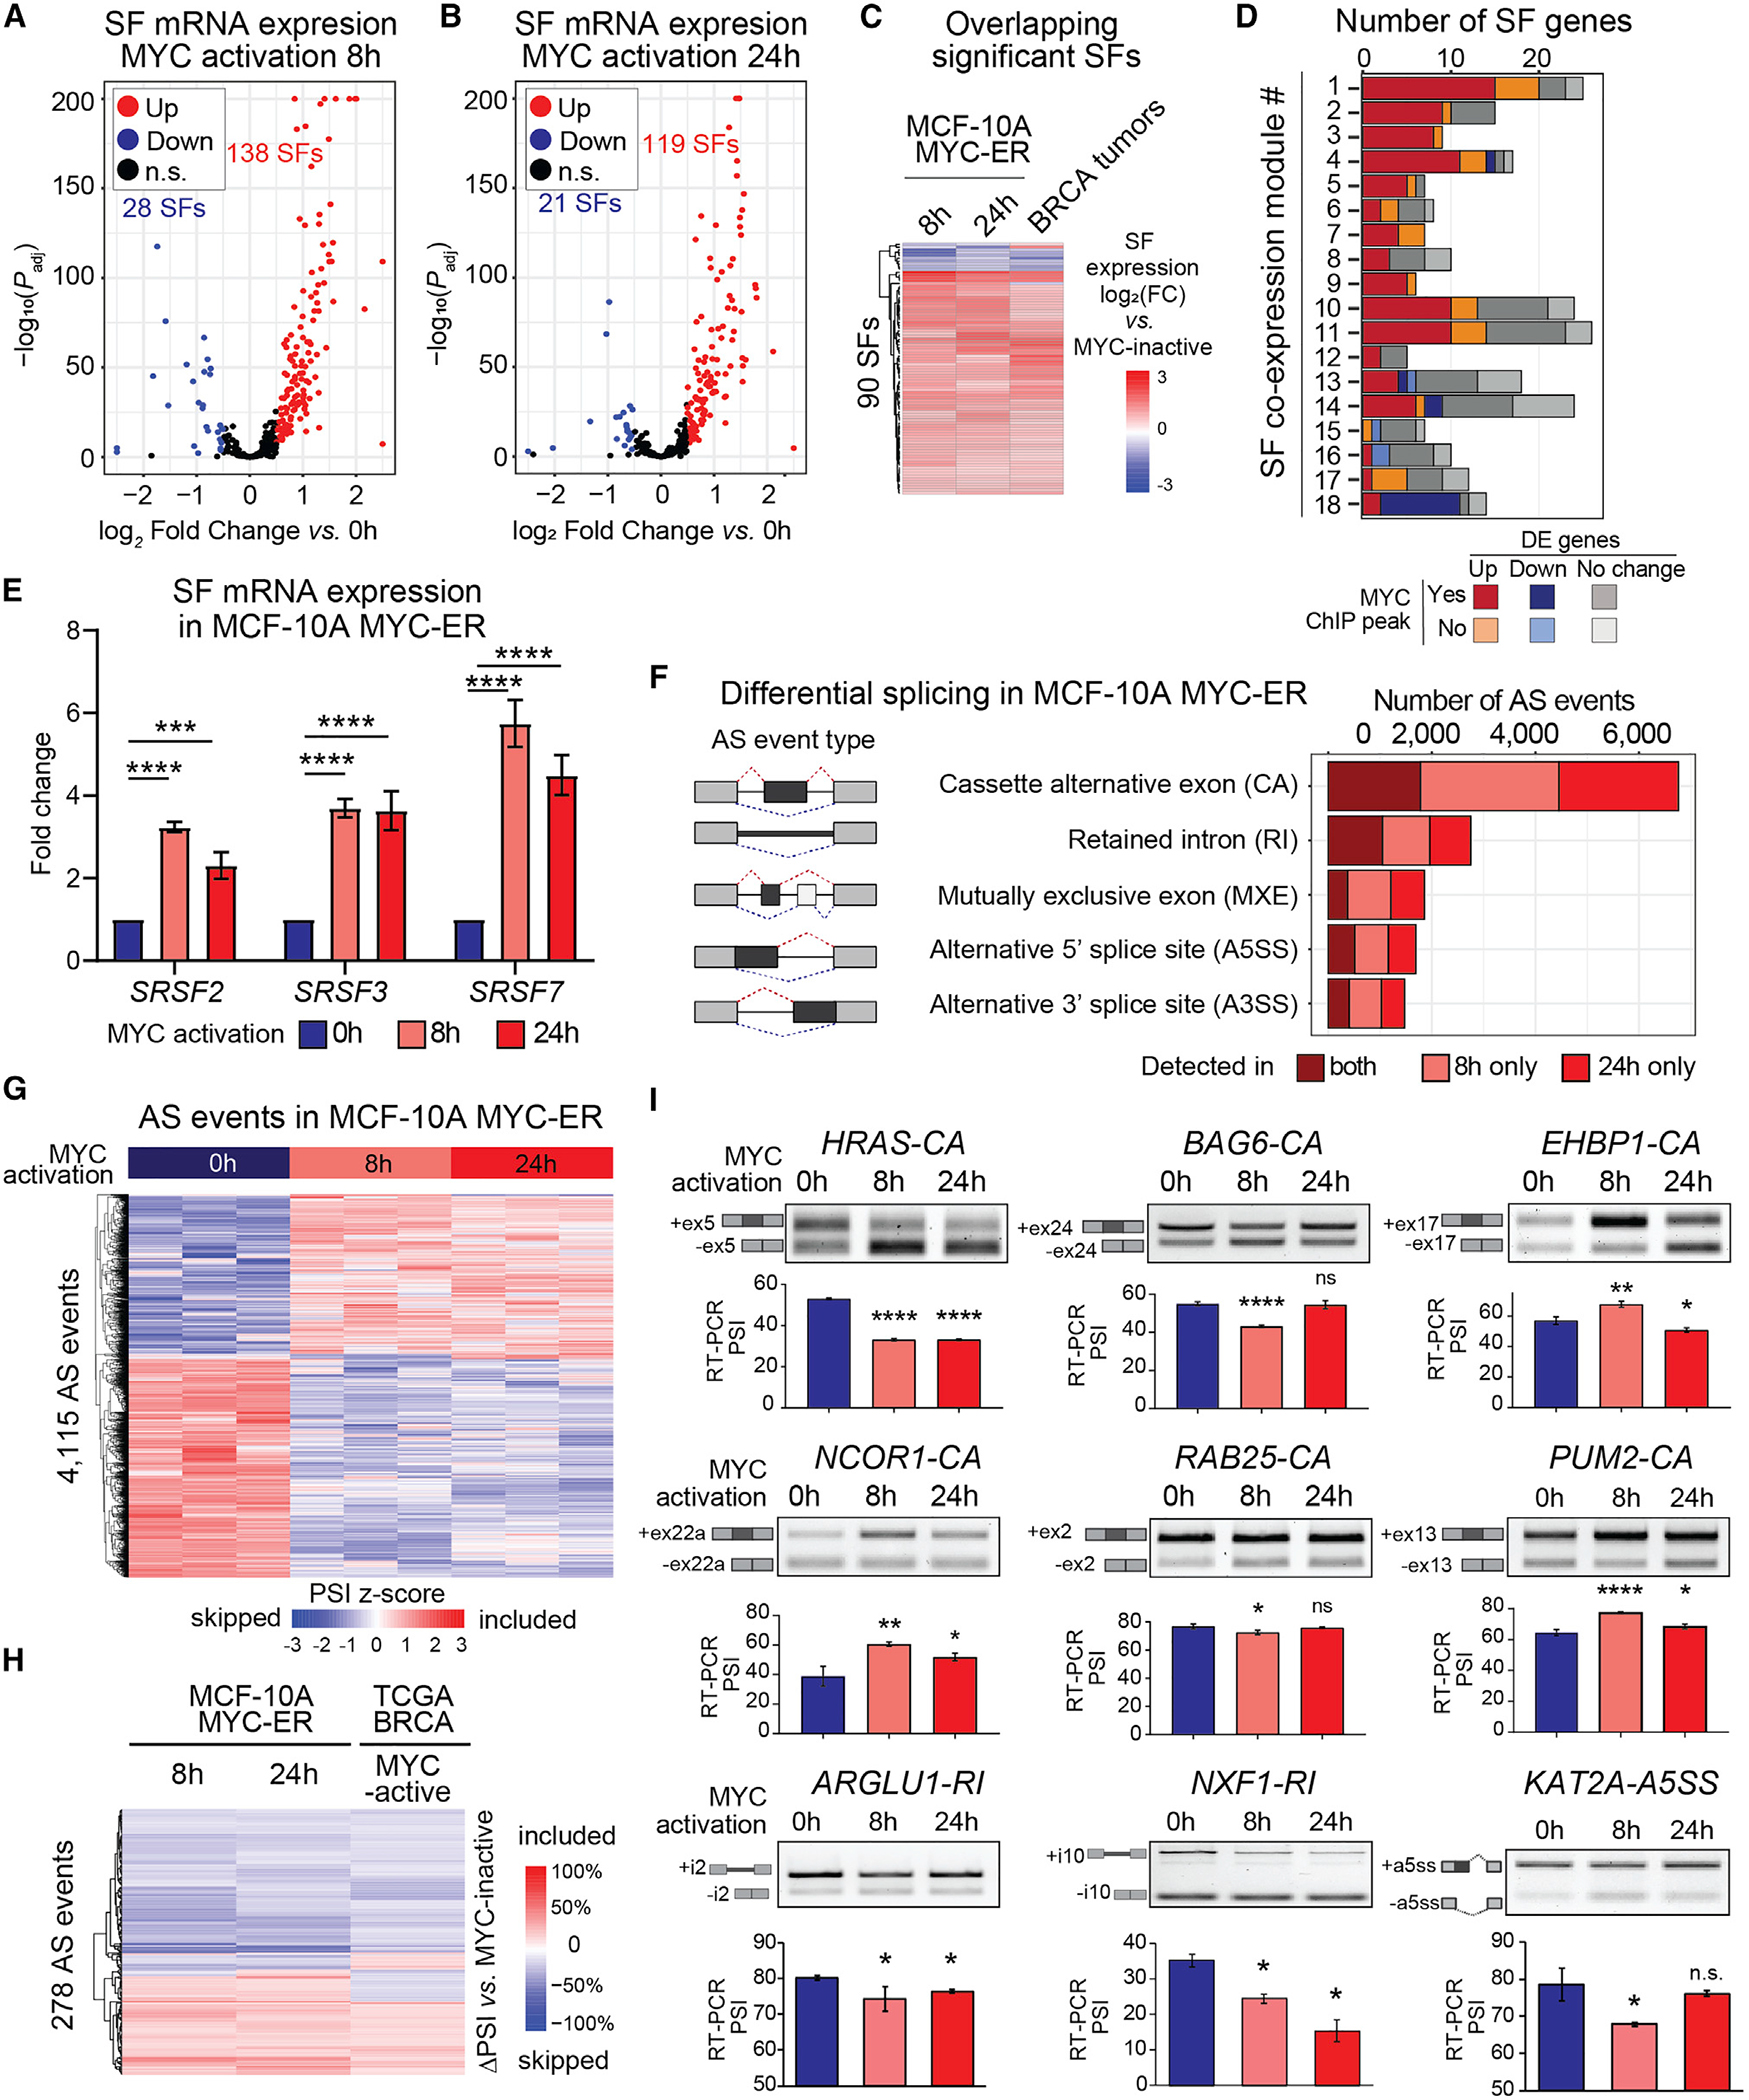
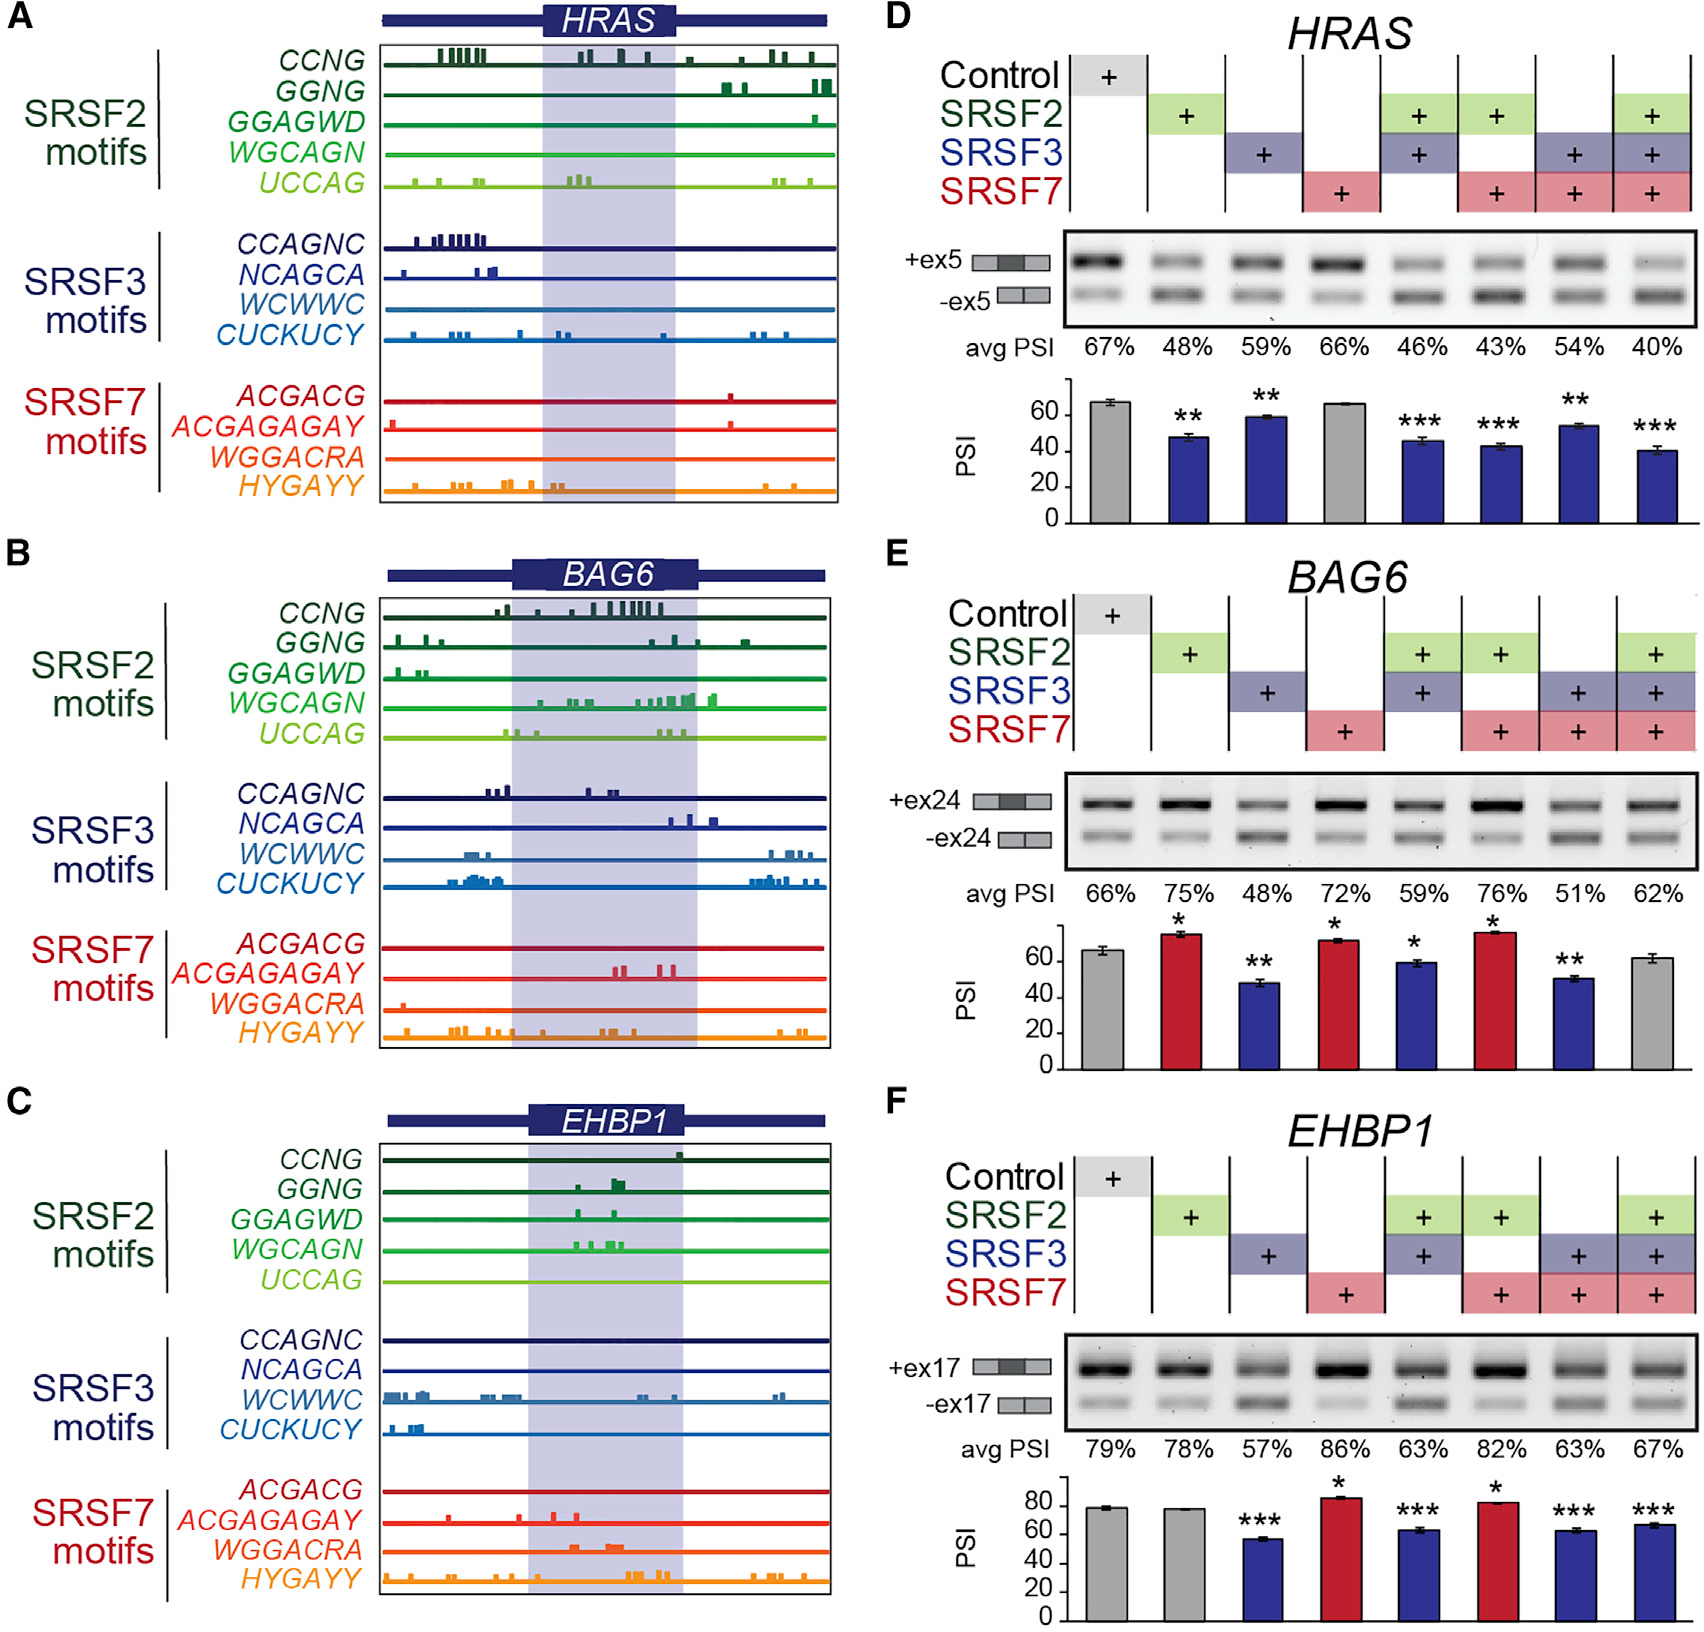
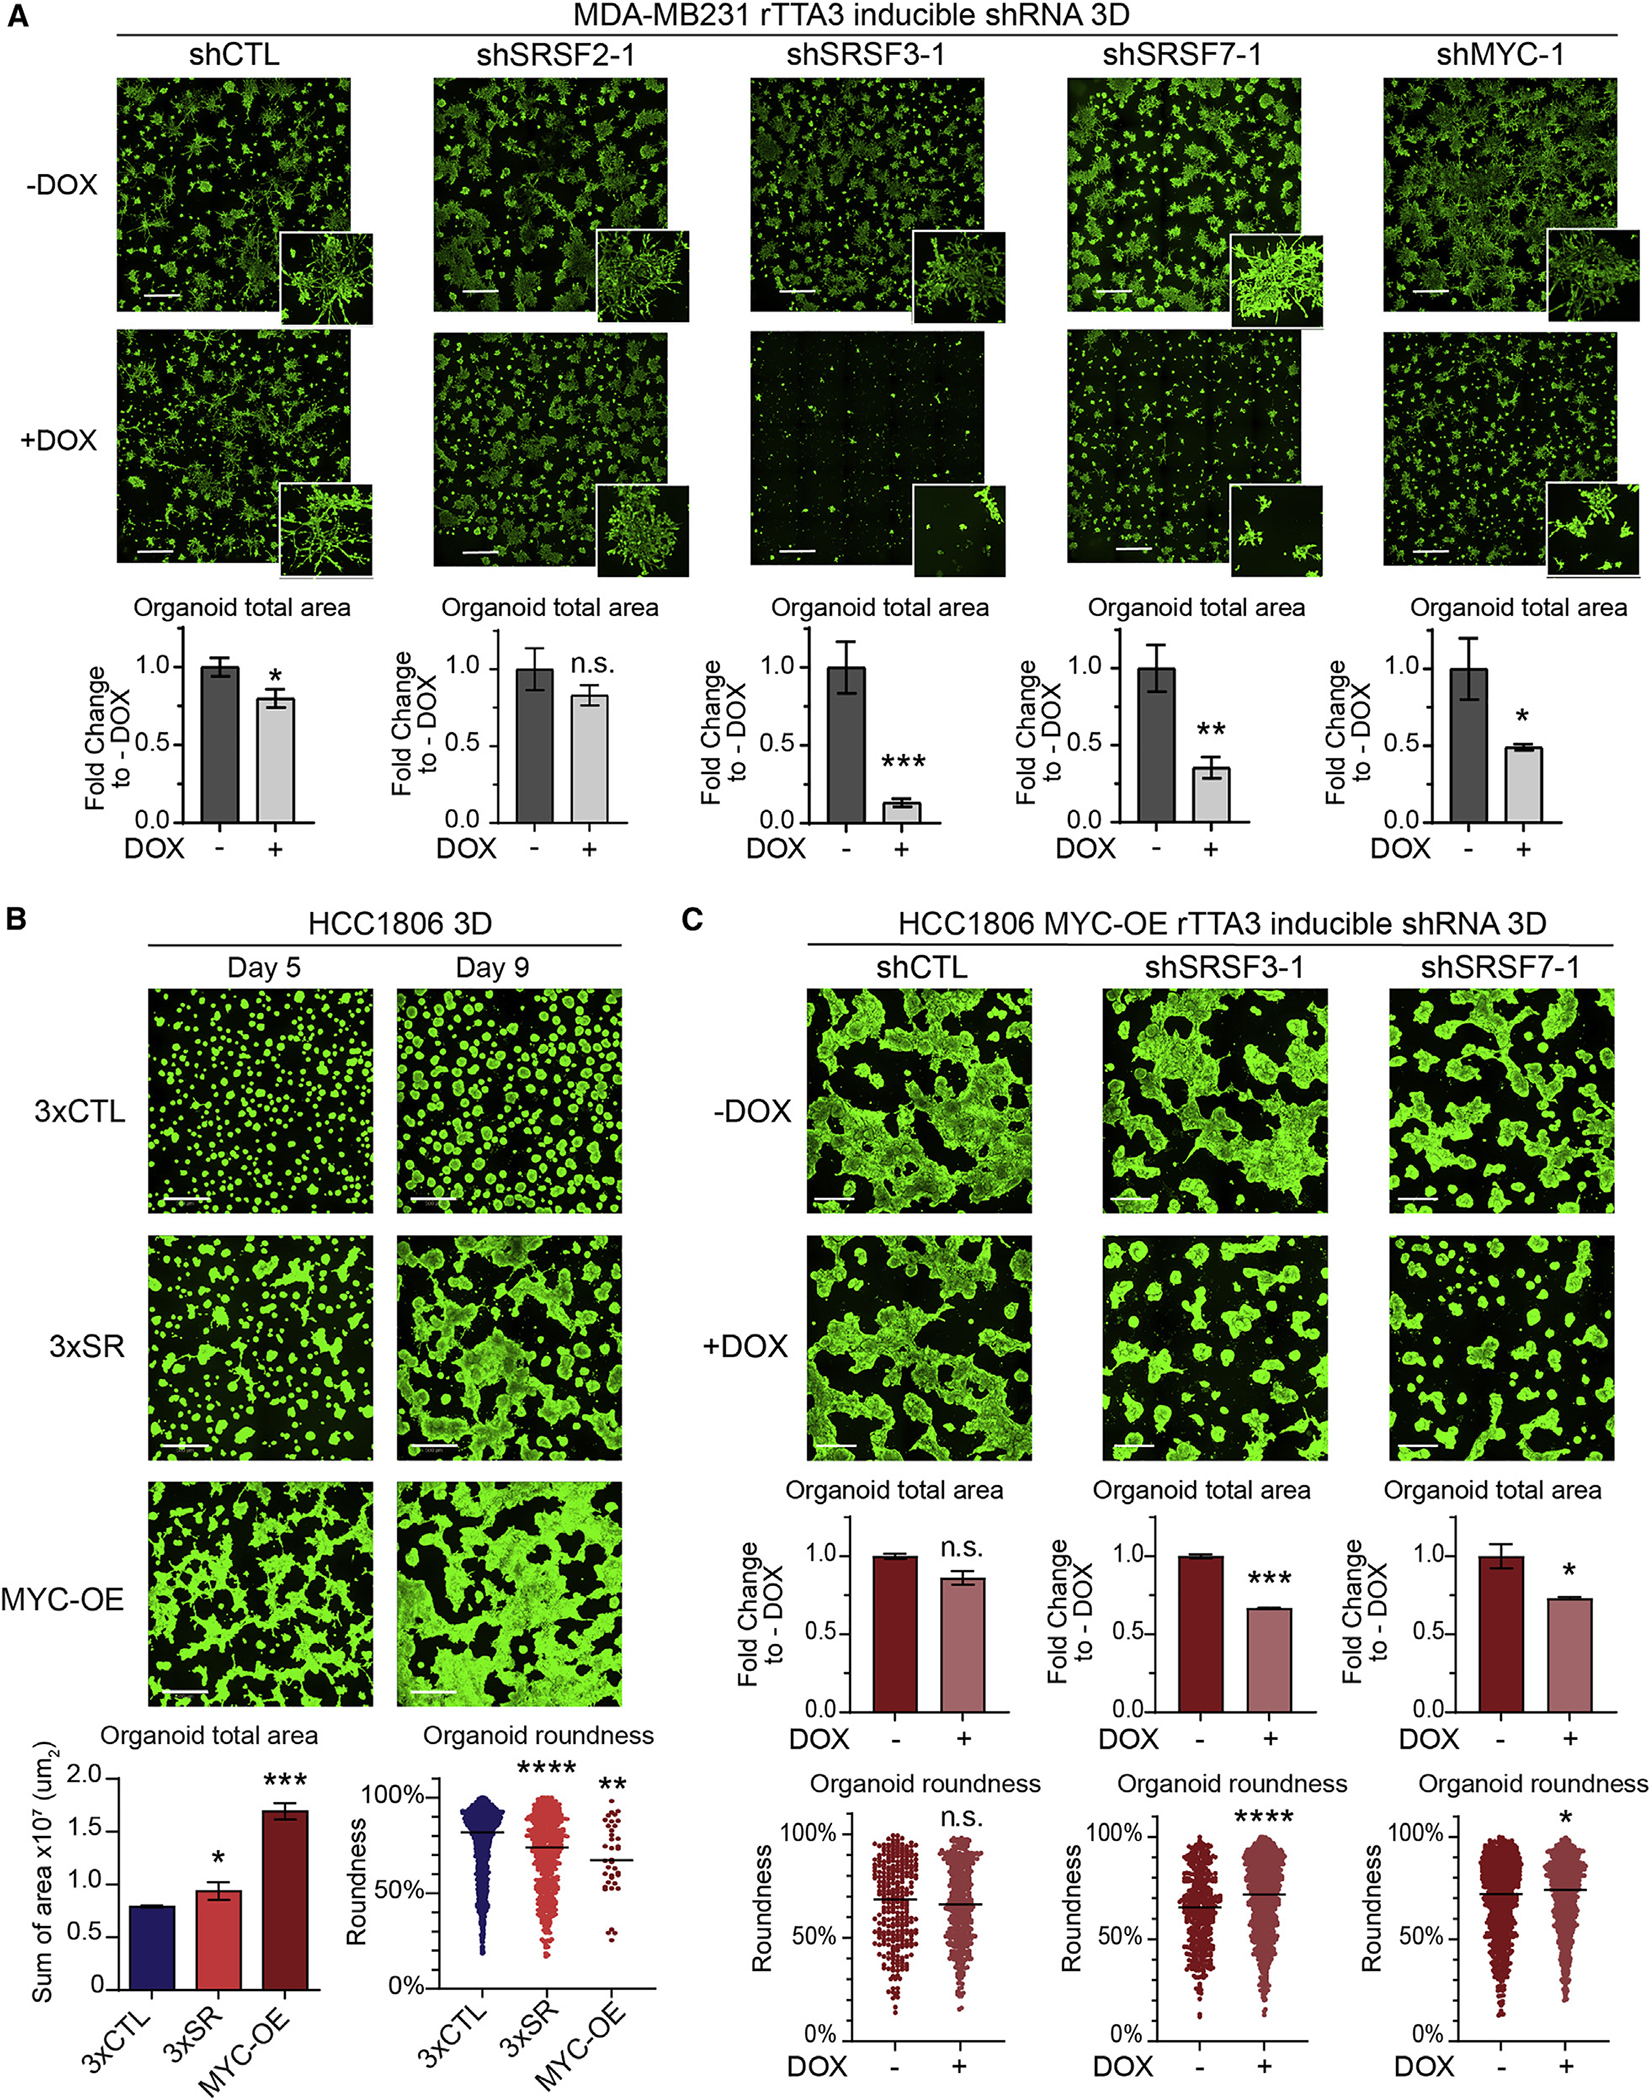
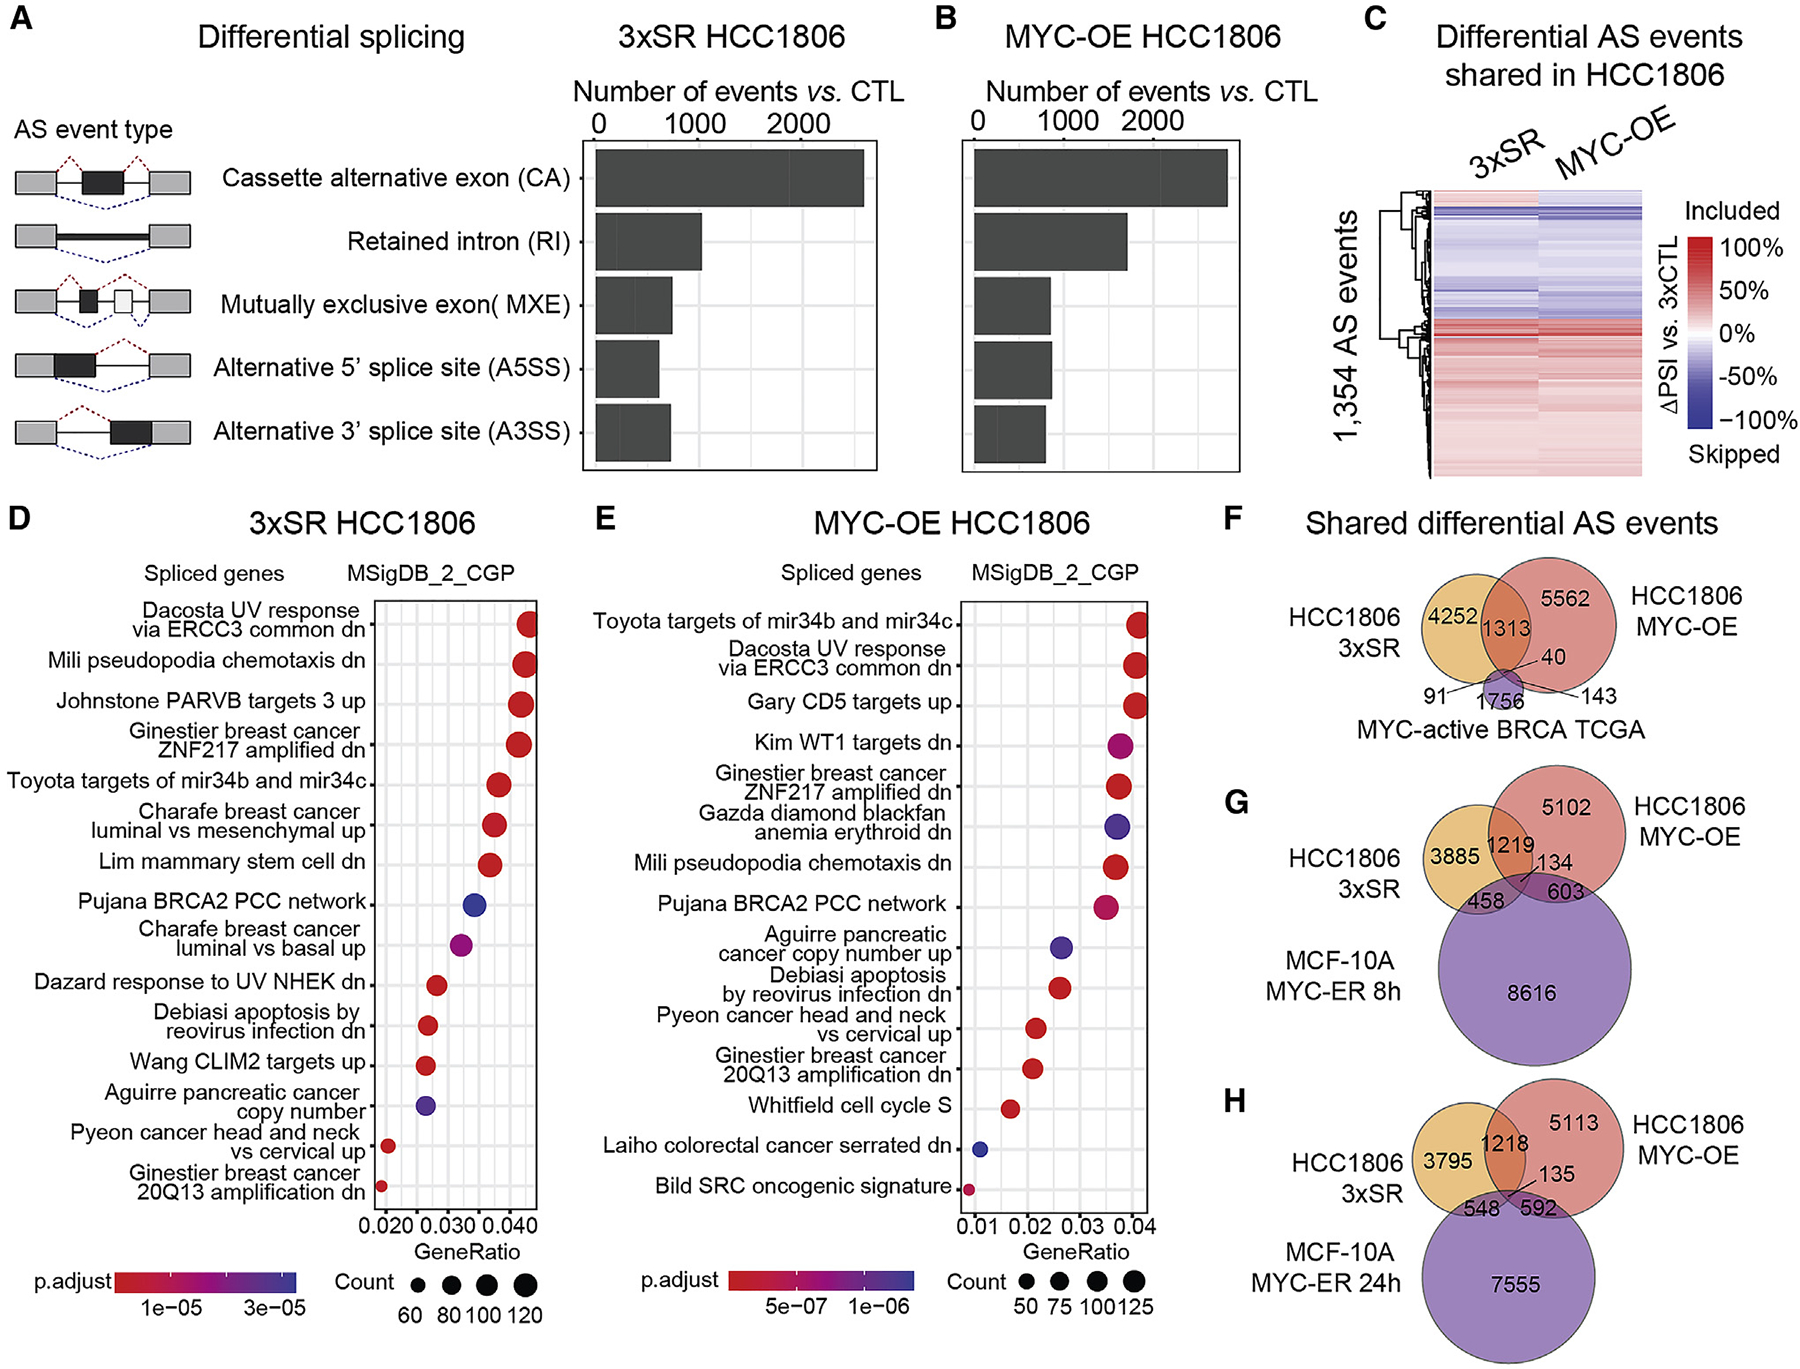
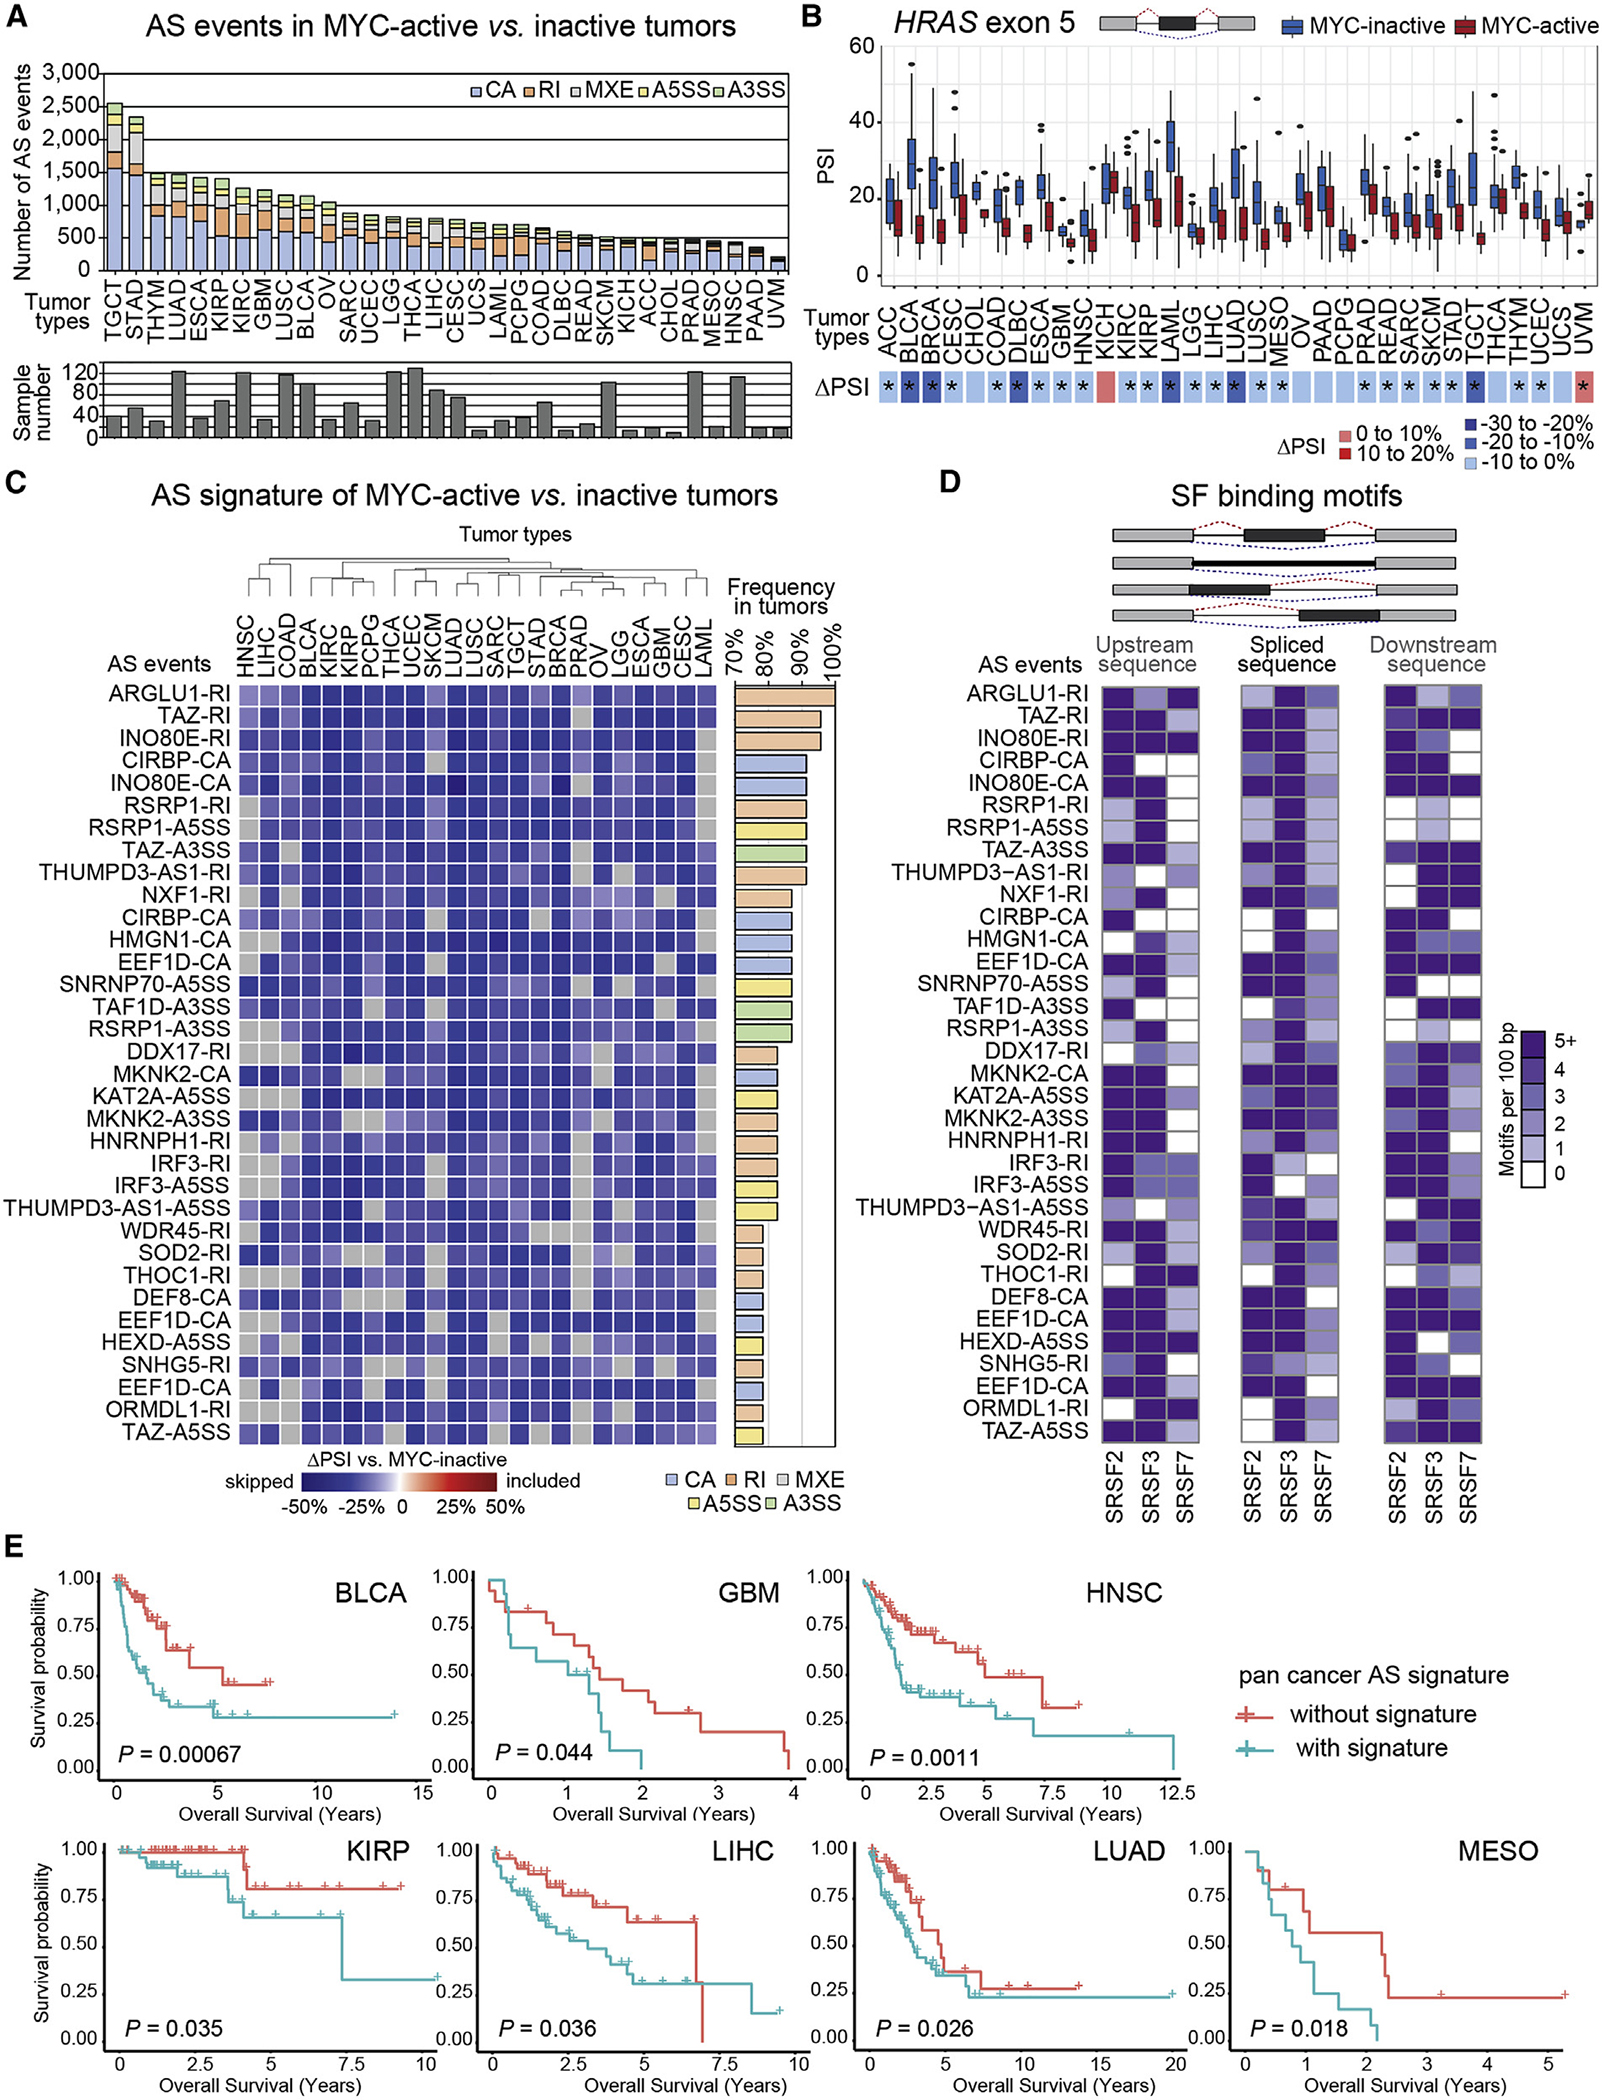
MYC is dysregulated in >50% of cancers, but direct targeting of MYC has been clinically unsuccessful. Targeting downstream MYC effector pathways represents an attractive alternative. MYC regulates alternative mRNA splicing, but the mechanistic links between MYC and the splicing machinery in cancer remain underexplored. Here, we identify a network of co-expressed splicing factors (SF-modules) in MYC-active breast tumors. Of these, one is a pan-cancer SF-module correlating with MYC activity across 33 tumor types. In mammary cell models, MYC activation leads to co-upregulation of pan-cancer module SFs and to changes in >4,000 splicing events. In breast cancer organoids, co-overexpression of the pan-cancer SF-module induces MYC-regulated splicing events and increases organoid size and invasiveness, while knockdown decreases organoid size. Finally, we uncover a MYC-activity pan-cancer splicing signature correlating with survival across tumor types. Our findings provide insight into the mechanisms of MYC-regulated splicing and for the development of therapeutics for MYC-driven tumors.

Keywords: CP: Cancer; MYC; RNA splicing; SR proteins; alternative splicing; breast cancer; cancer; co-expression analysis; co-expression modules; oncogenes; organoids; pan-cancer; splicing factors.


Conflict of interest statement

Declaration of interests O.A. and N.K.L. are inventors on a patent application filed by The Jackson Laboratory related to modulating splicing factors.

Figures

Figure 1.
Figure 1.. MYC-active breast tumors exhibit a unique AS signature
(A) TCGA breast tumors were classified by MYC activity, calculated using MYC target expression. MYC-active and MYC-inactive tumors were defined by a Z score >1.5 and <−1.5, respectively. (B) AS events in MYC-active vs. MYC-inactive breast tumors (ΔPSI > |10%|, FDR < 0.05). (C) Hierarchical clustering of AS events in MYC-active and MYC-inactive breast tumors. Rows represent PSI normalized across samples per AS event. (D and E) Gene ontology analysis using GO gene sets (D) and MSigDB signatures (E) for MYC-active spliced genes. (F) PSI for AS events in MYC-active vs. MYC-inactive breast tumors (median ± interquartile range; t test, ****p < 0.0001, ***p < 0.001). Gene name and event types are indicated. See also Figure S1 and Table S1.
Figure 2.
Figure 2.. SF co-expression modules correlate with MYC activity in breast tumors and across multiple cancer types
(A) SF differential expression in MYC-active vs. MYC-inactive TCGA breast tumors (log2FoldChange > |0.5|; FDR < 0.05). (B) Correlation of SF-module expression with MYC activity in TCGA breast tumors. (C) Gene number per SF-module, including differentially expressed (DE) genes in MYC-active tumors and genes with MYC promoter binding peaks in MCF-10A ChIP-seq data.,,, (D) Preservation of the top six breast SF-modules across TCGA tumor types using NetRep. (E) Correlation co-efficient of the top six breast SF-modules with MYC activity across TCGA tumor types. (F) Expression of pan-cancer SF-module hub genes in MYC-active vs. MYC-inactive TCGA breast tumors (median ± interquartile range; t test, ****p < 0.0001). See also Figure S2 and Table S2.
Figure 3.
Figure 3.. MYC activation induces changes in SF expression and AS in human mammary epithelial cells
(A and B) SF differential expression in MCF-10A MYC-ER cells at 8 h (A) or 24 h (B) vs. 0 h after MYC activation (n = 3; log2FoldChange > |0.5|; FDR < 0.05). (C) Differentially expressed (DE) SFs shared across MYC-active MCF-10A cells and TCGA breast tumors (log2FoldChange > |0.5|; FDR < 0.05). (D) Gene number per SF-module in MYC-active MCF-10A, including DE genes and genes with MYC promoter binding peaks in MCF-10A ChIP-seq data.,,, (E) mRNA expression (qPCR) of pan-cancer SF-module hub genes in MYC-active MCF-10A cells, normalized to 0 h and GAPDH (n = 3; mean ± SD; two-way ANOVA; ***p < 0.001, ****p < 0.0001). (F) AS events in MYC-active MCF-10A cells (n = 3; |ΔPSI| ≥ 10%; FDR < 0.05). (G) Hierarchical clustering of AS events in MYC-active MCF-10A cells (n = 3/condition; |ΔPSI| ≥ 10%; FDR < 0.05). Rows represent PSI normalized across samples per AS event. (H) Overlapping AS events in MYC-active MCF-10A cells and TCGA breast tumors (|ΔPSI| ≥ 10%; FDR < 0.05). (I) RT-PCR validation of MYC-regulated AS events in MYC-active MCF-10A cells. Representative gels show isoform structures with AS quantified as PSI from RT-PCR (n = 3; mean ± SD; t test, *p < 0.05, **p < 0.01, ****p < 0.0001, n.s., not significant). Gene names and event types are indicated. See also Figure S3 and Table S3.
Figure 4.
Figure 4.. MYC-regulated AS events display binding motifs for and are regulated by pan-cancer SF-module hub genes
(A–C) Predicted binding motifs for SRSF2, SRSF3, and SRSF7 in spliced sequences (boxed) and surrounding introns (100 bp) of MYC-regulated AS events. (D–F) MYC-regulated AS events in HEK293 cells transfected with the coding sequence of one, two, or three SFs, or control plasmids, measured by RT-PCR. Representative gels show isoform structures with AS quantified as PSI from RT-PCR (n = 3; mean ± SD; t test, *p < 0.05, **p < 0.001, ***p < 0.0001). See also Figures S4 and S5.
Figure 5.
Figure 5.. Pan-cancer SF-module hub genes control breast cancer organoid size and invasiveness
(A) Representative images of 3D-grown MDA-MB231-rTTA3 cells expressing DOX-inducible shRNA targeting SRSF2, SRSF3, SRSF7, MYC, or control (CTL) stained with calcein (scale bars, 1 mm) and total organoid area quantified at day 9 (n = 3, 25 fields/replicate; mean ± SD; t test, *p < 0.05, **p < 0.01, ***p < 0.0001; n.s., not significant). Insets show a zoomed-in view of representative organoids morphology. (B) Representative images of 3D-grown 3×CTL, 3×SR, and MYC-OE HCC1806 organoids at days 5 and 9 stained with calcein (scale bars, 500 μm) and total organoid area (n = 3, 15 fields/replicate; mean ± SD; t test, *p < 0.05, ***p < 0.001) and roundness (n = 3, 15 fields/replicate; median; t test, **p < 0.01, ****p < 0.0001) quantified at day 9. (C) Representative images of 3D-grown MYC-OE-rTTA3 HCC1806 organoids expressing DOX-inducible shRNA targeting SRSF3, SRSF7, or CTL stained with calcein (scale bars, 500 μm), and total organoid area (n = 2–3, 25 fields/replicate; mean ± SD; t test, *p < 0.05, ***p < 0.001; n.s., not significant) and roundness (n = 2–3, 25 fields/replicate; median; t test, *p < 0.05, ****p < 0.0001) quantified at day 9. See also Figures S5 and S6.
Figure 6.
Figure 6.. Overexpression of pan-cancer SF-module hub genes together leads to changes in MYC-regulated AS events
(A and B) AS events in 3×SR (A) or MYC-OE (B) vs. 3×CTL HCC1806 cells (n = 3/condition; ΔPSI ≥ |10%|; FDR < 0.05). (C) Overlapping AS events in 3×SR and MYC-OE vs. 3×CTL HCC1806 cells. (D and E) Gene ontology analysis using MSigDB signatures for spliced genes in 3×SR (D) and MYC-OE (E) HCC1806 cells. (F–H) Overlapping AS events in 3×SR cells and MYC-OE HCC1806 cells and in MYC-active TCGA breast tumors (F) or MYC-active MCF-10A cells (G and H). See also Figures S7 and S8 and Table S4.
Figure 7.
Figure 7.. Pan-cancer AS signature correlates with MYC activity and worse patient survival
(A) AS events in MYC-active vs. MYC-inactive TCGA tumors (ΔPSI > |10%|, FDR < 0.05), across tumor types (see Table S2E). (B) PSI of HRAS AS event in MYC-active vs. MYC-inactive tumors, shown per tumor type (median ± interquartile range). ΔPSI (MYC-active vs. MYC-inactive) by tumor type is shown via heatmap; asterisks indicate significant changes, FDR < 0.05. (C) ΔPSI of 34 pan-cancer AS events in MYC-active vs. MYC-inactive tumors across 75% of 23 TCGA tumor types (n > 15/group). Event type and gene name, and their frequency, are shown. (D) Frequency per 100 bp of predicted binding motifs for SRSF2, SRSF3, or SRSF7 in pan-cancer MYC-regulated AS events, in upstream, spliced, and downstream sequences. Individual motifs are scored and summed by SF. (E) Overall survival with or without the pan-cancer MYC AS event signature shown by tumor type (log-rank test p values). See also Figure S9 and Table S5.

Similar articles

Cited by

References

    1. Bonnal SC, López-Oreja I, and Valcárcel J (2020). Roles and mechanisms of alternative splicing in cancer - implications for care. Nat. Rev. Clin. Oncol. 17, 457–474. 10.1038/s41571-020-0350-x. - DOI - PubMed
    1. Urbanski LM, Leclair N, and Anczukow O (2018). Alternative-splicing defects in cancer: splicing regulators and their downstream targets, guiding the way to novel cancer therapeutics. Wiley Interdiscip. Rev. RNA 9, e1476. 10.1002/wrna.1476. - DOI - PMC - PubMed
    1. Long JC, and Caceres JF (2009). The SR protein family of splicing factors: master regulators of gene expression. Biochem. J. 417, 15–27. 10.1042/BJ20081501. - DOI - PubMed
    1. Dvinge H, Kim E, Abdel-Wahab O, and Bradley RK (2016). RNA splicing factors as oncoproteins and tumour suppressors. Nat. Rev. Cancer 16, 413–430. 10.1038/nrc.2016.51. - DOI - PMC - PubMed
    1. Bonnal S, Vigevani L, and Valcárcel J (2012). The spliceosome as a target of novel antitumour drugs. Nat. Rev. Drug Discov. 11, 847–859. 10.1038/nrd3823. - DOI - PubMed

Publication types

Substances