. 2022 Nov 22;41(8):111695.
doi: 10.1016/j.celrep.2022.111695.

Exercise increases information content and affects long-term stability of hippocampal place codes

Affiliations

Exercise increases information content and affects long-term stability of hippocampal place codes

Yoav Rechavi et al. Cell Rep. .

Abstract

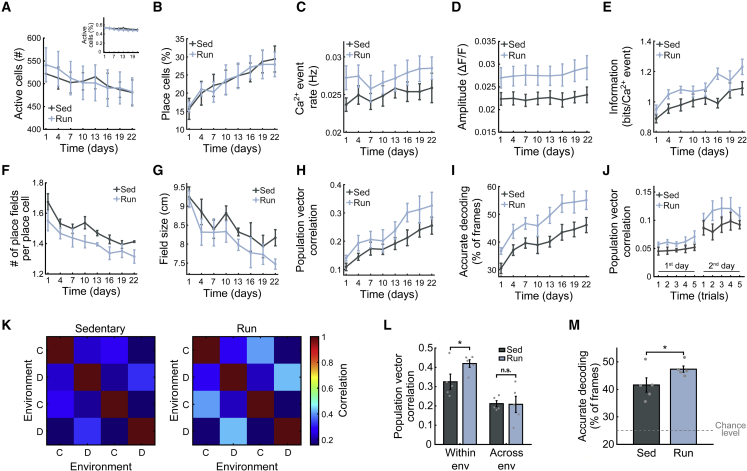
Physical exercise is known to augment brain functioning, improving memory and cognition. However, while some of the physiological effects of physical activity on the brain are known, little is known about its effects on the neural code. Using calcium imaging in freely behaving mice, we study how voluntary exercise affects the quality and long-term stability of hippocampal place codes. We find that running accelerates the emergence of a more informative spatial code in novel environments and increases code stability over days and weeks. Paradoxically, although runners demonstrated an overall more stable place code than their sedentary peers, their place code changed faster when controlling for code quality level. A model-based simulation shows that the combination of improved code quality and faster representational drift in runners, but neither of these effects alone, could account for our results. Thus, exercise may enhance hippocampal function via a more informative and dynamic place code.

Keywords: CP: Neuroscience; adult neurogenesis; calcium imaging; hippocampus; memory; neural coding; physical activity; place cells; representational drift; running.


Conflict of interest statement

Declaration of interests The authors declare no competing interests.

Figures

None
Graphical abstract
Figure 1
Figure 1
Studying the effects of voluntary physical exercise on adult neurogenesis and hippocampal CA1 spatial codes (A) Top: Mice housed with either a functional (“Run”) or dysfunctional (“Sed”) running wheel were trained to run back and forth and collect rewards in two linear tracks. Bottom: Experimental timeline. After a pre-training period, we trained and imaged mice in the two environments every 3 days for 22 days. On day 25, the mice visited two circular, open-field arenas in a session consisting of four trials. They were injected with BrdU a day later and perfused 4 days later. (B) Staining for BrdU and DCX in the DG. (C) DCX expression per DG slice is higher in the runners (n = 6) versus sedentary (n = 7) group (two-sample one-sided t test, p < 0.01). Data presented as mean ± SEM across mice. (D) Number of BrdU + cells per DG slice is higher in the runners (n = 6) versus sedentary (n = 7) group (two-sample one-sided t test, p < 0.05). Data presented as mean ± SEM across mice. (E) Example place cells tracked across all days of the experiment. Dots represent Ca2+ events. (F) Spatial tuning (rate maps) for the same cells across 8 recording days, ordered by the place fields’ centroid positions. The maps depict the changes in place cell activity patterns on different days. (G) Population vector (PV) correlations between the representations of different locations (pooled from both running directions) across 8 recording days and averaged over all mice from the runners (left, n = 5) and sedentary (right, n = 5) mice. (H) Average population vector correlations across all spatial locations and running directions, averaged across mice in each group. PVs were obtained by pooling data from all sessions in each environment.
Figure 2
Figure 2
The effects of voluntary physical exercise on the accuracy of hippocampal CA1 spatial codes (A) Number of active cells per day. Both groups show a similar number of active cells per day (Friedman test, p > 0.5). Inset: the percentage of active cells out of the total number of cells that were active throughout the experiment. (B) Percentage of place cells out of the population of active cells. Both groups show a comparable fraction of place cells (Friedman test, p > 0.5). Each group showed an increase in the portion of place cells with learning (paired-sample two-sided t test between the first and last sessions, p < 0.001 and p < 0.01, for sedentary and runners, respectively). (C) Average Ca2+ event rate was higher in the runners versus sedentary group (Friedman test, p < 0.005). (D) Average Ca2+ event amplitude in the runners was higher than in the sedentary group (Friedman test, p < 510−7). (E) The average spatial information conveyed by CA1 place cells in the runners was higher than in the sedentary group (Friedman test, p < 0.00002). (F) The average number of place fields per place cell decreased with time and was lower in the runners relative to the sedentary group (Friedman test, p < 0.00001). (G) The average place-field size was smaller in the runners compared with the sedentary group (Friedman test, p < 0.015). (H) PV correlations during running epochs across different trials within the same session were higher in the runners versus sedentary group (Friedman test, p < 0.0005). (I) Performance of a within-session spatial decoder was better in the runners versus sedentary group (Friedman test, p < 510−7). (J) Place code similarity between each trial on the first days of learning (days 1 and 4) and the spatial representations on the last days of learning (days 19 and 22). This similarity was lower for the last trial on the first day of learning than for the first trial on the second day of learning, for both groups (two-sided t test, p < 0.05 for both groups). (K) PV correlation between the representations of different open-field environments (environments C and D) across different trials, averaged across mice. (L) PV correlation between trials in which mice visited the same open-field environment was higher in the runners (two-sample one-sided t test, p < 0.05), but was similar to the sedentary group between trials in different environments (two-sample one-sided t test, p > 0.05). (M) The performance of a spatial decoder in the open-field arena was higher in the runners versus sedentary group (two-sample one-sided t test, p < 0.05). The dashed line indicates chance level performance (25%). Data presented as mean ± SEM across mice. For all t tests: two groups, five mice per group. For all Friedman tests: same groups over eight sessions per mouse.
Figure 3
Figure 3
The effects of voluntary physical exercise on the stability of hippocampal CA1 spatial codes (A) PV correlations between the place cell activity patterns across days. The correlations between the neuronal representations on different sessions in the same environment were higher in the runners (Friedman test, p < 0.005). (B) The correlations between the activity rates of all cells in different environments and on different days in the runners and sedentary mice were similar (Friedman test, p > 0.5). (C) Correlations between the neuronal tuning curves in different environments and different days. The spatial tuning curve correlations as a function of elapsed time were more stable in runners versus sedentary mice (Friedman test, p < 0.001). (D) The percentage of stable place cells out of the population of place cells was higher in runners versus sedentary mice as a function of elapsed time (Friedman test, p < 0.0005). (E) The performance of a spatial decoder between adjacent days was higher in runners versus sedentary group (Friedman test, p < 0.0005). (F) The performance of a spatial decoder as a function of elapsed time was higher in runners versus sedentary group (Friedman test, p < 510−8). Chance level in (E) and (F) = 5%. Data presented as mean ± SEM across mice. For all statistics: two groups, five mice per group, seven session-pairs per mouse.
Figure 4
Figure 4
Runners demonstrate a more rapid representational drift when accounting for code quality, and model-based simulated data recapitulates the experimental findings (A) We posit that physical activity affects code stability via two pathways with opposite effects: (1) through representational drift (gradual time-dependent changes in the responsiveness of neurons) and (2) through the increase in code quality (learning dynamics), which, in turn, effectively stabilizes the code. (B) Schematic overview: Instead of examining the difference between the two groups for a given time (vertical gray area), we compared the two groups for a given code quality level (horizontal gray area). (C and D) Information versus code stability. For a given code quality (i.e., information), the code stability (PV correlation across adjacent days) was higher in the sedentary group, indicating slower changes in encoding relative to the runners. (C) Data averaged per day. (D) Each data point represents a single day in a single mouse (two-sample, two-sided t test, p < 0.05). This difference between the two groups remained significant when applying a method for bias-free estimation of spatial information (Sheintuch et al., 2022) (two-sample, two-sided t test, p < 0.016, inset). (E) Illustration of Simpson’s paradox: Overall, y values are higher for the blue group, although lower for the blue group for any given value of x. For all statistics: two groups, five mice per group, seven session-pairs per mouse. (F) Model illustration: To represent learning, the spatial tuning of place cells improved over time (left panel). To capture representational drift, each of these place cells' preferred position randomly shifted along days (right panel). (G–J) Simulated data (data presented as mean ± SEM): (G) The average information conveyed by place cells in the runners was higher than in the sedentary group. (H) Code similarity across adjacent days (i.e., PV correlation) in the runners was higher than in the sedentary group. (I) Code similarity as a function of elapsed time in the runners was higher than in the sedentary group. (J) Average information versus adjacent days code similarity, day-averaged data. For a given code quality, the code stability was higher in the sedentary group.

Similar articles

Cited by

References

    1. Aimone J.B., Deng W., Gage F.H. Resolving new memories: a critical look at the dentate gyrus, adult neurogenesis, and pattern separation. Neuron. 2011;70:589–596. doi: 10.1016/j.neuron.2011.05.010. - DOI - PMC - PubMed
    1. Aimone J.B., Wiles J., Gage F.H. Potential role for adult neurogenesis in the encoding of time in new memories. Nat. Neurosci. 2006;9:723–727. doi: 10.1038/nn1707. - DOI - PubMed
    1. Akers K.G., Martinez-Canabal A., Restivo L., Yiu A.P., De Cristofaro A., Hsiang H.L., Wheeler A.L., Guskjolen A., Niibori Y., Shoji H., et al. Hippocampal neurogenesis regulates forgetting during adulthood and infancy. Science. 2014;344:598–602. doi: 10.1126/science.1248903. - DOI - PubMed
    1. Anderson B.J., Rapp D.N., Baek D.H., McCloskey D.P., Coburn-Litvak P.S., Robinson J.K. Exercise influences spatial learning in the radial arm maze. Physiol. Behav. 2000;70:425–429. doi: 10.1016/S0031-9384(00)00282-1. - DOI - PubMed
    1. Barretto R.P.J., Ko T.H., Jung J.C., Wang T.J., Capps G., Waters A.C., Ziv Y., Attardo A., Recht L., Schnitzer M.J. Time-lapse imaging of disease progression in deep brain areas using fluorescence microendoscopy. Nat. Med. 2011;17:223–228. doi: 10.1038/nm.2292. - DOI - PMC - PubMed

Publication types

Substances

LinkOut - more resources