. 2022 Nov 22;41(8):111697.
doi: 10.1016/j.celrep.2022.111697.

Systematic single-cell pathway analysis to characterize early T cell activation

Affiliations

Systematic single-cell pathway analysis to characterize early T cell activation

Jack A Bibby et al. Cell Rep. .

Abstract

Pathway analysis is a key analytical stage in the interpretation of omics data, providing a powerful method for detecting alterations in cellular processes. We recently developed a sensitive and distribution-free statistical framework for multisample distribution testing, which we implement here in the open-source R package single-cell pathway analysis (SCPA). We demonstrate the effectiveness of SCPA over commonly used methods, generate a scRNA-seq T cell dataset, and characterize pathway activity over early cellular activation. This reveals regulatory pathways in T cells, including an intrinsic type I interferon system regulating T cell survival and a reliance on arachidonic acid metabolism throughout T cell activation. A systems-level characterization of pathway activity in T cells across multiple tissues also identifies alpha-defensin expression as a hallmark of bone-marrow-derived T cells. Overall, this work provides a widely applicable tool for single-cell pathway analysis and highlights regulatory mechanisms of T cells.

Keywords: CP: Immunology; SCPA; T cell; arachidonic acid; cytokines; gene set; metabolism; pathway analysis; single-cell RNA-seq; single-cell pathway analysis; type I interferon.


Conflict of interest statement

Declaration of interests The authors declare no competing interests.

Figures

Figure 1.
Figure 1.
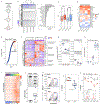
SCPA provides a sensitive and accurate reflection of pathway activity (A) Overview of the methodology implemented in the Single Cell Pathway Analysis (SCPA) R package. (B) Overview of pathway analysis benchmarking under simulated scRNA-seq datasets. See methods for details (C) P values generated by each pathway analysis method after varying the size of differential expression factors for genes of the pathway. (D) P values generated by each pathway analysis method after varying the probability that a gene will be chosen to be differentially expressed between the two groups.
Figure 2.
Figure 2.
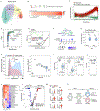
Single cell sequencing on sorted and stimulated T cell populations (A) Overview of experimental design for generation of the T cell scRNA-seq resource. CD4+ and CD8+ T cells were magnetically isolated from the peripheral blood in parallel, stained for CD45RA or CD45RO, FACS sorted to distinguish naïve from memory T cells, and left unstimulated, or stimulated with anti-CD3 and anti-CD28 for either 12 or 24 hours. (B) UMAP representations of T cell subtypes identified in the peripheral blood. (C) Proportions of each identified cell type across each condition. Colors for bars are matched with colors in UMAP representations. (D) Dot plot representations of the markers from each cell cluster. Marker identification was done by combining data across stimulation time points for each cell type. An unbiased selection of markers was then generated by taking the top 7 genes sorted by false discovery rate from each population.
Figure 3.
Figure 3.
Intrinsic IFNα signaling as a key regulator of T cell survival (A) Schematic representation of the SCPA analysis conducted across time points for each sorted T cell population. (B) Heatmap representation of pathway perturbations generated from the comparisons outlined in (A), with classifications of core pathways into broad categories. The pathways from the topmost cluster (k-means clustering) were manually categorized into broad pathway classes, and the frequency of each class is visualized in the bar plot. (C) Boxplots representing the extent of distribution changes, per pathway, for all 1790 pathways across cell types and stimulation. (D) Heatmap showing FDR values of specific cytokines within the ‘cytokine response’ class derived from core pathways. ‘General’ refers to cytokine response gene sets that do not mention a specific cytokine e.g. ‘cytokine signaling’. H = Hallmark, R = Reactome, K = KEGG (E) Ranking of all pathway Qvals in naïve CD4+ T cells across activation. Interferon (IFN) pathways are highlighted in red (F) Heatmap representation of interferon response gene expression with genes taken from the ‘Reactome interferon signaling’ gene set. (G) qPCR for IFNA genes in CD4+ T cells after stimulation with αCD3+ αCD28 for the indicated time with 0hr representing unstimulated cells (n=4). Data are relative to RPL7 as an internal reference, calculated as 2-Δct. Ct values represent the mean over 4 donors ± sd in the 0hr condition (H) IFNα measured in the supernatant of CD4+ T cells after stimulation with αCD3+ αCD28 for the indicated time. 0hr represents unstimulated cells, and red dotted line represents the detection limit (n=3) (I) Heatmap representation of STAT1 target gene expression over naïve CD4+ T cell activation. STAT1 targets, taken from the transcription factor targets available on MSigDB were plotted over a trajectory of naïve CD4+ T cell activation. Trajectory inference model calculated using slingshot is shown in supplementary figure 2A. Lower cell type annotation bar represents resting, intermediate and activated naïve T cell populations from Figure 2B. (J-K) CRISPR-cas9 mediated deletion of IFNα in CD4+ T cells, showing IFN editing efficiency in (J) and flow cytometry analysis of cell viability after IFNα knockdown in CD4+ T cells (K, n =5). (L) Viability staining of splenic CD4+ T cells from wild type (WT) or Ifnar1−/− mice. Embedded panel shows representative live-dead staining taken from the 48hr time point, n = 3 mice per genotype Statistical testing was performed by: Wilcoxon Rank Sum test (C), paired t-test (J) or repeated measures ANOVA (K). *p<0.05, **p<0.01, ****p<0.0001
Figure 4.
Figure 4.
Arachidonic acid metabolism regulates CD4+ T cell activation (A) Trajectory analysis of naïve CD4+ T cell activation. Naïve CD4+ T cells were subjected to trajectory inference modelling using slingshot, and subsequently split into nodes across the trajectory using dyno (see methods). Pseudotime values for this trajectory are shown in Supplementary Figure 2A. (B) SCPA analysis outline (above) and output (below) using a manually curated list of metabolic pathways across pseudotime populations. 186 manually curated metabolic pathways were used with SCPA to categorize metabolic reprogramming across the four identified activation phases in native CD4+ T cell activation. (C) Mean pathway expression of glycolysis and linoleic acid metabolism over naïve CD4+ T cell activation. Mean gene expression for ‘Hallmark glycolysis’ and ‘KEGG linoleic acid metabolism’ were plotted against pseudotime values calculated in (A). (D) Volcano plot showing Qval output from SCPA plotted against pathway enrichment, measured as mean pathway change when comparing 0 to 24 hours conditions. Black points show non-significant pathways, blue points show significant pathways with no enrichment, and green points show significant pathways that also show enrichment. Arachidonic acid metabolism (AA) is highlighted in red (E) Gene set enrichment analysis (GSEA) across T cell activation, using metabolic pathways when comparing 0 to 24 hours conditions. Dot plot shows ranking of metabolic pathways by FDR q-val, with arachidonic acid metabolism highlighted in red. Embedded plot shows enrichment plot for arachidonic acid metabolism. (F) Outline of key enzymes of the arachidonic acid metabolism pathway and their expression across activation. (G) Arachidonic acid production measured in the supernatants of purified CD4+ T cells after stimulation with anti-CD3+28 antibodies (n=3) (H) CD69 expression (geometric MFI) in CD4+ T cells after inhibition of a PLA2 using pyrrophenone at varying concentrations (n=3). Representative plot taken from 1μM. (I-J) Cytokine expression (I) and cell viability (J) after anti-CD3+28 stimulation with PLA2 inhibition (1μM) in CD4+ T cells (n=3) (K) Heatmap of Qvals generated by SCPA after comparing the indicated resting CD4+ memory T cell population with resting naïve CD4+ T cells. H = Hallmark, R = Reactome, K = KEGG, ETC = Electron transport chain. (L-M) Volcano plot of amino acid metabolism genes compared between Tcm and Th1 cells. Ribosomal (RPS/L) and proteasomal (PSM) genes are highlighted in blue and red respectively. (N) Schematic summary of T cell metabolism over cellular differentiation Statistical testing was performed by: paired t-test (G and I). *p<0.05
Figure 5.
Figure 5.
Alpha defensin expression defines bone marrow derived T cells (A) UMAP representations of stimulation effect and T cell subtypes across the indicated tissues. (B) Heatmap representation of markers from each cell subtype indicated in the UMAP plots (C) Outline of SCPA two-sample comparisons of cell types between tissues. Each cell type in each tissue was compared to the equivalent population found in the blood, both under resting and activated conditions. (D) Heatmap of Qvals generated by SCPA after pathway comparisons outlined in (C), with tiles above the heatmap representing selected metadata features of each column. (E) PCA of Qvals generated in (D), highlighting the effect of stimulation and tissue location of each cell type. (F) Dot plot showing the variance of all pathways across tissue sites and stimulation conditions (G) DEFA1 and DEFA3 expression in all T cell subtypes grouped together, split by tissue site. (H) DEFA1 expression in CD4+CD45RO+ T cells derived from blood or bone marrow, acquired from dataset GSE50677 (n>=8) (I-J) Flow cytometry analysis of DEFA1 expression in CD3+ T cells from bone marrow compared to blood derived CD3+ T Cells from age and sex matched healthy donors. Iso = isotype control. Statistical testing was performed by: paired t-test (H). **p<0.01

References

    1. Kumar BV, Connors TJ, and Farber DL (2018). Human T Cell Development, Localization, and Function throughout Life. Immunity 48, 202–213. 10.1016/j.immuni.2018.01.007. - DOI - PMC - PubMed
    1. Nayak R, and Hasija Y (2021). A hitchhiker’s guide to single-cell transcriptomics and data analysis pipelines. Genomics 113, 606–619. 10.1016/j.ygeno.2021.01.007. - DOI - PubMed
    1. Stuart T, Butler A, Hoffman P, Hafemeister C, Papalexi E, Mauck WM 3rd, Hao Y, Stoeckius M, Smibert P, and Satija R (2019). Comprehensive Integration of Single-Cell Data. Cell 177, 1888–1902.e1821. 10.1016/j.cell.2019.05.031. - DOI - PMC - PubMed
    1. Hie B, Bryson B, and Berger B (2019). Efficient integration of heterogeneous single-cell transcriptomes using Scanorama. Nat Biotechnol 37, 685–691. 10.1038/s41587-019-0113-3. - DOI - PMC - PubMed
    1. Welch JD, Kozareva V, Ferreira A, Vanderburg C, Martin C, and Macosko EZ (2019). Single-Cell Multi-omic Integration Compares and Contrasts Features of Brain Cell Identity. Cell 177, 1873–1887.e1817. 10.1016/j.cell.2019.05.006. - DOI - PMC - PubMed

Publication types