. 2022 Dec 20;146(25):1930-1945.
doi: 10.1161/CIRCULATIONAHA.121.055610. Epub 2022 Nov 23.

Circulating c-Met-Expressing Memory T Cells Define Cardiac Autoimmunity

Affiliations

Circulating c-Met-Expressing Memory T Cells Define Cardiac Autoimmunity

Silvia Fanti et al. Circulation. .

Abstract

Background: Autoimmunity is increasingly recognized as a key contributing factor in heart muscle diseases. The functional features of cardiac autoimmunity in humans remain undefined because of the challenge of studying immune responses in situ. We previously described a subset of c-mesenchymal epithelial transition factor (c-Met)-expressing (c-Met+) memory T lymphocytes that preferentially migrate to cardiac tissue in mice and humans.

Methods: In-depth phenotyping of peripheral blood T cells, including c-Met+ T cells, was undertaken in groups of patients with inflammatory and noninflammatory cardiomyopathies, patients with noncardiac autoimmunity, and healthy controls. Validation studies were carried out using human cardiac tissue and in an experimental model of cardiac inflammation.

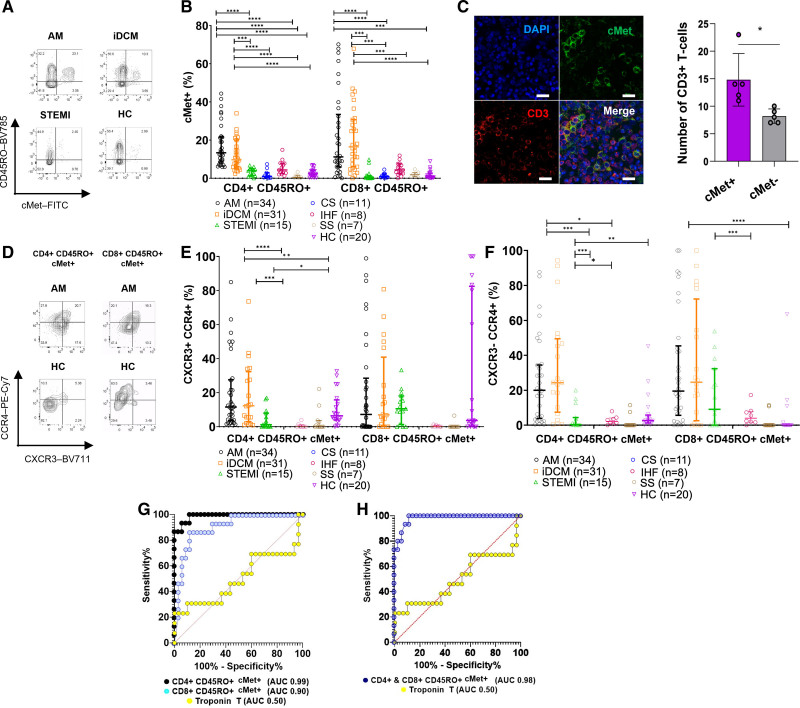
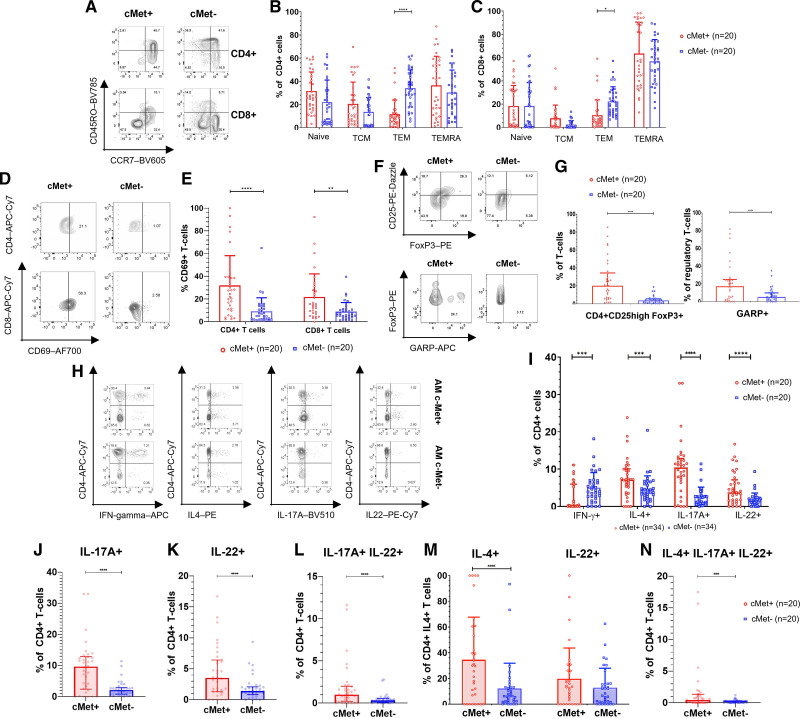
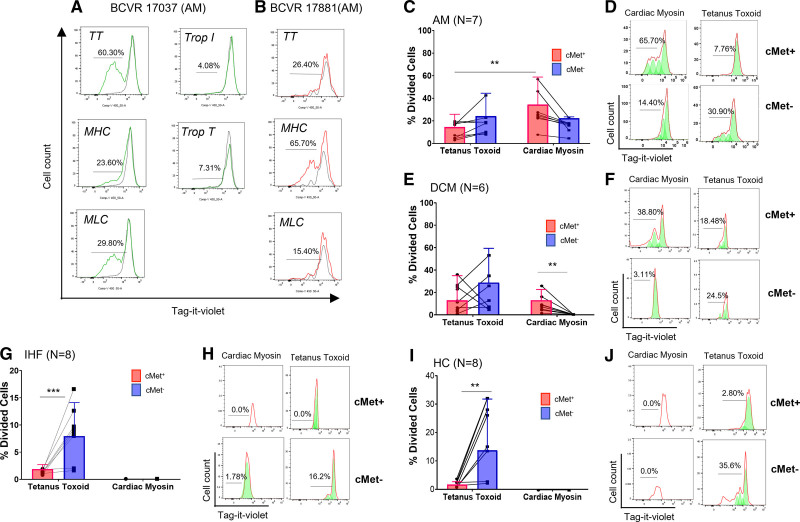
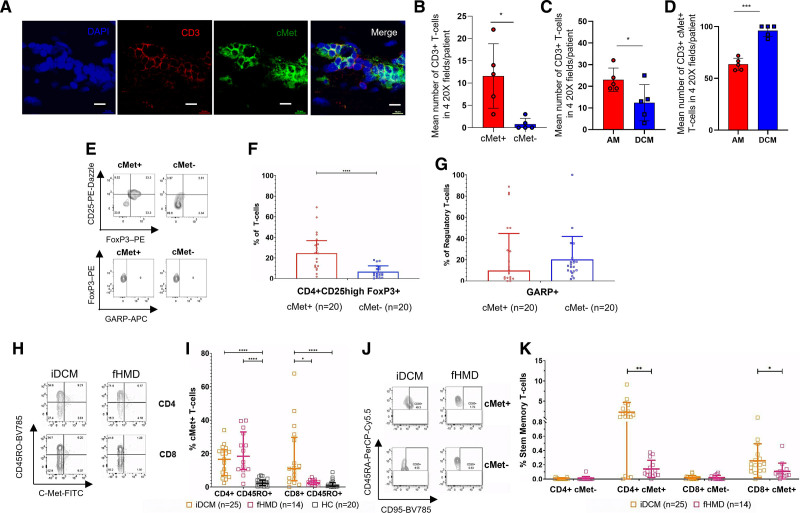
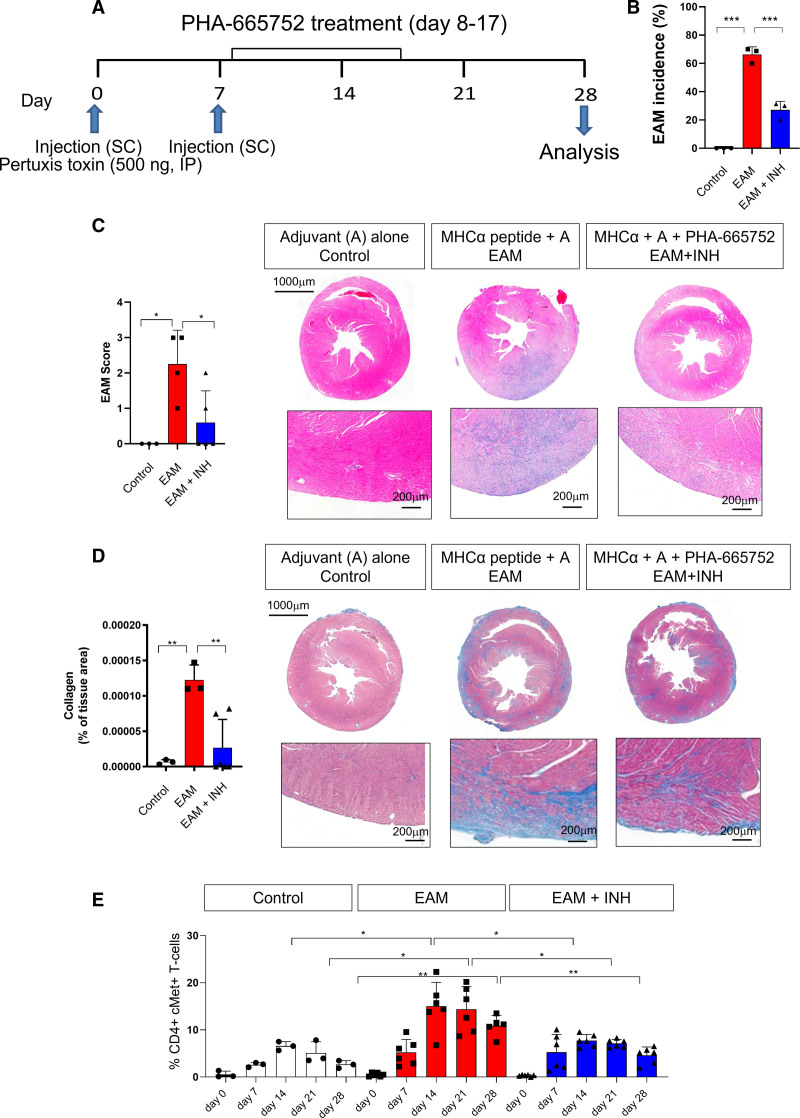
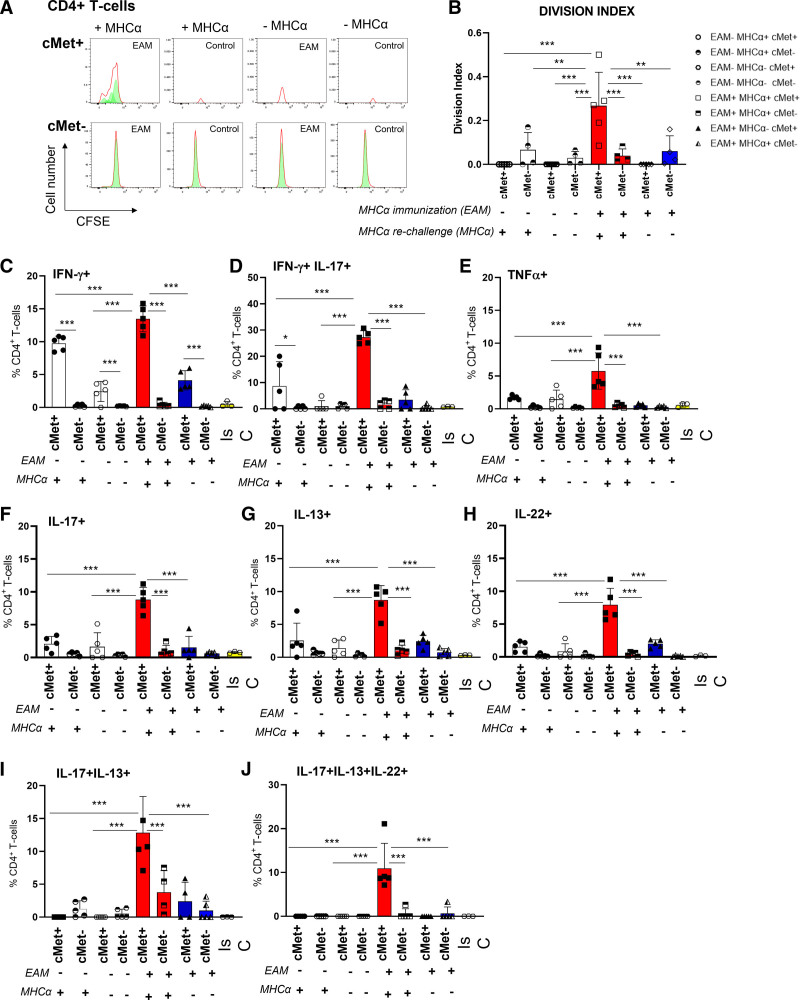
Results: We show that c-Met+ T cells are selectively increased in the circulation and in the myocardium of patients with inflammatory cardiomyopathies. The phenotype and function of c-Met+ T cells are distinct from those of c-Met-negative (c-Met-) T cells, including preferential proliferation to cardiac myosin and coproduction of multiple cytokines (interleukin-4, interleukin-17, and interleukin-22). Furthermore, circulating c-Met+ T cell subpopulations in different heart muscle diseases identify distinct and overlapping mechanisms of heart inflammation. In experimental autoimmune myocarditis, elevations in autoantigen-specific c-Met+ T cells in peripheral blood mark the loss of immune tolerance to the heart. Disease development can be halted by pharmacologic c-Met inhibition, indicating a causative role for c-Met+ T cells.

Conclusions: Our study demonstrates that the detection of circulating c-Met+ T cells may have use in the diagnosis and monitoring of adaptive cardiac inflammation and definition of new targets for therapeutic intervention when cardiac autoimmunity causes or contributes to progressive cardiac injury.

Keywords: T-lymphocytes; cardiac myosins; cardiomyopathies; heart; hepatocyte growth factor; humans; inflammation; mice; myocarditis; therapeutics.


Figures

Figure 1.
Figure 1.
Circulating c-Met–expressing T cells are increased in inflammatory cardiomyopathies. Peripheral blood CD4+ and CD8+ memory T cells were analyzed by flow cytometry for the expression of c-Met. A, Representative dot plots from the patient groups. B, Grouped data for patient and healthy control (HC) groups with significant Kruskal-Wallis for CD4+ and CD8+ T cells with post hoc Dunn multiple comparisons test. C, Confocal analysis of CD3+ (red) and c-Met+ (green) cells in paraffin-embedded postmortem acute myocarditis (AM) samples. Scale bar, 20 μm. The column graph shows the mean number of c-Met+ and c-Met CD3+ T cells in four 20× fields from each of 5 patient samples (±SEM; paired Student t test). P values are highlighted as follows: ****P<0.0001, ***P<0.0005, **P<0.005, *P<0.05. Data are represented as median ± interquartile range. D through F, c-Met+ memory cells were also analyzed for coexpression of CXCR3 and CCR4 (E) as well as CCR4 single expression (F) within the patient groups indicated under the x axis. A representative dot plot is shown in D. Kruskal-Wallis for CD4+ T cells with post hoc Dunn multiple comparisons test. G, Receiver operating characteristic (ROC) curves for measurement of c-Met+ CD4+ (black) and CD8+ (blue) memory T cells and peak troponin T (yellow) for patients with AM versus patients with ST-segment–elevation myocardial infarction (STEMI). The ROC analysis was performed in GraphPad using the default settings. The list of thresholds was estimated by sorting all the values in all groups and averaging adjacent values in that sorted list. Each threshold value is midway between 2 values in the data. Each sensitivity is the fraction of values above the threshold in the patient group. The specificity is the fraction of values below the threshold in the control group. Each CI is computed from the observed proportion by the Clopper method without any correction for multiple comparisons. Significance is defined at 2-tailed level of 0.05. CD4+ area under the curve (AUC) 0.99, P<0.0001; CD8+ AUC 0.90, P<0.0001; troponin T AUC 0.50, P=0.98. H, ROC of CD4 and CD8 combined: blue indicates CD4 and CD8 CD45RO+ c-Met+ and yellow indicates troponin T. AUC 0.98, P<0.00001. CS indicates cardiac surgery; iDCM, idiopathic dilated cardiomyopathy; IHF, ischemic heart failure; and SS, Sjögren syndrome.
Figure 2.
Figure 2.
Phenotypic and functional characterization of c-Met+ T cells in AM. A, Representative flow cytometry plots showing expression of CD45RO and CCR7 by c-Met+ CD4+ T cells from a patient with acute myocarditis (AM). Summary flow cytometry data from patients are shown in B (CD4+) and C (CD8+). The dots in the graphs represent single individuals. The numbers refer to the number of patients in each respective group in each panel. G and I through N present results from the Wilcoxon signed rank test because paired patient data are compared. For B, C, and E, we used a 2-way analysis of variance because the samples are independent and we were testing whether the cells were c-Met+ or c-Met and their expression of CD45RO and CCR7. D, Representative dot plots of CD69 expression by c-Met+ and c-Met peripheral blood CD4+ and CD8+ T cells in a patient with AM. Summary data are shown in E, with a significant 2-way analysis of variance and post hoc Sidak multiple comparisons test. F shows representative dot plots of FoxP3 and CD25 expression (upper dot plots) and expression of GARP (glycoprotein A repetitions predominant) by FoxP3+CD25+ cells (lower dot plots) by c-Met+ and c-Met peripheral blood CD4+ T cells from a patient with AM. Summary data for GARP are shown in G with a significant Wilcoxon signed rank test. In E and G, the red dots represent c-Met+ T cells and the blue dots represent c-Met T cells. H and I, The production of the indicated cytokines by peripheral blood c-Met+ and c-Met CD4+ T cells from patients with AM was assessed by intracellular staining and flow cytometry. Representative dot plots are shown in H. In the data summary in I, the red dots represent c-Met+ cells and the blue dots represent c-Met cells. Statistical analysis was performed by Wilcoxon signed rank tests. J through N, Analysis of multiple cytokine producer c-Met+ and c-Met T cells. J, Single-positive interleukin (IL)-17A–producing c-Met+ and c-Met T cells. K, Single-positive IL-22+ c-Met+ and c-Met cells. L, IL-17+ IL-22+ coproducing circulating c-Met+ and c-Met memory T cells. M, c-Met+ and c-Met IL-4+ IL-17+ T cells and IL-4+ IL-22+ T cells. N, IL-4+ IL-22+ IL-17A+ triple-positive c-Met+ and c-Met memory T cell populations. Wilcoxon signed rank was used for statistical significance. P values are highlighted as follows: ****P<0.0001, ***P<0.0005, **P<0.005, *P<0.05. Data are represented as median ± interquartile range. APC indicates allophycocyanin; IFN, interferon; PE, phycoerythrin; TCM, central memory T cells; TEM, effector memory T cells; and TEMRA, effector memory RA+ T cells.
Figure 3.
Figure 3.
c-Met+ T cells proliferate to cardiac myosin. Peripheral blood T cells from patients with acute myocarditis (AM) were labeled with an intravital fluorescent dye (Tag-it Violet) and co-cultured with the indicated antigens. For controls, no antigen was added to the cultures. A and B, Example proliferative responses (Tag-it Violet dilution) in 2 patients with AM (BCVR 17037 and 17881) depicted histographically by total CD3+ live lymphocytes in response to antigen. Unstimulated T cells (no-antigen controls) are shown by the black lines. C, Flow cytometry of postproliferation sample using c-MET antibody to determine c-Met+/ status of proliferating cells. Cell replication is indicated by a left shift on the x axis. Red line indicates raw flow cytometry data (cell count). Green peaks indicate derived exemplar cell replication (eg, cardiac myosin/c-Met+ sample: from right–left division [d] 0, d1, d2, and d3). D shows a summary of the responses to cardiac myosin and tetanus toxoid (TT) by c-Met+ and c-Met T cells from 7 patients with AM. Each dot represents c-Met+ and c-Met T cell responses and the lines linking dots identify the same individual’s c-Met+ and c-Met T cell responses to either TT or myosin. Identical assays were performed using peripheral blood mononuclear cells from 6 patients with idiopathic dilated cardiomyopathy (DCM; E and F), 8 patients with ischemic heart failure (IHF; G and H), and 8 healthy controls (HC; I and J). Data were analyzed using repeated measures 2-way analysis of variance followed by a significant Tukey multiple comparison test for c-Met+ response to TT compared with c-Met+ response to cardiac myosin. P values are highlighted as follows: **P<0.005. Data are represented as median ± interquartile range. MHC indicates myosin heavy chain; MLC, myosin light chain; and Trop, troponin.
Figure 4.
Figure 4.
Disease-specific features of c-Met+ memory T cells. A, Confocal analysis of CD3+ (red) c-Met+ (green) cells in postmortem paraffin-embedded idiopathic dilated cardiomyopathy (iDCM) samples. Scale bar, 20 μm. B, Mean number of c-Met+ and c-Met CD3+ T cells in four 20× fields from each of 5 unique iDCM myocardial tissue samples. C, Mean number of c-Met+ and c-Met CD3+ T cells in four 20× fields from each of 5 independent samples of acute myocarditis (AM) and 5 samples of iDCM myocardium. D, Mean percentage of c-Met+ T cells in CD3+ T cell infiltrates in four 20× fields from each of 5 independent AM or iDCM samples (mean ± SEM, unpaired Student t test). E through G, FoxP3 and CD25 expression (upper dot plots) and expression of GARP (glycoprotein A repetitions predominant) by FoxP3+ CD25+ cells (lower dot plots) by peripheral blood c-Met+ and c-Met CD4+ T cells from patients with iDCM. E includes representative dot plots and summary data are shown in F and G. H shows representative dot plots for c-Met–expressing CD4+ and CD8+ T cells from peripheral blood samples from iDCM and genetically confirmed familial heart muscle disease (fHMD). A summary of the data, including healthy controls (HC), is shown in I, with a significant Kruskal-Wallis test for both CD4+ and CD8+ T cells. For CD4+ T cells, there was a significant Dunn multiple comparison test for iDCM versus HC and fHMD versus HC, but not iDCM versus fHMD. For CD8+ T cells, there was a significant Dunn multiple comparison test for iDCM versus HC and iDCM versus fHMD but not between fHMD and HC. J and K, Peripheral blood T cells from AM, iDCM, and fHMD were stained for markers of stem memory T cells (CD3+ CD4+ CCR7+ CD45RA+ CD95+). Representative dot plots obtained after gating on CD3+ CD4+ CCR7+ T cells from nonfamilial iDCM and fHMD are shown in J. Grouped data displaying the proportion of CD4+ and CD8+ stem memory T cells in the peripheral blood of iDCM and fHMD patient groups are shown in K. Statistical analysis was performed with Mann-Whitney tests that were significant for the CD4+ c-Met+ T cells and CD8+ c-Met+ T cells but not c-Met CD4+ or CD8+ T cells. P values are highlighted as follows: ****P<0.0001, ***P<0.001, **P<0.01, *P<0.05. Data are represented as median ± interquartile range. APC indicates allophycocyanin.
Figure 5.
Figure 5.
c-Met+ T cells mediate inflammation in experimental autoimmune myocarditis. To induce autoimmune myocarditis, BALB/cAnN male mice were immunized with murine cardiac MHCα (myosin heavy chain) peptide (RSLKLMATLFSTYASADR) as described in the Methods. As shown in the protocol summarized in A, some mice received intraperitoneal injections of the c-Met inhibitor PHA-665752 (500 µg/mL; experimental autoimmune myocarditis [EAM] + inhibitor [INH]) from day 8 to day 17 after immunization. As a control, a group of mice received an adjuvant alone (control). B, EAM incidence 28 days after the first immunization. The development of inflammatory infiltrates and collagen deposition were assessed by hematoxylin & eosin (C) and Masson trichrome staining (D) of the heart 28 days after immunization. Column graphs show disease scores obtained as described in Methods. Representative images at 20× and 40× magnification are shown on the right side of each panel. Statistical analysis was performed with 1-way analysis of variance. Total n=3. E, Tail vein blood was sampled on the same mouse on the indicated time points. The measurement on different days were taken from the same mouse. The % of CD44 high, CD4+ c-Met+ T cells was determined by flow cytometry. Statistical analysis was performed with repeated measures 2-way analysis of variance test. P values are highlighted as follows: ***P<0.0005, **P<0.005, *P<0.05. Data are represented as median ± interquartile range.
Figure 6.
Figure 6.
Specificity and functional characteristics of c-Met+ T cells in experimental autoimmune myocarditis. BALB/cAnN male mice were immunized with murine MHCα (myosin heavy chain) peptide (RSLKLMATLFSTYASADR). Fourteen days after the second immunization, mice were killed and CD4+ T cells from heart-draining lymph nodes restimulated in vitro with autologous splenocytes, stimulatory anti-CD28 antibody, and MHCα peptide. Controls included mice treated with adjuvant alone. The white bars correspond to the negative controls, where mice were not immunized or rechallenged with MHCα peptide (ie, experimental autoimmune myocarditis [ EAM], MHCα). Red and blue bars correspond to immunized mice (ie, EAM+) with and without MHCα peptide rechallenge (red bars, MHCα+; blue bars, MHCα), respectively. A and B, Before stimulation, some T cells were labeled with carboxyfluorescein succinimidyl ester. Cells were harvested and analyzed 5 days later for carboxyfluorescein succinimidyl ester dilution and c-Met+ expression. Representative histograms are shown in A. In B, the division index measured in samples from 5 animals is shown (n=2). C through J, Production of the indicated cytokines by c-Met+ and c-Met T cells was measured 6 hours after restimulation with MHCα peptide by intracellular staining. In the experimental design, 2 independent variables were applied on the same level (ie, EAM+/, and MHCα+/) in nonindependent samples. Downstream of EAM immunization and MHCα peptide rechallenge, c-Met+ and c-Met populations were discriminated through flow cytometry evaluation. A mixed-effects analysis of variance test was used for statistical analysis to account for the fact that some samples are paired and correlated. P values are highlighted as follows: ***P<0.001, **P<0.01, *P<0.05. Data are represented as median ± interquartile range. IL indicates interleukin.

Comment in

References

    1. Stephenson E, Savvatis K, Mohiddin SA, Marelli-Berg FM. T cell immunity in myocardial inflammation: pathogenic role and therapeutic manipulation. Br J Pharmacol. 2017;174:3914–3925. doi: 10.1111/bph.13613 - PMC - PubMed
    1. Caforio AL, Pankuweit S, Arbustini E, Basso C, Gimeno-Blanes J, Felix SB, Fu M, Helio T, Heymans S, Jahns R, et al. ; European Society of Cardiology Working Group on Myocardial and Pericardial Diseases. Current state of knowledge on aetiology, diagnosis, management, and therapy of myocarditis: a position statement of the European Society of Cardiology Working Group on Myocardial and Pericardial Diseases. Eur Heart J. 2013;34:2636–2648, 2648a–2648d. doi: 10.1093/eurheartj/eht210 - PubMed
    1. Rose NR. Learning from myocarditis: mimicry, chaos and black holes. F1000Prime Rep. 2014;6:25. doi: 10.12703/P6-25 - PMC - PubMed
    1. Gallagher S, Jones DA, Anand V, Mohiddin S. Diagnosis and management of patients with acute cardiac symptoms, troponin elevation and culprit-free angiograms. Heart. 2012;98:974–981. doi: 10.1136/heartjnl-2011-301121 - PubMed
    1. Heidecker B, Ruedi G, Baltensperger N, Gresser E, Kottwitz J, Berg J, Manka R, Landmesser U, Luscher TF, Patriki D. Systematic use of cardiac magnetic resonance imaging in MINOCA led to a five-fold increase in the detection rate of myocarditis: a retrospective study. Swiss Med Wkly. 2019;149:w20098. doi: 10.4414/smw.2019.20098 - PubMed

Publication types

Substances