. 2022 Nov 23;13(1):7207.
doi: 10.1038/s41467-022-34689-5.

Multi-omics analysis identifies osteosarcoma subtypes with distinct prognosis indicating stratified treatment

Affiliations

Multi-omics analysis identifies osteosarcoma subtypes with distinct prognosis indicating stratified treatment

Yafei Jiang et al. Nat Commun. .

Abstract

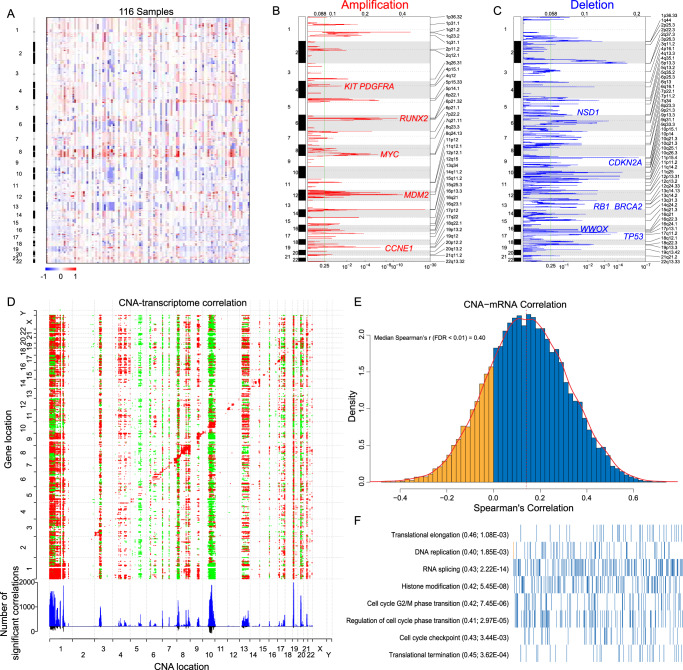
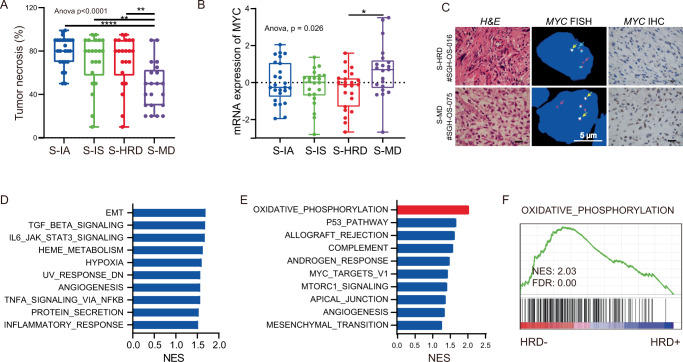
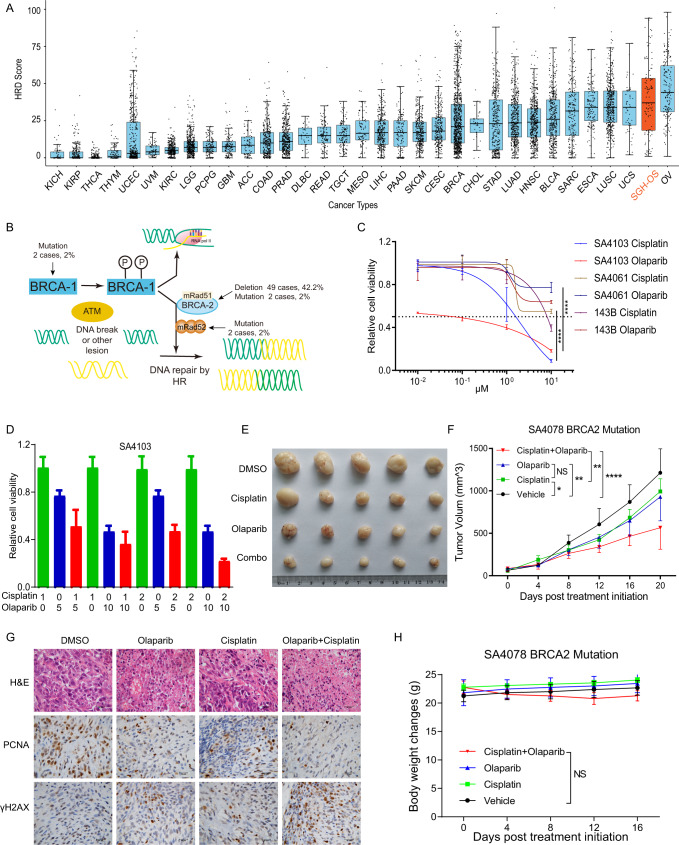
Osteosarcoma (OS) is a primary malignant bone tumor that most commonly affects children, adolescents, and young adults. Here, we comprehensively analyze genomic, epigenomic and transcriptomic data from 121 OS patients. Somatic mutations are diverse within the cohort, and only TP53 is significantly mutated. Through unsupervised integrative clustering of the multi-omics data, we classify OS into four subtypes with distinct molecular features and clinical prognosis: (1) Immune activated (S-IA), (2) Immune suppressed (S-IS), (3) Homologous recombination deficiency dominant (S-HRD), and (4) MYC driven (S-MD). MYC amplification with HR proficiency tumors is identified with a high oxidative phosphorylation signature resulting in resistance to neoadjuvant chemotherapy. Potential therapeutic targets are identified for each subtype, including platinum-based chemotherapy, immune checkpoint inhibitors, anti-VEGFR, anti-MYC and PARPi-based synthetic lethal strategies. Our comprehensive integrated characterization provides a valuable resource that deepens our understanding of the disease, and may guide future clinical strategies for the precision treatment of OS.


Conflict of interest statement

The authors declare no competing interests.

Figures

Fig. 1
Fig. 1. Genomic landscape of OS.
Genetic profile of SGH cohort patients. Each column corresponds to one sample (128 samples are displayed with 9 replicates). A Clinical information of age, sex, position, metastasis, recurrence, pathological classification, ALP (high: >120 U/ml) and clinical Enneking stages. Genetic information included TMB, HRD score (high: >42), ploidy and tumor purity. B Somatic mutated genes that were associated with genome maintenance, oncogene/tumor suppressor gene (Oncogene/TSG), cell cycle, epigenetic and transcriptional regulation; C Cancer-related genes located in significant CNA peaks identified by GISTIC 2.0 with q value <0.25. The number and percentage of mutations and CNAs for each of the genes are shown on the right.
Fig. 2
Fig. 2. Copy number alteration profiles of OS.
A Heatmap of the CNAs of 116 OS tumor samples: red and blue represent copy number gain and loss, respectively. The x axis indicates the 116 tumor samples. B Genome-wide recurring focal amplifications with GISTIC 2.0 FDR q values on the bottom. Peaks were annotated with candidate driver oncogenes in red. C Genome-wide recurrent focal deletions with GISTIC 2.0 FDR q values on the bottom. Candidate driver tumor suppressors within deletion peaks are labeled in blue. D Correlations of CNAs to mRNA expression with cis and trans effects. Significant positive (red) and negative (green) correlations (see “Methods”, FDR < 0.01, Spearman’s correlation) between CNAs and mRNA are indicated in the upper panel. The X-axis and Y-axis are ordered by chromosomal location. The blue bars in the bottom panel represent the number of specific significant correlations, while the black bars indicate the number of common significant correlations. E Distribution of Spearman’s correlation between CNAs and mRNA. CNAs and mRNAs were positively correlated for most (78.9%) CNA-mRNA pairs. The median Spearman’s coefficient of significant correlations (FDR < 0.01) was 0.40. F Significantly enriched functions of genes with significant correlations between CNAs and mRNA. The median correlation coefficient is shown in parentheses, followed by the FDR adjusted P value. Genes in each item (bars on the x-axis) were sorted by correlation coefficients from low to high, with blue and yellow indicating positive and negative correlations, respectively.
Fig. 3
Fig. 3. Single platform features and the corresponding clinical prognosis.
A Transcriptional clustering based on the top 10% most variable genes (1820) across 101 samples. Each column represents one sample and rows indicate genes. B Kaplan–Meier curves for overall survival based on transcriptional clusters (log-rank test). C Copy number clustering based on SCNAs identified by GISTIC 2.0 in 116 samples. Each column represents one sample, and rows indicate CNA peaks. D Kaplan–Meier curves for overall survival based on CNA clusters (log-rank test). E DNA methylation clustering based on the top 8000 variably methylated CpG sites in 116 samples. Each column represents one sample and rows indicate CpG sites. F Kaplan–Meier curves for overall survival based on DNA methylation clusters (log-rank test). Asterisks define significance levels (*p < 0.05; **p < 0.01; ***p < 0.001; ****p < 0.0001).
Fig. 4
Fig. 4. Integrative subtypes with distinct molecular features and varied clinical prognosis.
A Integrative clustering of 91 patients. Top, left to right: immune-activated subtype (S-IA, iCluster1), immune-suppressed subtype (S-IS, iCluster2), HRD dominant subtype (S-HRD, iCluster3) and MYC driven subtype (S-MD, iCluster4). Single platform clustering results: DNA methylation cluster, mRNA cluster and CNA cluster. Basic clinical features: age, gender and Enneking stage. Genetic changes: tumor purity, ploidy, HRD score, somatic mutations and CNAs. Bottom, Heatmaps organized by integrative clustering for copy number, DNA methylation, and mRNA expression. B Kaplan–Meier curves for overall survival based on integrative subtypes (log-rank test).
Fig. 5
Fig. 5. MYC amplification with HR proficiency was associated with OXPHOS activation and poor prognosis.
A Comparison of the tumor necrosis rate among integrative subtypes. The statistical analysis was made by ANOVA with Tukey’s multiple comparisons test. (P < 0.0001). B Gene expression level of MYC in each subtype. The Student’s t test was adopted in significant difference analysis between S-HRD and S-MD. C Rearrangements of MYC tested by FISH and expression level of MYC protein measured with IHC. 3 times repeated independently. D GSEA between MYC-amplified and MYC unamplified OS. E, F GSEA between MYC-amplified HR proficiency and MYC-amplified HR deficiency OS.
Fig. 6
Fig. 6. Immune landscape of OS.
A Heatmap of 72 curated immune markers within OS patients. The integrative subtype information of each patient is annotated at the top. B The immune score, stromal infiltration score and ESTIMATE score among each integrative subtype. The statistical analysis was made by Kruskal–Wallis test. C Immunohistochemistry of CD4, CD8, IDO1, FOXP3 and PD-L1 between iCluser 1–2 and iCluster 3–4. D CDR3 clonotypes of TCRs in each subtype. P = 0.0069, the statistical analysis was made by Kruskal–Wallis test. E Distribution of immune subtypes within integrative subtypes. Asterisks define significance levels (*p < 0.05; **p < 0.01; ***p < 0.001; ****p < 0.0001).
Fig. 7
Fig. 7. Synthetic lethality of olaparib plus cisplatin in HRD-positive OS in vitro and in vivo.
A Distribution of HRD scores within and across 34 cancer types. The SGH-OS cohort is labeled (orange, n = 107). B Schematic model of the HR and the genomic alterations in the key elements. C Dose response curves and IC50 values of HRD-positive (SA4103), HRD-negative (SA4061) and conventional OS cell lines after 48 h of exposure to the cisplatin and PARP inhibitor olaparib. ****p < 0.0001. Data are shown as mean ± SD. n = 3 independent experiments. P values are derived from two-sided t test. D Synthetic lethality of olaparib plus cisplatin in the SA4103 cell line. Data are shown as mean ± SD. n = 3 independent experiments. The statistical analysis was made by ANOVA with Tukey’s multiple comparisons test. Tumor gross specimen (E) and tumor growth curves (F) in a patient-graft xenograft model treated with olaparib and cisplatin individually or in combination. (n = 5 mice per group). Data are represented as the mean ± SD, P values are derived from two-way ANOVA. *p < 0.05; **p < 0.01; ***p < 0.001. G H&E and immunohistochemical analysis of proliferation (PCNA) and DNA damage (γH2AX) in xenografts. The scale bar represents 50 μM. n = 5 independent experiments. H Body weight changes of xenografts treated with olaparib and cisplatin individually or in combination. Data are shown as the mean ± SD. P values are derived from two-way ANOVA.

References

    1. Siegel RL, Miller KD, Jemal A. Cancer statistics, 2020. CA Cancer J. Clin. 2020;70:7–30. doi: 10.3322/caac.21590. - DOI - PubMed
    1. Misaghi A, Goldin A, Awad M, Kulidjian AA. Osteosarcoma: a comprehensive review. SICOT J. 2018;4:12. doi: 10.1051/sicotj/2017028. - DOI - PMC - PubMed
    1. Benjamin RS. Adjuvant and neoadjuvant chemotherapy for osteosarcoma: a historical perspective. Adv. Exp. Med. Biol. 2020;1257:1–10. doi: 10.1007/978-3-030-43032-0_1. - DOI - PubMed
    1. George S. Developments in systemic therapy for soft tissue and bone sarcomas. J. Natl Compr. Canc. Netw. 2019;17:625–628. - PubMed
    1. Chen X, et al. Recurrent somatic structural variations contribute to tumorigenesis in pediatric osteosarcoma. Cell Rep. 2014;7:104–112. doi: 10.1016/j.celrep.2014.03.003. - DOI - PMC - PubMed

Publication types