. 2022 Nov 23;13(1):7184.
doi: 10.1038/s41467-022-34417-z.

RNA-controlled nucleocytoplasmic shuttling of mRNA decay factors regulates mRNA synthesis and a novel mRNA decay pathway

Affiliations

RNA-controlled nucleocytoplasmic shuttling of mRNA decay factors regulates mRNA synthesis and a novel mRNA decay pathway

Shiladitya Chattopadhyay et al. Nat Commun. .

Abstract

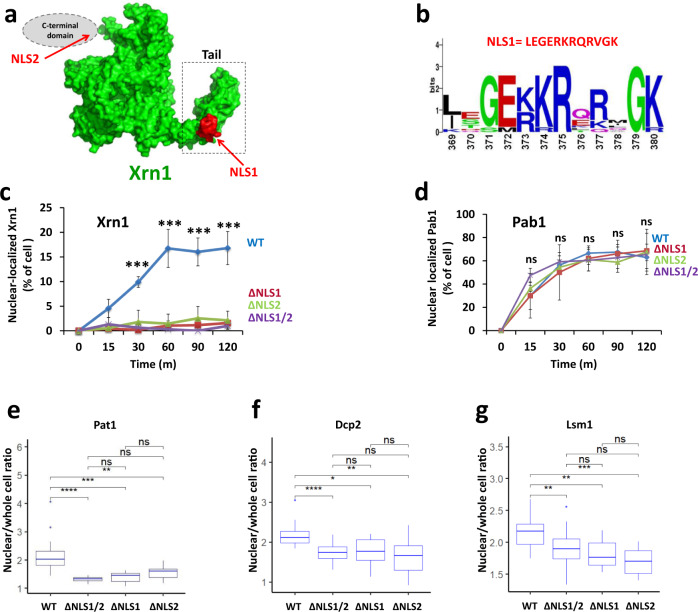
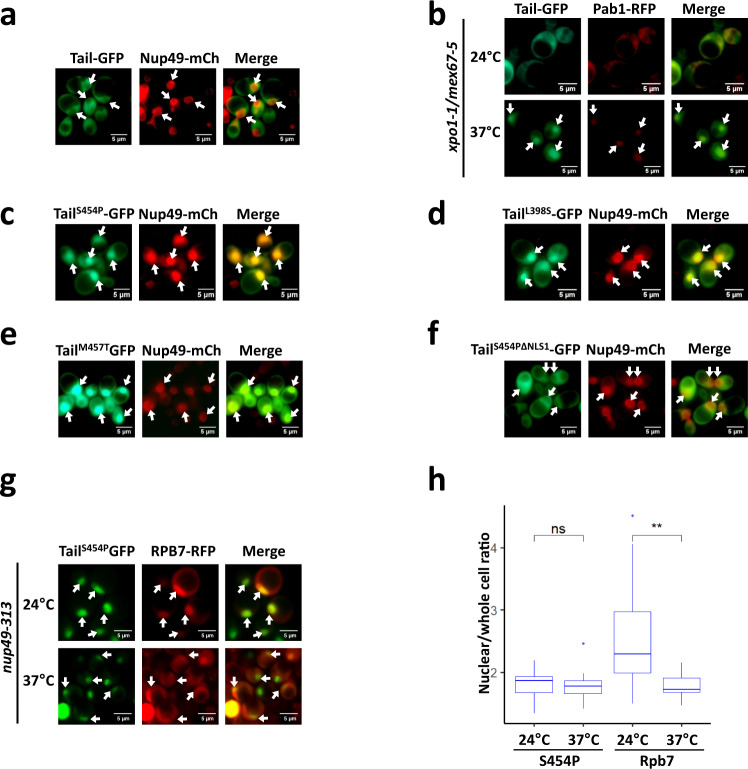
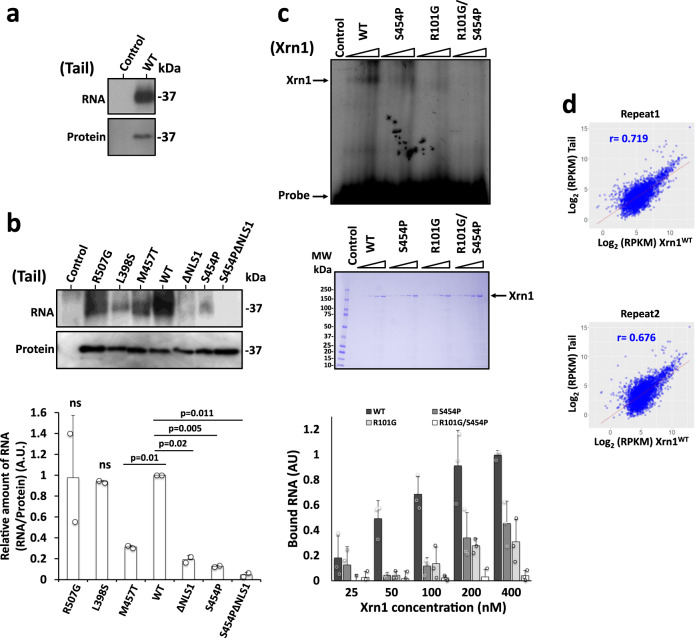
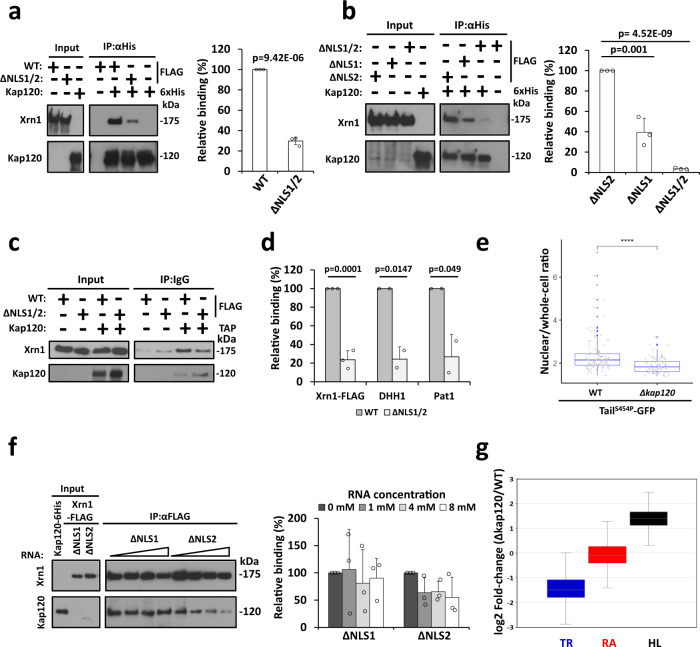
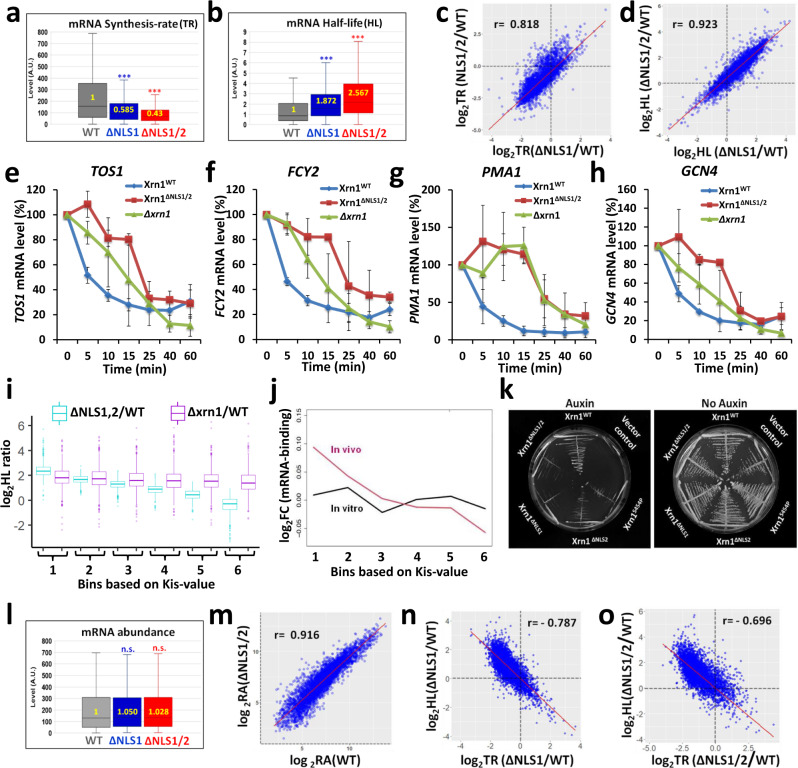
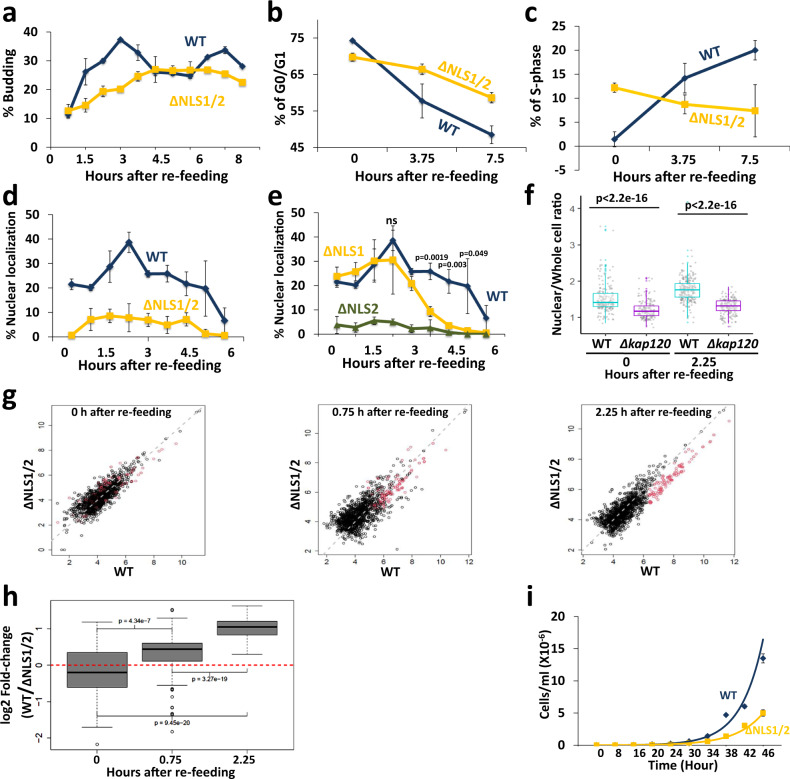
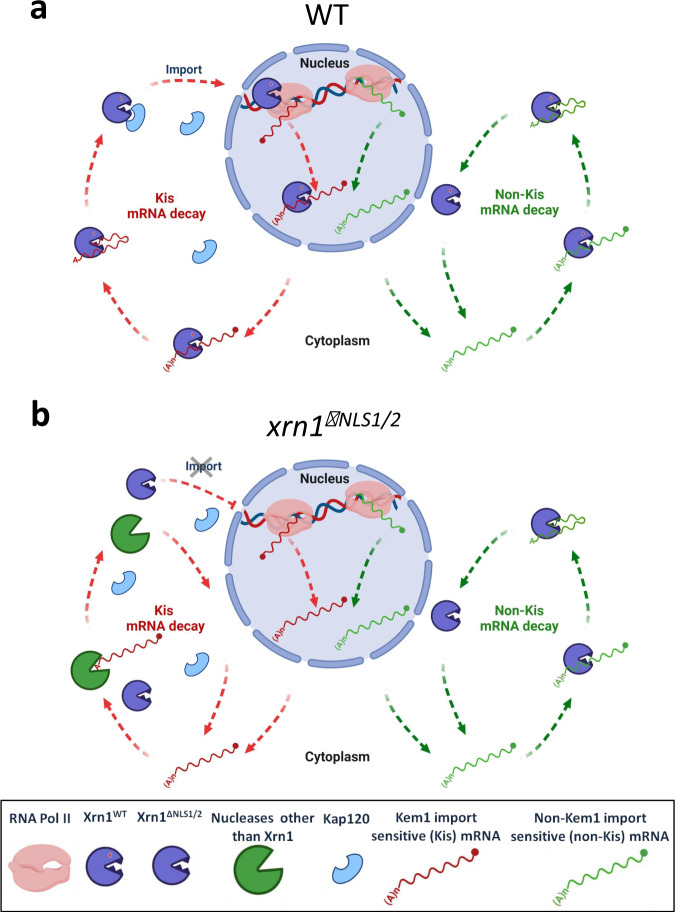
mRNA level is controlled by factors that mediate both mRNA synthesis and decay, including the 5' to 3' exonuclease Xrn1. Here we show that nucleocytoplasmic shuttling of several yeast mRNA decay factors plays a key role in determining both mRNA synthesis and decay. Shuttling is regulated by RNA-controlled binding of the karyopherin Kap120 to two nuclear localization sequences (NLSs) in Xrn1, location of one of which is conserved from yeast to human. The decaying RNA binds and masks NLS1, establishing a link between mRNA decay and Xrn1 shuttling. Preventing Xrn1 import, either by deleting KAP120 or mutating the two Xrn1 NLSs, compromises transcription and, unexpectedly, also cytoplasmic decay, uncovering a cytoplasmic decay pathway that initiates in the nucleus. Most mRNAs are degraded by both pathways - the ratio between them represents a full spectrum. Importantly, Xrn1 shuttling is required for proper responses to environmental changes, e.g., fluctuating temperatures, involving proper changes in mRNA abundance and in cell proliferation rate.


Conflict of interest statement

All authors declare no competing interest.

Figures

Fig. 1
Fig. 1. Xrn1 contains two functional NLSs.
a Position of NLSs. NLS1, found by cNLSmapper, is highlighted in red. Xrn1 structure was modelled using SWISS-MODEL. Tail is indicated by a dashed box. The expected location of the unstructured C-terminal domain containing NLS2 is shown schematically as a grey ellipse. b Sequence conservation of NLS1 among different yeast species. The sequences of 11 yeast strains were compared by the online WebLogo (U. Berkeley). The height of each stack of letters represents the degree of sequence conservation, measured in bits. c Xrn1-GFP import kinetics. A standard import assay was performed, as described in Methods, using cells that co-expressed Pab1-RFP (served as positive control, see d) and Xrn1-GFP or its mutant derivatives, as indicated. Percentage of cells showing nuclear import was measured at the indicated time intervals after inactivation of protein export. n = >100 cells examined over 3 independent experiments. Error bars represent standard deviation (S.D.) p-values of two-tailed t-tests between WT and each of the NLS-mutant are indicated as *** <0.001 for all the pairs. d Import of Pab1, used as a positive control. Error bars in c and d represent standard deviation (S.D.) of three independent assays. eg Starvation-induced nuclear localization of the indicated fluorescent DFs is dependent on Xrn1 NLSs. The mean fluorescence intensity of the nucleus and whole cell of WT or NLS mutant cells expressing the indicated RFP fused DF were measured after 1 h starvation in medium lacking sugar and amino acids. Each box represents the 25th to 75th percentile of values, with the median noted by the horizontal bar. Whiskers terminate at maxima/minima or a distance of 1.5 times the IQR away from the upper/lower quartile, whichever is closer. n = >300 cells examined over 3 independent experiments. The ratio between the nuclear and whole-cell fluorescence is shown as a boxplot. P value was calculated by Wilcoxon rank sum test. * - <0.05; **- <0.01; *** - >0.001; **** - <0.00001; ns – not significant.
Fig. 2
Fig. 2. Some mutant Tail-GFP molecules are localized constitutively in the nucleus.
Tail (amino acid 351 until 521 of the XRN1 sequence) was fused to GFP and was expressed under ADH1 promoter and terminator. Nup49-RFP (a nucleoporin) was used as a nuclear marker. a During optimal proliferation, Tail is mainly cytoplasmic. b Tail-GFP shuttles between cytoplasm and nucleus. Tail-GFP localization was examined by the import assay, as in Fig. 1c. Photos were taken after 2 h at 37 °C. c-e Mutant Tail-GFP molecules that are constitutively localized to the nucleus. The Tail sequence of Tail-GFP was randomly mutagenized by PCR mutagenesis protocol and introduced into WT strain by transformation. Distinct colonies were allowed to proliferate in 96 wells. The cellular localization of the mutants was automatically scanned by fluorescence microscopy using a robot. Shown are some of the mutants that were localized to the nucleus in optimally proliferating cells. See Fig. S2d for positions of the mutations. f TailS454P nuclear import is mediated by NLS1. NLS1 of TailS454P was mutagenized (resulting in TailS454P, ΔNLS1), and the mutant was analysed as in c. g Localization of mutant Tail-GFP in temperature-sensitive (ts) nuclear-import mutant. A shuttling assay, using cells that express nup49-313 and co-expressed xrn1S454P and RPB7-RFP (as a positive control), was performed as described previously. h Quantification of the shuttling assay. The nuclear/whole-cell ratio of the mean fluorescence intensity was determined by ImageJ, as described in Methods. Each box represents the 25th to 75th percentile of values, with the median noted by the horizontal bar. Whiskers terminate at maxima/minima or a distance of 1.5 times the IQR away from the upper/lower quartile, whichever is closer. n = >100 cells examined over 3 independent experiments. P-value was calculated by Wilcoxon rank sum test. ** - p < 0.01. ns – not significant.
Fig. 3
Fig. 3. Xrn1 Tail binds RNA.
a Tail binds RNA. Cells expressing 6xHis-TEV cleavage site-Protein A (HTP) tagged Tail, or control cells carrying no tag, were UV crosslinked. Tail-HTP-RNA complex was affinity purified, the co-purified RNAs trimmed and labelled with 32P and the protein-32P-RNA complexes were separated in denaturing PAGE. Upper panel, autoradiogram (32P-RNA); bottom panel, Western blot using anti-His antibodies. b Some mutations in Tail (indicated above each lane) affect its RNA binding capacity. Affinity purification of the indicated Tail mutants, which had been crosslinked to RNA, was performed as in A. The RNA and protein levels were quantified as described in Methods. RNA levels were normalized to the protein level. WT is arbitrarily defined as 1. Error bars represent standard deviation (S.D.) of 2 replicates. p-values were determined by two-tailed unpaired t-test. c Tail provides a major RNA binding site of Xrn1 which acts in conjunction with the R101 residue of the active site. FLAG-tagged Xrn1, or it’s indicated mutant derivatives, were affinity purified (see Methods), and subject to a gel-shift assay using 32P-5’-RNA (a mixture of 40, 32 and 28 b long), in the presence of EDTA to inactivate the enzyme (see Methods). Increasing amounts of purified proteins were used as indicated. Control lane represents experiment in which the probe was reacted with elute from untagged cells. Quantification of 3 biologically independent experiments is shown at the bottom. Error bars represent standard deviation (S.D.). The results of WT Xrn1 reacted with 400 µM was defined arbitrarily as 1. Purified Xrn1 was run in parallel to verify equal amount of protein loading. Shown is a Coomassie blue straining (middle panel). d RNA bound by Tail is highly correlated to Xrn1 RNA interactome. Tail and Xrn1 were subject to a full CRAC analysis. RPKM values of RNA binding to Tail and Xrn1 were scatter plotted. Two independent biological replicates are shown. Pearson’s correlation (r) is indicated.
Fig. 4
Fig. 4. Kap120 recognizes Xrn1 NLSs.
a Interaction of Kap120 with Xrn1 is mediated by its NLSs. Affinity purified FLAG-tagged Xrn1 or its mutant derivative, Xrn1ΔNLS1/2, and recombinant Kap120-6xHis that had been purified with Ni-NTA column were mixed together and co-IPed with Ni-NTA column, followed by Western blotting. Xrn1-FLAG intensity was normalized to Kap120 intensity, defining Xrn1WT/Kap120 as 100%. n = 3 biologically independent experiments. Error bars represent standard deviation (S.D.). p values were determined by two-tailed unpaired t-test. b Kap120 binds both Xrn1 NLSs. Experiment shown in a was repeated three times. Xrn1-FLAG intensity was normalized to Kap120 intensity, defining arbitrarily Xrn1ΔNLS2/Kap120 as 100%. n = 3 biologically independent experiments. Error bars represent standard deviation (S.D.). p-values were determined by two-tailed unpaired t-test. c Xrn1 interaction with Kap120 is mediated by NLSs in optimally proliferating cells. TAP-tagged Kap120 was affinity purified with IgG-sepharose and the co-IPed proteins were subjected to Western blotting. Quantification is shown in d. d NLS1/2 are required for efficient co-IP with Kap120 of Xrn1 and other DFs. The membrane shown in c and two more membranes of additional replicates were also decorated with anti-Pat1 and anti-Dhh1 antibodies. Signals (minus that of the no-tag control) were normalized to that of Kap120. The normalized WT signal was defined as 100%. n = 3 (for Xrn1), n = 2 (for Dhh1 and Pat1) biologically independent experiments. Error bars represent standard deviation (S.D.). p values were determined by two-tailed unpaired t-test. e Kap120 is used for efficient import of TailS454P-GFP. Optimally proliferating WT or Δkap120 cells expressing TailS454P-GFP and NUP49-mCherry (to mark the nucleus) were inspected microscopically. The nuclear/whole-cell ratio of the fluorescent signal was determined by ImageJ, see Methods. The mean ratio (Mean nuclear intensity/Mean whole-cell intensity) is represented in a jittered box-plot. Each box represents the 25th to 75th percentile of values, with the median noted by the horizontal bar. Whiskers terminate at maxima/minima or a distance of 1.5 times the inter quartile range (IQR) away from the upper/lower quartile, whichever is closer. The p-value was calculated using Wilcoxon rank sum test (**** - ≤ 0.0001) f RNA blocks Xrn1-Kap120 interaction. Interaction between purified Kap120-6xHis and FLAG-tagged Xrn1 carrying mutations in indicated NLS, was determine as in a, except that EDTA (to inactivate Xrn1) and increasing amounts of 40 b RNA were included. Xrn1-Kap120 complexes were affinity purified by anti-FLAG antibodies and analysed and quantified as in a. n = >100 cells examined over 3 independent experiments. Error bars represent standard deviation (S.D.). g Deletion of KAP120 affects mRNA synthesis and decay, but not mRNA level. Genomic Run-On (GRO) analysis was performed (n = 3), as described in Method. Box and whisker plot of the median levels (in arbitrary units) of synthesis rate (SR), half-lives (HLs) and mRNA abundance (RA). Each box represents the 25th to 75th percentile of values, with the median noted by the horizontal bar. Whiskers terminate at maxima/minima or a distance of 1.5 times the IQR away from the upper/lower quartile, whichever is closer. P value was calculated by Wilcoxon rank sum test (p < 0.001).
Fig. 5
Fig. 5. During optimal proliferation conditions, blocking Xrn1 import leads to inefficient mRNA synthesis and decay, without affecting mRNA levels.
GRO analysis was performed, in three replicates, as described in Method. Box and whisker plot of the median levels (in arbitrary units) of a transcription rate (TR); b half-lives (HLs). Each box represents the 25th to 75th percentile of values, with the median noted by the horizontal bar. Whiskers terminate at maxima/minima or a distance of 1.5 times the IQR away from the upper/lower quartile, whichever is closer. p-values were obtained by Wilcoxon rank sum test, ***: p < 0.001. c Defect in TR of xrn1ΔNLS1 is correlated with that of xrn1ΔNLS1/2. Each spot represents an average of 3 replicates. Pearson correlation coefficient (r) are indicated. d Defects of mRNA decay (expressed as in C) of xrn1ΔNLS1 is correlated with that of xrn1ΔNLS1/2. Each spot represents an average of 3 replicates. Pearson correlation coefficient (r) are indicated. e-h The effect of mutating NLSs on decay rates of specific mRNAs, determined by Northern blot hybridization. Decay assay described in Methods. Shown are mRNA levels, quantified using the PhosphorImager technology and normalized to SCR1 mRNA, as a function of time post-transcription arrest. n = 2 biologically independent experiments. Error bars represent standard deviation (S.D.). i For mRNAs with low Kis-values (bins 1-3), the effect of xrn1ΔNLS1/2 mutations on HLs is comparable to ∆xrn1. mRNAs were arranged in a ascending order based on their kis-values and divided into 6 bins with equal number of genes. The ratios between HL in the mutant and that in WT is shown. Box and whisker plot of the logHLs ratios are shown. N = 3 biological replicates. Each box represents the 25th to 75th percentile of values, with the median noted by the horizontal bar. Whiskers terminate at maxima/minima or a distance of 1.5 times the IQR away from the upper/lower quartile, whichever is closer. Note that mRNAs in most bins were affected by XRN1 deletion. j Xrn1 and Xrn1ΔNLS1/2 equally bind mRNA in vitro, as opposed to differential binding in vivo. In vivo or in vitro mRNA interactome profiles of WT and ΔNLS1/2 mutant forms of Xrn1-FLAG were determined, each condition in a duplicate, as follows. Condition I: in vivo. Live cells were UV cross linked followed by a standard RIP-seq. Condition II: in vitro. Purified Xrn1 samples were reacted in vitro with affinity purified poly(A) + mRNA followed by RIP-seq. For each condition, the log2 fold change (FC) of mutant to WT RIP-seq reads was computed, and the median taken within each of these predefined bins (see i). Centering was performed computationally. k Normal proliferation of cells carrying mutations in Xrn1 NLSs is dependent on SKI2. Synthetic sickness assay of NLSs mutants with ski2Δ. ski2Δ, xrn1-AID strains carrying the indicated plasmid were streaked on plates lacking (right panel) or carrying Auxin (that induced Xrn1-AID degradation). Photos were taken after 2 days at 30 oC. l During optimal conditions, mRNA abundance is unaffected by mutations in Xrn1 NLSs. mRNA abundance was determined (Methods). Each box represents the 25th to 75th percentile of values, with the median noted by the horizontal bar. Whiskers terminate at maxima/minima or a distance of 1.5 times the IQR away from the upper/lower quartile, whichever is closer. p-values were obtained by Wilcoxon rank sum test and were found to be not significant (n.s.). Median values in arbitrary unit (A.U.) are indicated inside the plots. m mRNA Abundance (RA) in xrn1∆NLS1/2are correlated with those in WT. Each spot represents an average of 3 biological replicates. Pearson correlation coefficient (r) is indicated. n-o The effects of NLS1 (n) or NLS1/2 (o) disruption on transcription rates (TR) are correlated with their effects on HLs. Scatter-plot of log2 mutant/WT ratio. Each spot represents an average of 3 replicates. Pearson correlation coefficient (r) is indicated.
Fig. 6
Fig. 6. Xrn1∆NLS1/2 abnormally responds to changes in the environment.
a xrn1∆NLS1/2 mutant cells bud abnormally slowly during exit from long-term starvation to sated conditions. Seven days starved cells were re-fed (see Methods) and percentage of budded cells was plotted as a function of time post re-feeding. n = 2 biologically independent experiments. Error bars represent standard deviation (S.D.). b, c xrn1∆NLS1/2 mutant cells enter abnormally slowly into S-phase, as assayed by Flow cytometry (FACS) analysis. Cells were re-fed as in a. DNA content was determined by FACS, and plotted as a function of time post-re-feeding. n = 3 biologically independent experiments. Error bars represent standard deviation (S.D.). d Xrn1WT-GFP, but not Xrn1∆NLS1/2-GFP accumulates in the nucleus concomitantly with bud appearance. Cells were inspected under a fluorescence microscope and % cells with nuclear localization of GFP was plotted as a function of time following re-feeding. Error bars represent S.D. of 3 replicates. Note that, in this import experiment, no cycloheximide was added to avoid its effect on the actual process of exiting the starvation. Therefore, in this case (unlike our other experiments), we cannot differentiate between import of pre-existing Xrn1 or newly synthesized one. n = 3 biologically independent experiments. Error bars represent standard deviation (S.D.). e NLS2 is required for Xrn1 import during starvation and exit from starvation, whereas NLS1 is required only following 3h post re-feeding. The indicated mutant cells were examined following re-feeding as in d. n = 3 biologically independent experiments. Error bars represent standard deviation (S.D.). p-values were determined by two-tailed unpaired t-test. ns not-significant. f Kap120 is required for efficient import of Xrn1 during starvation and upon exit from starvation. WT or Δkap120 cells, expressing XRN1-GFP and RPB7-RFP (to mark the nucleus), were inspected microscopically. After examining the starved cells (Time 0), the culture was re-fed as in a and examined microscopically at 2.25 h later. The nuclear/whole-cell ratio was performed as in Fig. 4e. P-value, based on 3 replicates, was calculated by Wilcoxon rank sum test. g Xrn1 induces transcription of a group of genes during exit from starvation. Starvation exit experiment was done as in a. RNA was sequenced (Methods). Reads were normalized to spike-in (S. pombe) and plotted (Methods). h NLS1/2 of Xrn1 are necessary for efficient expression of a group of mRNAs during exit from starvation. Genes that were sensitive to Xrn1 NLSs (red dots in g) were selected. Fold-change of mRNA level is expressed as a ratio between the normalized WT and the normalized ∆NLS1/2 mutant mRNA level. Each box represents the 25th to 75th percentile of values, with the median noted by the horizontal bar. Whiskers terminate at maxima/minima or a distance of 1.5 times the IQR away from the upper/lower quartile, whichever is closer; P-values from the Wilcoxon signed-rank test are indicated for each comparison. i Xrn1 import is required for normal proliferation rate under fluctuating temperatures. See Methods. Both strains proliferated comparably at constant temperatures (see Fig. S5d-f). n = 2 biologically independent experiments. Error bars represent standard deviation (S.D.).
Fig. 7
Fig. 7. A proposed model for two Xrn1-mediated mRNA decay pathways.
a WT cells. Left pathway (red arrows) illustrates the Kis mRNA decay pathway, which begins in the nucleus. Xrn1 binds promoters and stimulates transcription. During transcription, it binds the emerging transcript, most probably at its 3’ end,. This RNA is protected against Xrn1 activity by a 5’ cap, yet Xrn1 is immediately available upon decapping, or after endonucleolytic RNA cleavage. In this model, we hypothesize that Xrn1 does not dissociate from binding the 3’ end. Thus, upon decapping, Xrn1 binds both the 5’P and the 3’ RNA end (until advance stage of the RNA degradation). This hypothesis remains to be examined experimentally. Following RNA decay, NLS1 is exposed and binds Kap120, and Xrn1 is imported to begin a new cycle. Right pathway (green arrows): the decay of non-Kis mRNAs is, by definition, insensitive to Xrn1 shuttling. It is confined to the cytoplasm and follows the standard model of mRNA decay,. b xrn1ΔNLS1/2cells. Kis mRNAs are degraded mainly by the Xrn1-independent pathway, quite possibly by the exosome - as it becomes essential in xrn1ΔNLS1/2 cells (Fig. 5k). In general, we propose that most mRNAs are simultaneously degraded by the two pathways, the impact of each pathway on the overall degradation is mRNA specific and is related to the “Kis value”. See text for more details. Created with “BioRender.com”.

References

    1. Begley V, et al. The mRNA degradation factor Xrn1 regulates transcription elongation in parallel to Ccr4. Nucleic Acids Res. 2019;47:9524–9541. doi: 10.1093/nar/gkz660. - DOI - PMC - PubMed
    1. Fischer J, et al. The yeast exoribonuclease Xrn1 and associated factors modulate RNA polymerase II processivity in 5’ and 3’ gene regions. J. Biol. Chem. 2020;295:11435–11454. doi: 10.1074/jbc.RA120.013426. - DOI - PMC - PubMed
    1. Haimovich G, et al. Gene Expression Is Circular: Factors for mRNA Degradation Also Foster mRNA Synthesis. Cell. 2013;153:1000–1011. doi: 10.1016/j.cell.2013.05.012. - DOI - PubMed
    1. Hartenian E, Glaunsinger BA. Feedback to the central dogma: cytoplasmic mRNA decay and transcription are interdependent processes. Crit. Rev. Biochem. Mol. Biol. 2019;0:1–14. - PMC - PubMed
    1. Sun M, et al. Global analysis of Eukaryotic mRNA degradation reveals Xrn1-dependent buffering of transcript levels. Mol. Cell. 2013;52:52–62. doi: 10.1016/j.molcel.2013.09.010. - DOI - PubMed

Publication types