. 2022 Nov 22;13(1):7149.
doi: 10.1038/s41467-022-34791-8.

Expanding cross-presenting dendritic cells enhances oncolytic virotherapy and is critical for long-term anti-tumor immunity

Affiliations

Expanding cross-presenting dendritic cells enhances oncolytic virotherapy and is critical for long-term anti-tumor immunity

Judit Svensson-Arvelund et al. Nat Commun. .

Abstract

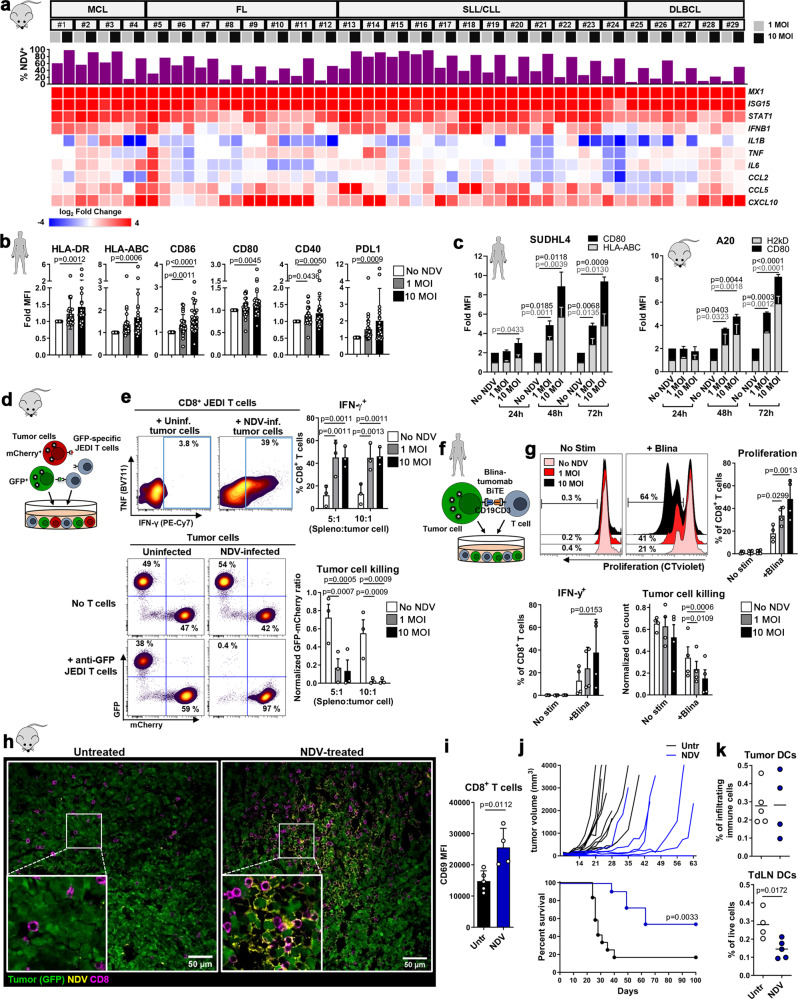
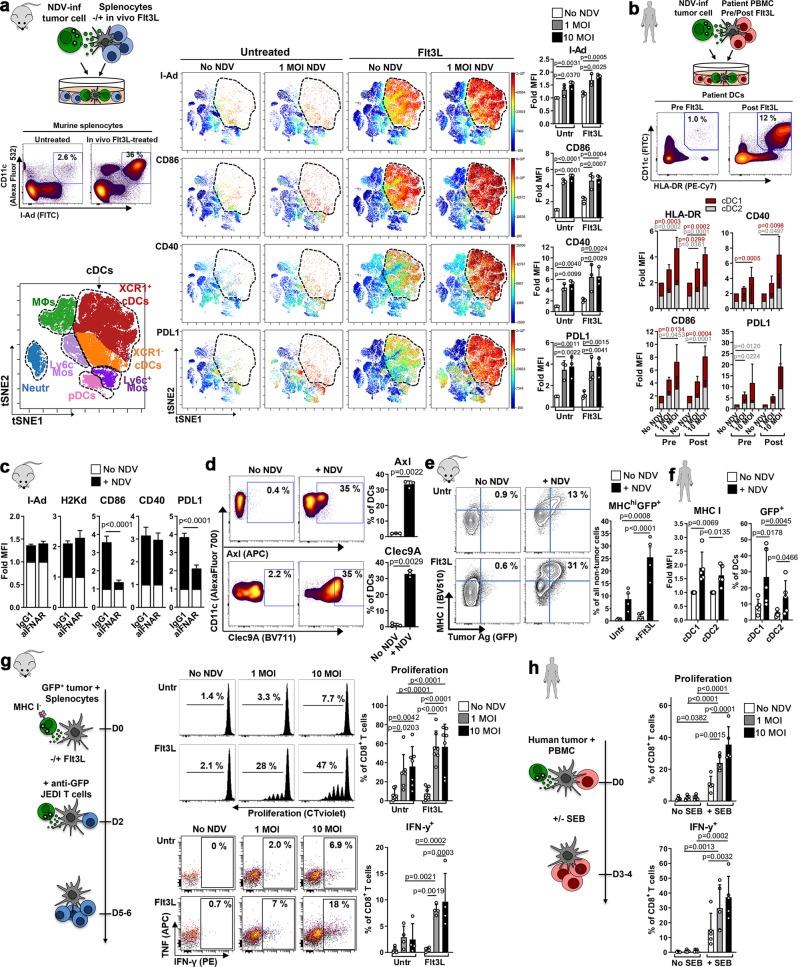
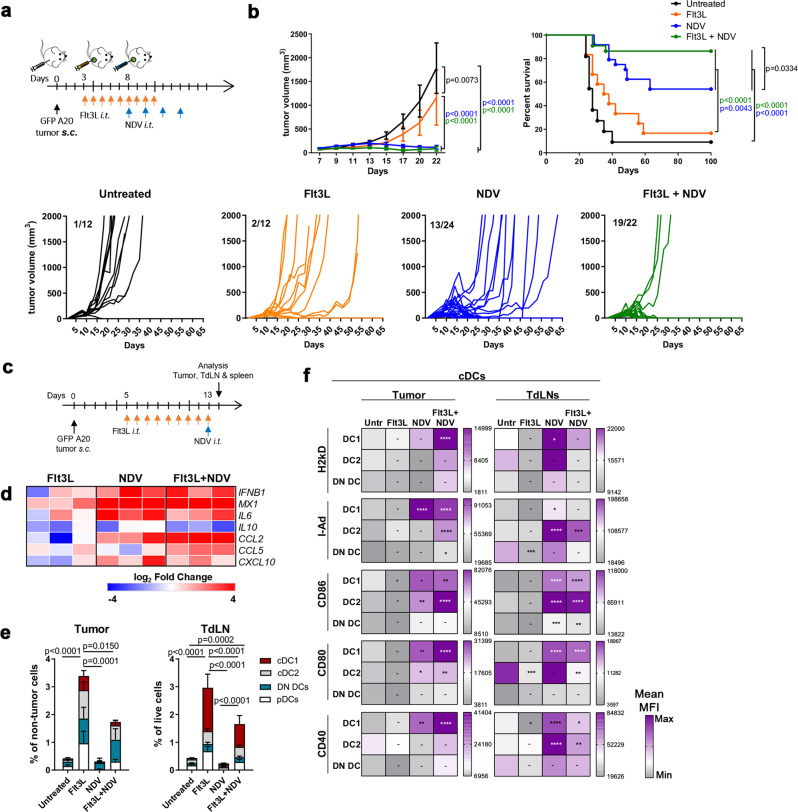
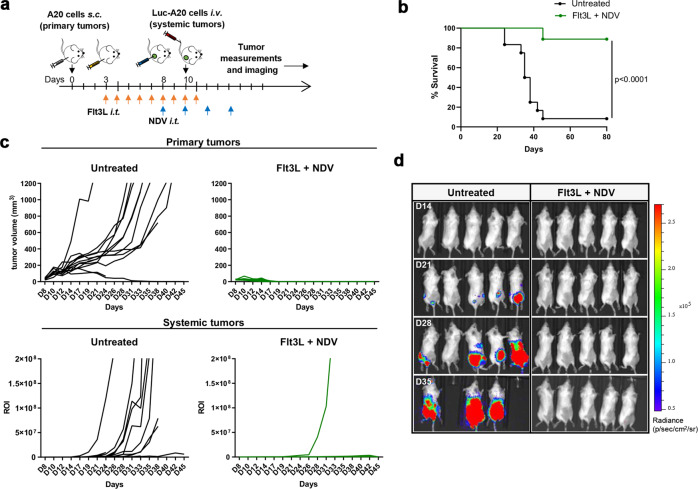
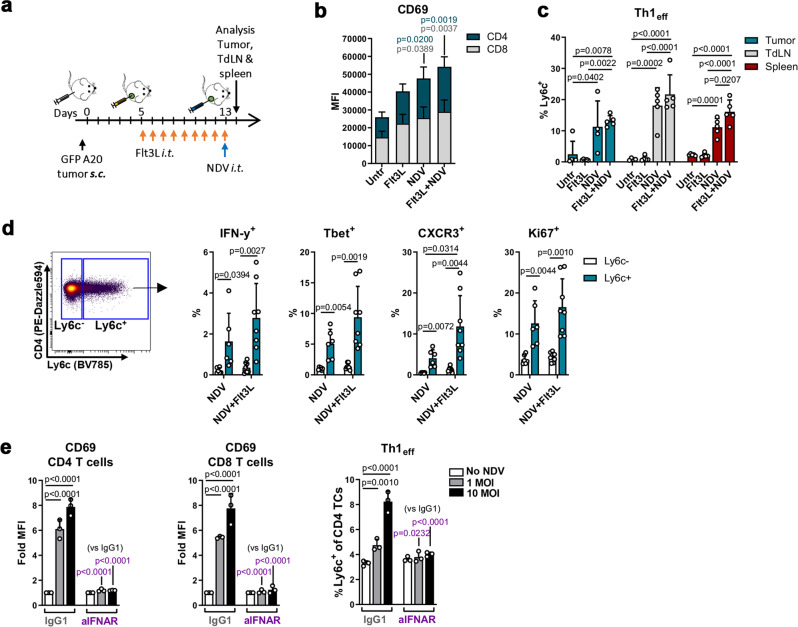
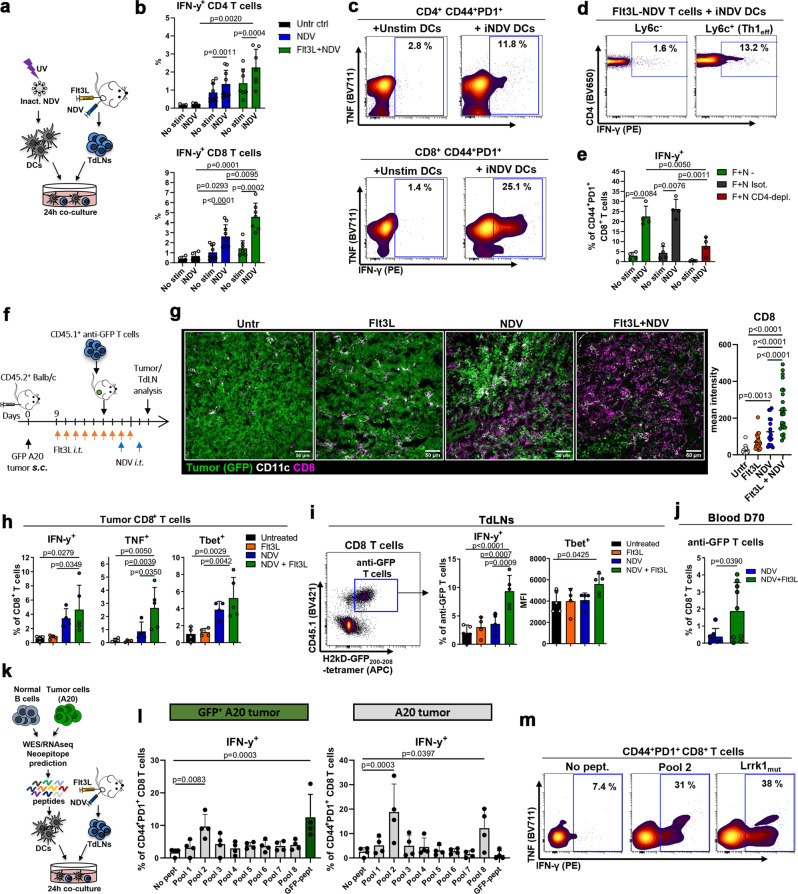
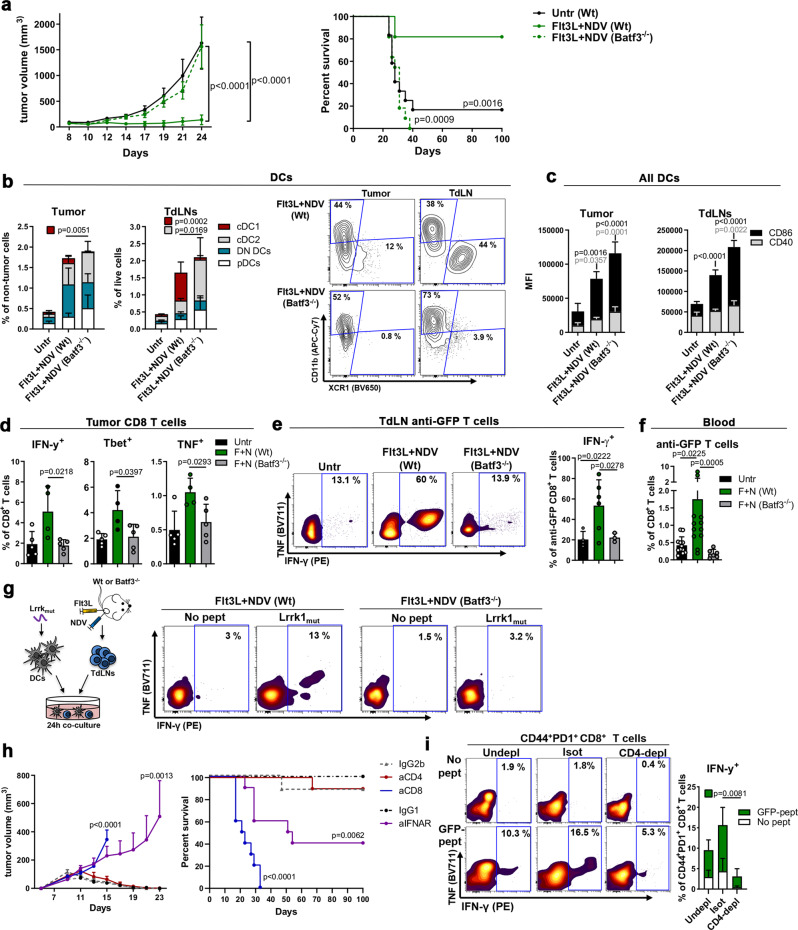
Immunotherapies directly enhancing anti-tumor CD8+ T cell responses have yielded measurable but limited success, highlighting the need for alternatives. Anti-tumor T cell responses critically depend on antigen presenting dendritic cells (DC), and enhancing mobilization, antigen loading and activation of these cells represent an attractive possibility to potentiate T cell based therapies. Here we show that expansion of DCs by Flt3L administration impacts in situ vaccination with oncolytic Newcastle Disease Virus (NDV). Mechanistically, NDV activates DCs and sensitizes them to dying tumor cells through upregulation of dead-cell receptors and synergizes with Flt3L to promote anti-tumor CD8+ T cell cross-priming. In vivo, Flt3L-NDV in situ vaccination induces parallel amplification of virus- and tumor-specific T cells, including CD8+ T cells reactive to newly-described neoepitopes, promoting long-term tumor control. Cross-presenting conventional Type 1 DCs are indispensable for the anti-tumor, but not anti-viral, T cell response, and type I IFN-dependent CD4+ Th1 effector cells contribute to optimal anti-tumor immunity. These data demonstrate that mobilizing DCs to increase tumor antigen cross-presentation improves oncolytic virotherapy and that neoepitope-specific T cells can be induced without individualized, ex vivo manufactured vaccines.


Conflict of interest statement

Research support for these studies was provided by Celldex Therapeutics and Genentech. M.Y. and H.M. are employed by Celldex Therapeutics. D.O., S.J. and C.M. are employed by Genentech. The authors declare no other competing interests.

Figures

Fig. 1
Fig. 1. NDV enhances immunogenicity and susceptibility of tumor cells to T cell-mediated killing.
a Expression of IFN-stimulated and pro-inflammatory genes in patient lymphoma samples (MCL and SLL/CLL from blood, FL and DLBCL from lymph nodes) 24 h post infection (p.i.) with NDV; top graph shows percent infected CD19+ tumor (analyzed by flow cytometry); the heat map shows the Log2 fold expression vs ‘No NDV’ (quantitative RT-PCR) (n = 29). b, c Fold expression (vs ‘No NDV’) of MHC and co-stimulatory molecules on (b) patient lymphoma cells (n = 29) 24 h p.i. and (c) SUDHL4 (HLA-ABC, n = 4, CD80, n = 6) and A20 (H2kD, n = 2, CD80, n = 3) cells 24, 48 and 72 h p.i. Repeated measures One-way ANOVA (b) or Two-way ANOVA (c) with Dunnett’s multiple comparisons test. d, e Uninfected/NDV-preinfected GFP+ and mCherry+ A20 cells (ratio 1:1) were co-cultured with JEDI splenocytes at the indicated ratios. JEDI CD8+ T cell activation and tumor cell killing (e) were analyzed after 5 days (n = 3). Repeated measures Two-way ANOVA with Dunnett’s multiple comparisons test. f Uninfected/NDV-preinfected SUDHL4 cells were co-cultured with CD8+ T cells in the presence of Blinatumomab (Blina). T cell activation and tumor cell killing (g) were analyzed after 3 days (n = 4). Repeated measures One-way ANOVA with Dunnett’s multiple comparisons test. h GFP+ A20 tumor-bearing Balb/c mice were treated with intratumoral NDV and tumors were harvested after 24 h. Representative confocal images are shown (Untr, n = 2; NDV, n = 3). i Intratumoral CD8+ T cells from mice treated as in (h) were analyzed by flow cytometry (Untr, n = 5; NDV, n = 4; unpaired, two-tailed t-test). j GFP+ A20 tumor-bearing mice were treated with NDV (days 8, 10, 12, 14) and monitored for tumor growth and survival (untreated, n = 12; NDV, n = 11). Log-rank (Mantel-Cox) test. k Intratumoral and TdLN DCs from mice treated as in (h) were analyzed by flow cytometry (Untr, n = 5; NDV, n = 4;, unpaired, two-tailed t-test). Data show mean ± SD. MCL mantle cell lymphoma, SLL small lymphocytic lymphoma, CLL chronic lymphocytic leukemia, FL follicular lymphoma, DLBCL diffuse large B cell lymphoma.
Fig. 2
Fig. 2. Flt3L enhances cross-priming of anti-tumor CD8+ T cells upon NDV-cytolysis.
a Uninfected/NDV-preinfected GFP+ A20 cells were co-cultured with splenocytes from untreated/Flt3L-treated mice (contour plots show % cDCs of all splenocytes) and analyzed after 24 h. Representative viSNE plots showing myeloid cell populations (left) and relative expression (color code = mean MFI) of different markers (right). Bar graphs show mean MFI of cell-surface markers on cDCs (CD11c+I-Ad+). Repeated measures two-way ANOVA with Dunnett’s multiple comparisons test. n = 3 b Uninfected/NDV-preinfected GFP+ SUDHL4 cells were co-cultured with patient-derived PBMCs, pre- and post-Flt3L treatment, and analyzed after 24 h. Representative (n = 5) contour plots showing percent HLA-DR+CD11c+ cDCs (of all non-tumor cells) pre- and post-Flt3L treatment. Stacked bar graphs showing fold expression (vs ‘No NDV’) of activation markers in cDC1s (CD141+) and cDC2s (CD1c+). One-way ANOVA with Dunnett’s multiple comparisons test (n = 5). c Cells were cultured as in (a) with IFNAR-blocking or isotype-control antibodies and cDCs were analyzed. d Expression of Axl and Clec9A in cDCs cultured as in (a). c, d Graphs show No NDV vs 10 MOI data analyzed in triplicates, representative from at least 2 independent experiments. One-way ANOVA with Dunnett’s multiple comparisons test. e Tumor Ag (GFP)-uptake and MHC I expression in splenocytes from untreated/Flt3L-treated mice, after co-culture with uninfected/NDV-preinfected GFP+ A20 cells (n = 4); repeated measures One-way ANOVA with Sidak’s multiple comparisons test. f Tumor Ag (GFP)-uptake and MHC I expression in human cDC1 (CD141+) and cDC2 (CD1c+) DCs in PBMCs derived from Flt3L-treated patients, after co-culture with uninfected/NDV-preinfected GFP+ SUDHL4 cells. Repeated measures One-way ANOVA with Dunnett’s multiple comparisons test (n = 5). g NDV-preinfected MHC I-deficient GFP+ A20 cells were co-cultured with splenocytes (from untreated or Flt3L-treated mice) for 48 h and CellTrace violet-stained JEDI T cells were added to co-cultures and analyzed after 3–4 days. Representative flow cytometry data and quantification of proliferation (n = 7) and cytokine production (n = 4) in CD8+ T cells. h NDV-preinfected SUDHL4 cells were co-cultured with CellTrace violet-stained PBMCs +/− Staphylococcal enterotoxin B (SEB). CD8+ T cells (n = 5) were analyzed after 3 days. g, h Two-way ANOVA with Sidak’s multiple comparisons test. Data show mean ± SD.
Fig. 3
Fig. 3. NDV therapy in DC-enriched tumors potentiates myeloid activation and tumor regressions.
a GFP+ A20 tumor-bearing mice were treated as indicated and (b) followed for tumor growth (mean ± s.e.m, or individual growth curves, lower panel, numbers refer to mice with complete remission (CR) versus total number of mice (CR/total) in each group) and survival; data from untreated (untr, n = 11), Flt3L (n = 12), NDV (n = 24) and Flt3L+NDV (n = 22) groups, pooled from 2 independent experiments. Two-way ANOVA with Tukey’s multiple comparisons test (tumor size) and Log-rank (Mantel-Cox) test (survival). c GFP+ A20 tumor-bearing mice were treated as indicated and tumor, TdLNs and spleens were harvested and analyzed by quantitative RT-PCR (heat map, log2 fold changes vs ‘Untreated’) (d) or by spectral flow cytometry (e, f) (n = 5). e Stacked bar graphs of cDC1 (XCR1+), cDC2 (CD11b+), DN (XCR1-CD11b double-negative) cDC (CD11c+I-Ad+) subsets and pDCs (B220+Ly6Chi CD11clowI-Adlow) in the tumor or TdLNs. Statistics show differences in the total DC population between treatments. One-way ANOVA with Tukey’s multiple comparisons test. f The heat maps show the relative expression (mean MFI of 5 individual mice) of activation markers in different cDC subsets. Two-way ANOVA with Holm-Sidak’s multiple comparisons test (vs untreated). Data show mean ± SD. *p < 0.05, **p < 0.01, ***p < 0.001, ****p < 0.0001.
Fig. 4
Fig. 4. Flt3L + NDV combination therapy induces efficient systemic anti-tumor immunity.
a GFP+ A20 tumor-bearing mice were treated as indicated and additionally challenged with systemic luciferase+ (Luc) A20 tumors. Mice were followed for survival (b), primary tumor growth (c, upper panel) and systemic tumor growth (c, lower panel, quantification of luminescence signal). Log-rank (Mantel-Cox) test (b). d Representative bioluminescence imaging on days 14, 21, 28 and 35 post tumor inoculation. n = 12 (untreated), n = 9 (Flt3L + NDV).
Fig. 5
Fig. 5. NDV therapy induces type I IFN-dependent T cell activation.
a GFP+ A20 tumor-bearing mice were treated as indicated and tumor, TdLNs and spleens were harvested and analyzed by spectral flow cytometry (bd). b Stacked bar graphs of activation marker expression on intratumoral CD8+ and CD4+ T cells. One-way ANOVA with Tukey’s multiple comparisons test (vs untreated). c Percent Ly6c+ Th1 effector cells (Th1eff) within CD4+ T cells. One-way ANOVA with Tukey’s multiple comparisons test; n = 5 mice per group (b, c). d Tumors from NDV-alone or Flt3L+NDV-treated GFP+ A20 tumor-bearing mice were harvested and IFN-γ, Tbet, CXCR3 and Ki67 were analyzed in Ly6C+ vs Ly6C CD4+ T cells. Paired, two-tailed t-test; NDV, n = 6; Flt3L+NDV, n = 8. Representative from 2 independent experiments. e Uninfected or NDV-preinfected A20 cells were co-cultured with splenocytes in the presence of 20 μg/ml IFNAR-blocking or isotype-control antibodies. After 24 h, T cells were analyzed by flow cytometry; Two-way ANOVA with Dunnett’s multiple comparisons test. Data show mean ± SD.
Fig. 6
Fig. 6. Combination therapy enhances viral and tumor Ag responses in vivo.
ad TdLNs from untreated (ctrl), NDV- or Flt3L+NDV-treated A20-tumor-bearing mice were co-cultured with DCs: unstimulated (No stim) or pulsed with UV-inactivated NDV (iNDV); T cells were analyzed after 24 h. b IFN-γ+ T cells in untreated (n = 4), NDV (n = 9) and Flt3L+NDV (n = 7) groups, pooled from 2 independent experiments. Paired, two-tailed t-test (No stim vs iNDV) or one-way ANOVA with Tukey’s multiple comparisons test for comparison between treatments. c, d Percentage of iNDV-reactive cells within CD44+PD1+ CD4+ (top) or CD8+ (bottom) T cells (c) and within Ly6C vs Ly6C+ CD4+ T cells (d). e TdLN T cells from Flt3L+NDV-treated A20-tumor-bearing mice pre-treated with CD4-depleting or isotype-control antibodies were analyzed as in (a). Paired, two-tailed t-test (No stim vs iNDV) or one-way ANOVA with Tukey’s multiple comparisons test for comparison between treatments (n = 4). f GFP+ A20-tumor-bearing mice were treated as indicated, anti-GFP CD45.1+CD8+ T cells were adoptively transferred, and tumoral/TdLN T cells were analyzed after 5 days by immunofluorescence (g) or spectral flow cytometry (h, i). g Representative tumor images, and CD8 mean intensity from a total of 18-27 20x images per group (Untr and NDV, n = 2; Flt3L and Flt3L+NDV, n = 3); One-way ANOVA with Tukey’s multiple comparisons test. h IFN-γ, TNF and Tbet expression in intratumoral CD8+ T cells. i Representative dot plot showing anti-GFP JEDI T cells in the TdLN (left) and bar graphs of JEDI IFN-γ and Tbet expression (right). h, i n = 5 mice per group; one-way ANOVA with Dunnett’s multiple comparisons test. j Mice with complete remissions (NDV, n = 7; Flt3L+NDV, n = 9) were analyzed for blood tetramer+ anti-GFP CD8+ T cells day 70 after tumor inoculation. Unpaired, two-tailed t-test. km TdLN cells from Flt3L+NDV-treated A20 or GFP+ A20-tumor-bearing mice were co-cultured with DCs pulsed with pooled or individual neoepitope peptides identified by exome and RNA sequencing, or GFP-peptide. l, m IFN-γ production after 24 h; data pooled from 2 independent experiments, n = 4 mice per tumor type, one-way ANOVA with Dunnett’s multiple comparisons test (l) and representative (n = 4) contour plots of CD44+PD1+CD8+ T cells reactive to peptide pool 2 and Lrrk1mut (m). Data show mean ± SD.
Fig. 7
Fig. 7. Batf3-DCs are critical for the anti-tumor effects of Flt3L + NDV.
a Flt3L+NDV-treated GFP+ A20-tumor-bearing Wt or Batf3−/− mice were followed for tumor growth (mean ± s.e.m) and survival (untreated, n = 12; Flt3L+NDV Wt, n = 11; Flt3L+NDV Batf3−/−, n = 11). Two-way ANOVA with Tukey’s multiple comparisons test (tumor size) and Log-rank (Mantel-Cox) test (survival). b, c Tumors/TdLNs from treated GFP+ A20-tumor-bearing mice were analyzed by spectral flow cytometry. Stacked bar graphs and representative contour plots of cDC1, cDC2, DN cDCs or pDCs (b) and stacked bar graphs of CD86/CD40 expression (vs Untr) in all cDCs (c). b, c One-way ANOVA with Tukey’s multiple comparisons test; n = 5 mice per group. d, e GFP+ A20-tumor-bearing Wt or Batf3−/− mice were treated with Flt3L+NDV. Anti-GFP CD45.1+CD8+ (JEDI) T cells were adoptively transferred and tumoral/TdLN T cells were analyzed after 5 days. IFN-γ, TNF and Tbet expression in intratumoral CD8+ T cells (Untr; n = 5, Flt3L+NDV Wt, n = 4, Flt3L+NDV Batf3−/−, n = 5) (d) and representative contour plots and bar graphs showing IFN-γ in JEDI T cells from TdLNs (after completed treatment) upon GFP-peptide stimulation ex vivo (e) (Untr; n = 4, Flt3L+NDV Wt, n = 6, Flt3L+NDV Batf3−/−, n = 3). f Mice in (a) were analyzed for blood anti-GFP tetramer+CD8+ T cells 7 days after completed treatment. Kruskal-Wallis with Dunn’s multiple comparisons test; n = 12 (untr, Flt3L+NDV Wt) and n = 6 (Flt3L + NDV Batf3−/−). g TdLN cells from tumor-bearing Flt3L+NDV-treated mice were co-cultured with Lrrk1mut peptide-pulsed DCs; T cells were analyzed after 24 h. IFN-γ in CD44+PD1+CD8+ T cells, representative from two A20- and three GFP+ A20-bearing mice. h GFP+ A20-tumor-bearing Wt mice treated with anti-CD8, anti-CD4, anti-IFNAR or isotype-control antibodies were treated with Flt3L+NDV and followed for tumor growth (mean ± s.e.m) and survival. Two-way ANOVA with Sidak’s multiple comparisons test (tumor size) and Log-rank (Mantel-Cox) test (survival); n = 8 (IgG2b), n = 9 (IgG1, anti-CD8), n = 10 (anti-CD4, anti-IFNAR). i TdLNs from mice treated as in (g) with anti-CD4 or isotype-control antibodies and Flt3L+NDV were co-cultured with unstimulated (No pept) or GFP-peptide pulsed (GFP-pept) DCs and analyzed after 24 h. Representative contour plots and quantification of IFN-γ in CD44+PD1+CD8+ T cells. One-way ANOVA with Tukey’s multiple comparisons test, n = 4 mice per group. Data show mean ± SD.

References

    1. Kim JH, Lee KJ, Lee SW. Cancer immunotherapy with T-cell targeting cytokines: IL-2 and IL-7. BMB Rep. 2021;54:21–30. doi: 10.5483/BMBRep.2021.54.1.257. - DOI - PMC - PubMed
    1. Salmon H, et al. Expansion and activation of CD103(+) dendritic cell progenitors at the tumor site enhances tumor responses to therapeutic PD-L1 and BRAF inhibition. Immunity. 2016;44:924–938. doi: 10.1016/j.immuni.2016.03.012. - DOI - PMC - PubMed
    1. Spranger S, Dai D, Horton B, Gajewski TF. Tumor-residing Batf3 dendritic cells are required for effector T cell trafficking and adoptive T cell therapy. Cancer Cell. 2017;31:711–723 e714. doi: 10.1016/j.ccell.2017.04.003. - DOI - PMC - PubMed
    1. Theisen DJ, et al. WDFY4 is required for cross-presentation in response to viral and tumor antigens. Science. 2018;362:694–699. doi: 10.1126/science.aat5030. - DOI - PMC - PubMed
    1. Hildner K, et al. Batf3 deficiency reveals a critical role for CD8alpha+ dendritic cells in cytotoxic T cell immunity. Science. 2008;322:1097–1100. doi: 10.1126/science.1164206. - DOI - PMC - PubMed

Publication types