

Identification of potential microRNA diagnostic panels and uncovering regulatory mechanisms in breast cancer pathogenesis
- PMID: 36418345
- PMCID: PMC9684445
- DOI: 10.1038/s41598-022-24347-7
Identification of potential microRNA diagnostic panels and uncovering regulatory mechanisms in breast cancer pathogenesis
Abstract
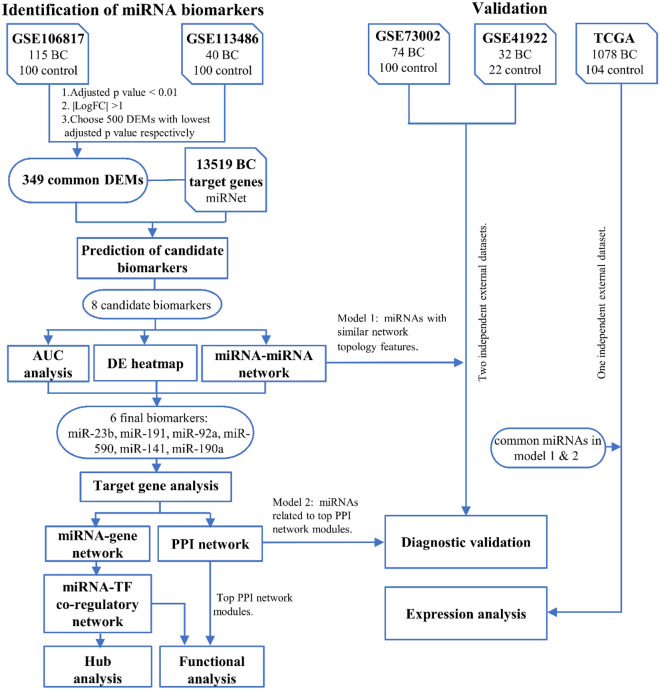
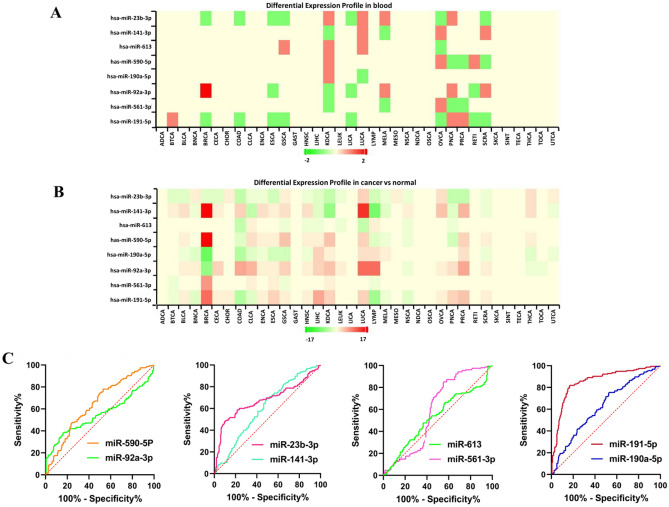
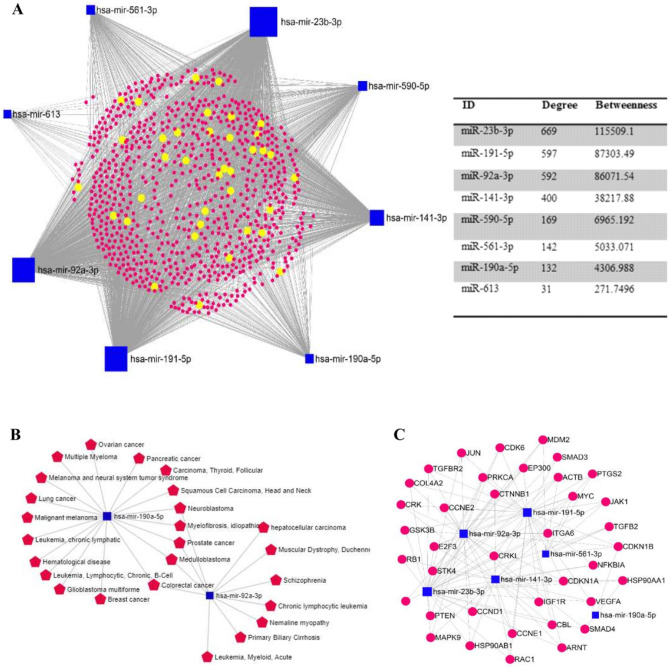
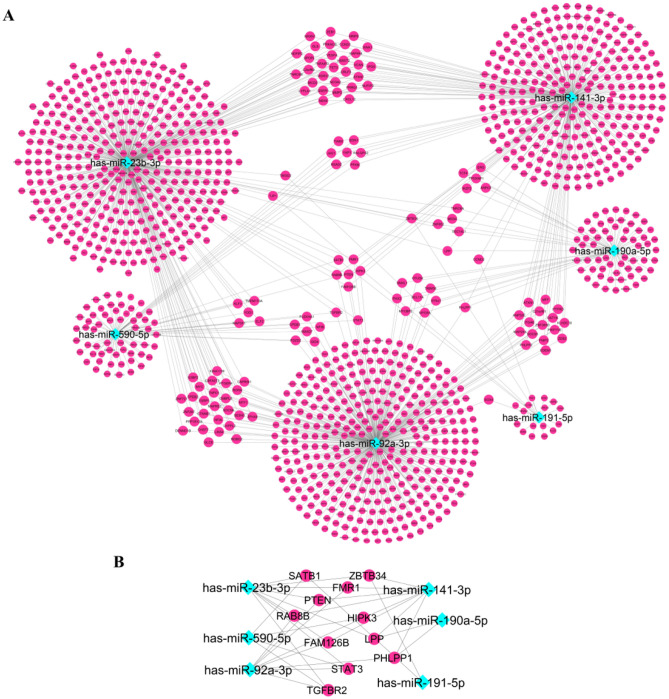
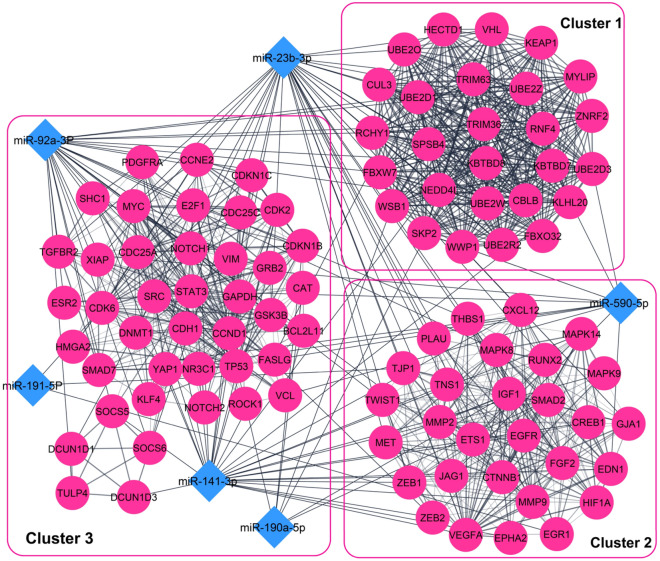
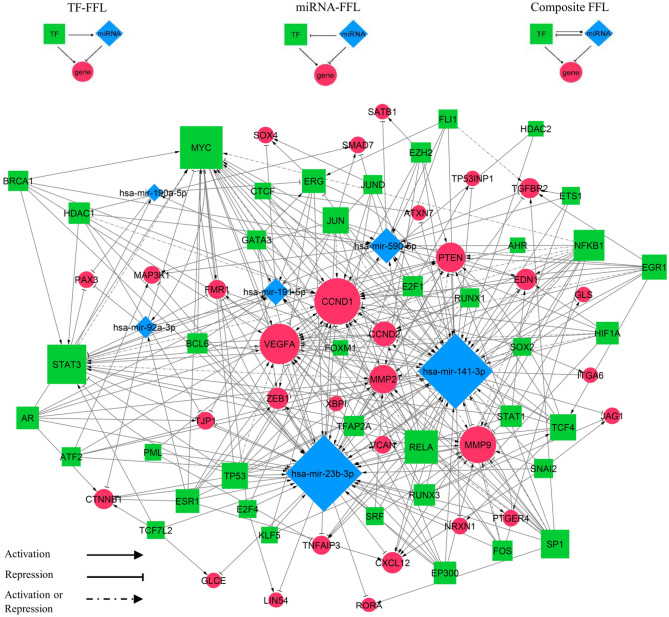
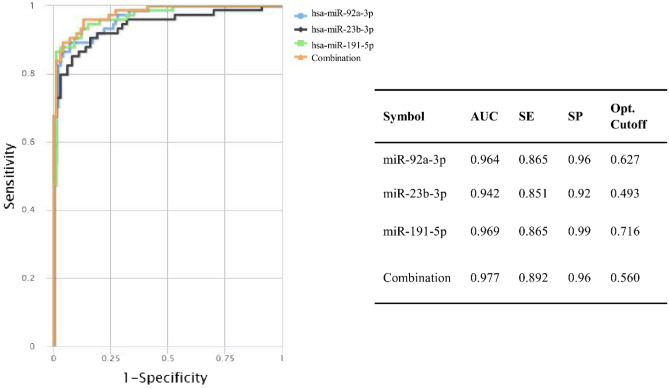
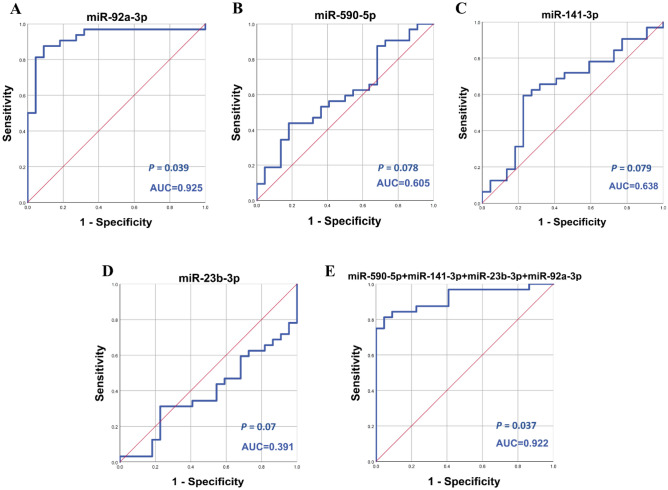
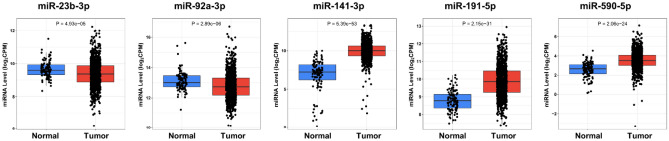
Early diagnosis of breast cancer (BC), as the most common cancer among women, increases the survival rate and effectiveness of treatment. MicroRNAs (miRNAs) control various cell behaviors, and their dysregulation is widely involved in pathophysiological processes such as BC development and progress. In this study, we aimed to identify potential miRNA biomarkers for early diagnosis of BC. We also proposed a consensus-based strategy to analyze the miRNA expression data to gain a deeper insight into the regulatory roles of miRNAs in BC initiation. Two microarray datasets (GSE106817 and GSE113486) were analyzed to explore the differentially expressed miRNAs (DEMs) in serum of BC patients and healthy controls. Utilizing multiple bioinformatics tools, six serum-based miRNA biomarkers (miR-92a-3p, miR-23b-3p, miR-191-5p, miR-141-3p, miR-590-5p and miR-190a-5p) were identified for BC diagnosis. We applied our consensus and integration approach to construct a comprehensive BC-specific miRNA-TF co-regulatory network. Using different combination of these miRNA biomarkers, two novel diagnostic models, consisting of miR-92a-3p, miR-23b-3p, miR-191-5p (model 1) and miR-92a-3p, miR-23b-3p, miR-141-3p, and miR-590-5p (model 2), were obtained from bioinformatics analysis. Validation analysis was carried out for the considered models on two microarray datasets (GSE73002 and GSE41922). The model based on similar network topology features, comprising miR-92a-3p, miR-23b-3p and miR-191-5p was the most promising model in the diagnosis of BC patients from healthy controls with 0.89 sensitivity, 0.96 specificity and area under the curve (AUC) of 0.98. These findings elucidate the regulatory mechanisms underlying BC and represent novel biomarkers for early BC diagnosis.
© 2022. The Author(s).
Conflict of interest statement
The authors declare no competing interests.
Figures
Similar articles
-
Circulating microRNAs from the miR-106a-363 cluster on chromosome X as novel diagnostic biomarkers for breast cancer.Breast Cancer Res Treat. 2018 Jul;170(2):257-270. doi: 10.1007/s10549-018-4757-3. Epub 2018 Mar 20. Breast Cancer Res Treat. 2018. PMID: 29557526 Free PMC article.
-
Deregulation of miR-1245b-5p and miR-92a-3p and their potential target gene, GATA3, in epithelial-mesenchymal transition pathway in breast cancer.Cancer Rep (Hoboken). 2024 Feb;7(2):e1955. doi: 10.1002/cnr2.1955. Epub 2024 Jan 3. Cancer Rep (Hoboken). 2024. PMID: 38173189 Free PMC article.
-
Identification and validation of miR-583 and mir-877-5p as biomarkers in patients with breast cancer: an integrated experimental and bioinformatics research.BMC Res Notes. 2023 May 8;16(1):72. doi: 10.1186/s13104-023-06343-w. BMC Res Notes. 2023. PMID: 37158948 Free PMC article.
-
MicroRNAs: New Biomarkers for Diagnosis, Prognosis, Therapy Prediction and Therapeutic Tools for Breast Cancer.Theranostics. 2015 Jul 13;5(10):1122-43. doi: 10.7150/thno.11543. eCollection 2015. Theranostics. 2015. PMID: 26199650 Free PMC article. Review.
-
Identification of differentially expressed circulating serum microRNA for the diagnosis and prognosis of Indian non-small cell lung cancer patients.Curr Probl Cancer. 2020 Aug;44(4):100540. doi: 10.1016/j.currproblcancer.2020.100540. Epub 2020 Jan 23. Curr Probl Cancer. 2020. PMID: 32007320 Review.
Cited by
-
The assessment of breast cancer biomarkers in diagnosis, prognosis and treatment monitoring: integrated analysis.J Cancer Res Clin Oncol. 2025 Aug 22;151(8):233. doi: 10.1007/s00432-025-06271-1. J Cancer Res Clin Oncol. 2025. PMID: 40844552 Free PMC article. Review.
-
MicroRNAs: Emerging as Highly Promising Biomarkers for Early Breast Cancer Screening.J Clin Lab Med. 2023;6(3):273. Epub 2023 Sep 6. J Clin Lab Med. 2023. PMID: 37937319 Free PMC article. No abstract available.
-
miR-23b-3p, miR-126-3p and GAS5 delivered by extracellular vesicles inhibit breast cancer xenografts in zebrafish.Cell Commun Signal. 2024 Nov 18;22(1):552. doi: 10.1186/s12964-024-01936-9. Cell Commun Signal. 2024. PMID: 39558342 Free PMC article.
-
Deciphering the roles of non-coding RNAs in liposarcoma development: Challenges and opportunities for translational therapeutic advances.Noncoding RNA Res. 2024 Nov 15;11:73-90. doi: 10.1016/j.ncrna.2024.11.005. eCollection 2025 Apr. Noncoding RNA Res. 2024. PMID: 39736850 Free PMC article. Review.
-
miR-125 in Breast Cancer Etiopathogenesis: An Emerging Role as a Biomarker in Differential Diagnosis, Regenerative Medicine, and the Challenges of Personalized Medicine.Noncoding RNA. 2024 Feb 21;10(2):16. doi: 10.3390/ncrna10020016. Noncoding RNA. 2024. PMID: 38525735 Free PMC article. Review.
References
-
- Sung H, et al. Global cancer statistics 2020: GLOBOCAN estimates of incidence and mortality worldwide for 36 cancers in 185 countries. CA Cancer J. Clin. 2021;71:209–249. - PubMed
-
- https://www.cancer.gov/publications/dictionaries/cancer-terms/def/early-.... Accessed 2 July 2021.
-
- Siegel RL, Miller KD, Fuchs HE, Jemal A. Cancer statistics, 2022. CA Cancer J. Clin. 2022;135:584–590. - PubMed
-
- Harbeck N, et al. Breast cancer. Nature Rev. Dis. Primers. 2019;5:1–31. - PubMed
MeSH terms
Substances
LinkOut - more resources
Full Text Sources
Medical
Miscellaneous
