. 2022 Nov 22;13(1):7152.
doi: 10.1038/s41467-022-34894-2.

High-precision estimation of emitter positions using Bayesian grouping of localizations

Affiliations

High-precision estimation of emitter positions using Bayesian grouping of localizations

Mohamadreza Fazel et al. Nat Commun. .

Abstract

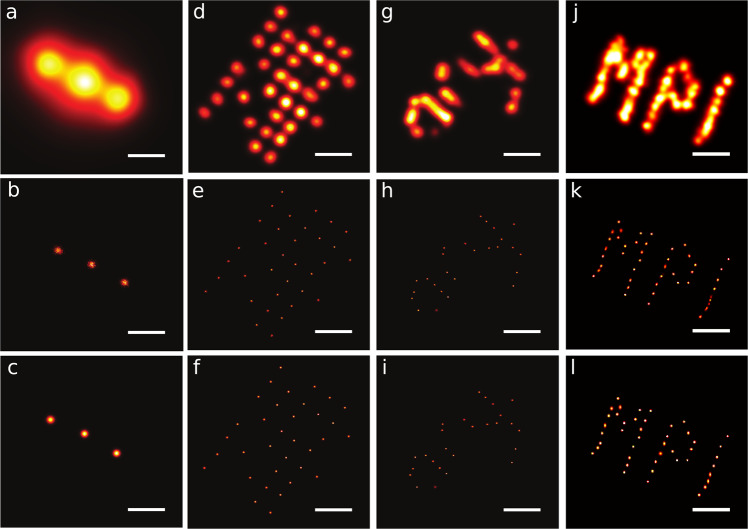
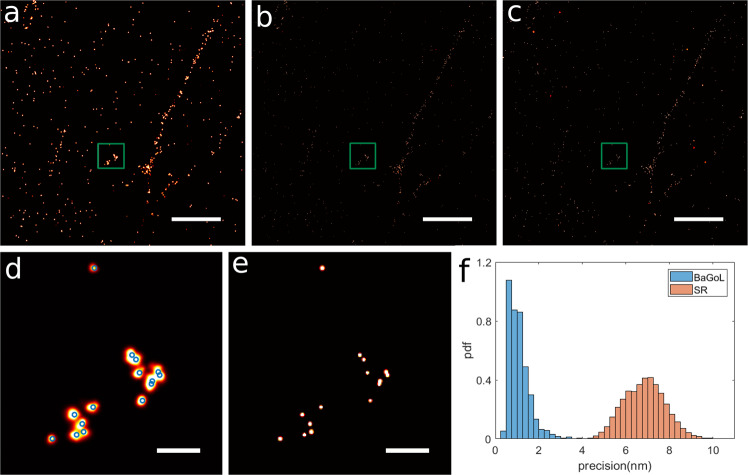
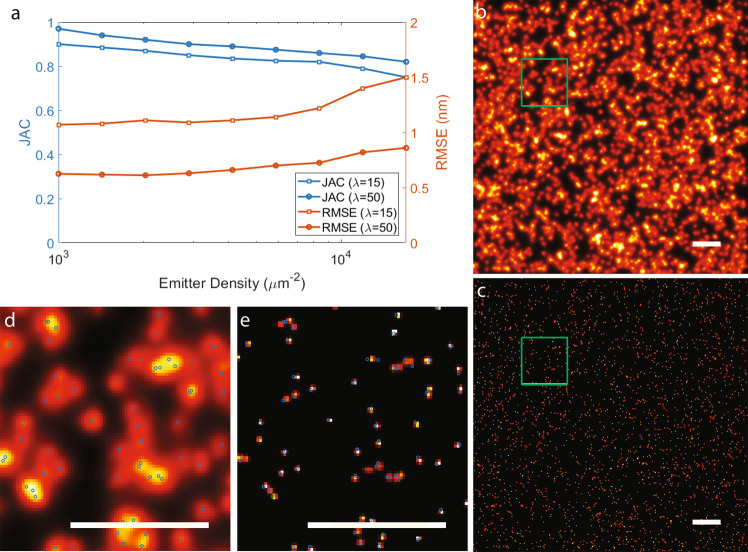
Single-molecule localization microscopy super-resolution methods rely on stochastic blinking/binding events, which often occur multiple times from each emitter over the course of data acquisition. Typically, the blinking/binding events from each emitter are treated as independent events, without an attempt to assign them to a particular emitter. Here, we describe a Bayesian method of inferring the positions of the tagged molecules by exploring the possible grouping and combination of localizations from multiple blinking/binding events. The results are position estimates of the tagged molecules that have improved localization precision and facilitate nanoscale structural insights. The Bayesian framework uses the localization precisions to learn the statistical distribution of the number of blinking/binding events per emitter and infer the number and position of emitters. We demonstrate the method on a range of synthetic data with various emitter densities, DNA origami constructs and biological structures using DNA-PAINT and dSTORM data. We show that under some experimental conditions it is possible to achieve sub-nanometer precision.


Conflict of interest statement

The authors declare no competing interests.

Figures

Fig. 1
Fig. 1. Bayesian grouping of localizations concept and data flow.
Circles are centered on given localizations with radii equal to two times the corresponding localization precisions. Colors represent localization allocations to emitters. Squares show emitters. a The data flow. The RJMCMC step is illustrated in further detail in panels bd. b From left to right, addition of a new emitter (blue) in a random location is proposed via a Birth jump. From right to left, an existing emitter is picked randomly and is eliminated from the model via a Death jump. c Localizations are redistributed across the emitters via an Allocation jump while emitter positions are fixed. d Given a fixed set of allocations, all emitter positions are updated in a Move jump.
Fig. 2
Fig. 2. Bayesian grouping of localizations applied to various structures imaged with DNA-PAINT.
Row 1: Traditional SR analysis with each localization represented by a Gaussian blob of the size of its localization precision. Row 2: Posterior probability image of the chain from BaGoL including all the proposed models. Row 3: The image from the model with the most likely number of emitters (MAPN). ac Gattaquant DNA rulers with 20 nm spacing between docking strands. The shown images were selected from the BaGoL results of 50 similar structures; df DNA-origami grid with 10 nm spacing between docking strands. The shown images were selected from the BaGoL results of 170 similar structures; gi TUD DNA origami with 5 nm spacing between docking strands. The shown images were selected from the BaGoL results of 170 similar structures (see Supplementary Movie 2); jl MPI DNA origami with 5 nm spacing between docking strands. The shown images were selected from the BaGoL results of four similar structures. The source data is provided within the paper. The scale bars are 20 nm.
Fig. 3
Fig. 3. BaGoL applied to the focal adhesion protein kindlin.
The protein kindlin-GFP was visualized using a DNA-labeled GFP nanobody and imaged via DNA-PAINT. a 5 × 5 μm2 region of traditional super-resolution image. b BaGoL posterior image of panel a. c BaGoL MAPN image of panel a. d Zoom-in of the green box in panel a. Blue circles represent the found emitter coordinates by BaGoL. e Zoom-in of the green box in panel c. f Histograms of the localization precisions from SR data shown in brown (input to BaGoL), and the improved precisions from BaGoL shown in blue. BaGoL was applied to the focal adhesion protein kindlin data for three similar regions. Scale bars in the top and bottom rows are 1000 and 100 nm, respectively.
Fig. 4
Fig. 4. Jaccard index (JAC) and root mean square error (RMSE).
JAC and RMSE were calculated for nine logarithmically spaced concentrations starting from 1000 emitters per μm2 to 17000 emitters per μm2 corresponding to average emitter separations ranging from 15.8 to 3.8 nm. a JAC and RMSE was calculated by averaging over outcomes of five simulated data sets for each concentration. b An example of simulated SR-data at a concentration of 10,000 emitters per μm2 (average emitter separation of 5 nm) with λ = 50 simulated over an area of 500 × 500 nm2. c MAPN results of panel b where each found emitter is presented by a Gaussian blob centered at the found location and a width similar to the corresponding localization precision. d Zoom-in of the green box in panel b. e Zoom-in of the green box in panel c. The BaGoL analysis in panel b-e was repeated for five similar data sets. Details of the data simulation and analysis are described in the “Methods” section. The blue circles represent the ground truth emitter locations. Scale bars are 50 nm.

References

    1. Lidke K, Rieger B, Jovin T, Heintzmann R. Superresolution by localization of quantum dots using blinking statistics. Opt. Express. 2005;13:7052–7062. doi: 10.1364/OPEX.13.007052. - DOI - PubMed
    1. Hell SW. Far-field optical nanoscopy. Science. 2007;316:1153–1158. doi: 10.1126/science.1137395. - DOI - PubMed
    1. Rust MJ, Bates M, Zhuang X. Sub-diffraction-limit imaging by stochastic optical reconstruction microscopy (STORM) Nat. Methods. 2006;3:793–795. doi: 10.1038/nmeth929. - DOI - PMC - PubMed
    1. Betzig E, et al. Imaging intracellular fluorescent proteins at nanometer resolution. Science. 2006;313:1642–1645. doi: 10.1126/science.1127344. - DOI - PubMed
    1. Hess ST, Girirajan TPK, Mason MD. Ultra-high resolution imaging by fluorescence photoactivation localization microscopy. Biophys. J. 2006;91:4258–4272. doi: 10.1529/biophysj.106.091116. - DOI - PMC - PubMed

Publication types