. 2022 Nov 23;13(1):7186.
doi: 10.1038/s41467-022-34965-4.

Inflammatory bone marrow signaling in pediatric acute myeloid leukemia distinguishes patients with poor outcomes

Affiliations

Inflammatory bone marrow signaling in pediatric acute myeloid leukemia distinguishes patients with poor outcomes

Hamid Bolouri et al. Nat Commun. .

Abstract

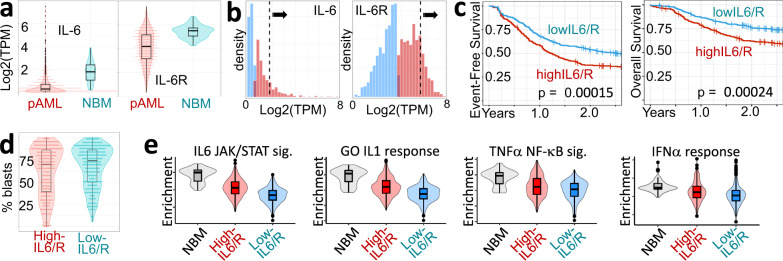
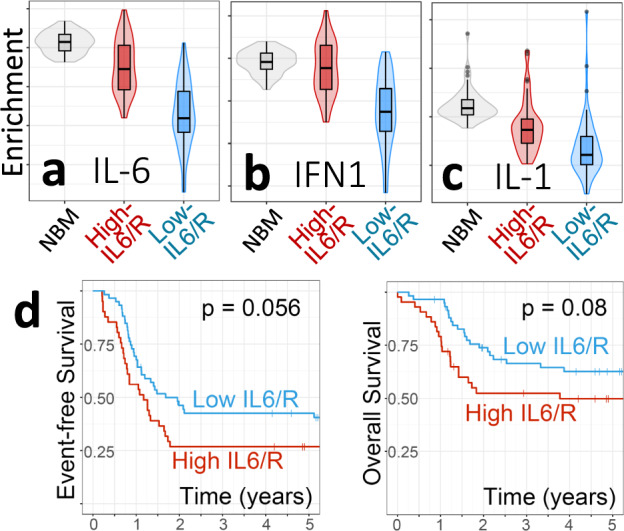
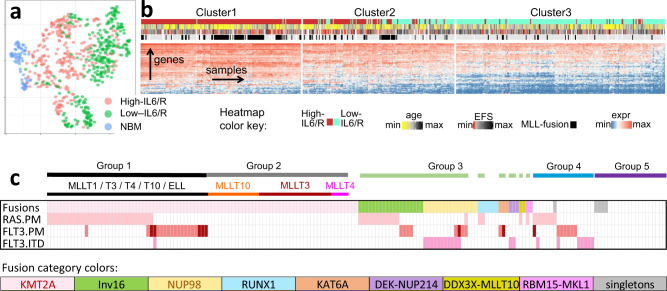
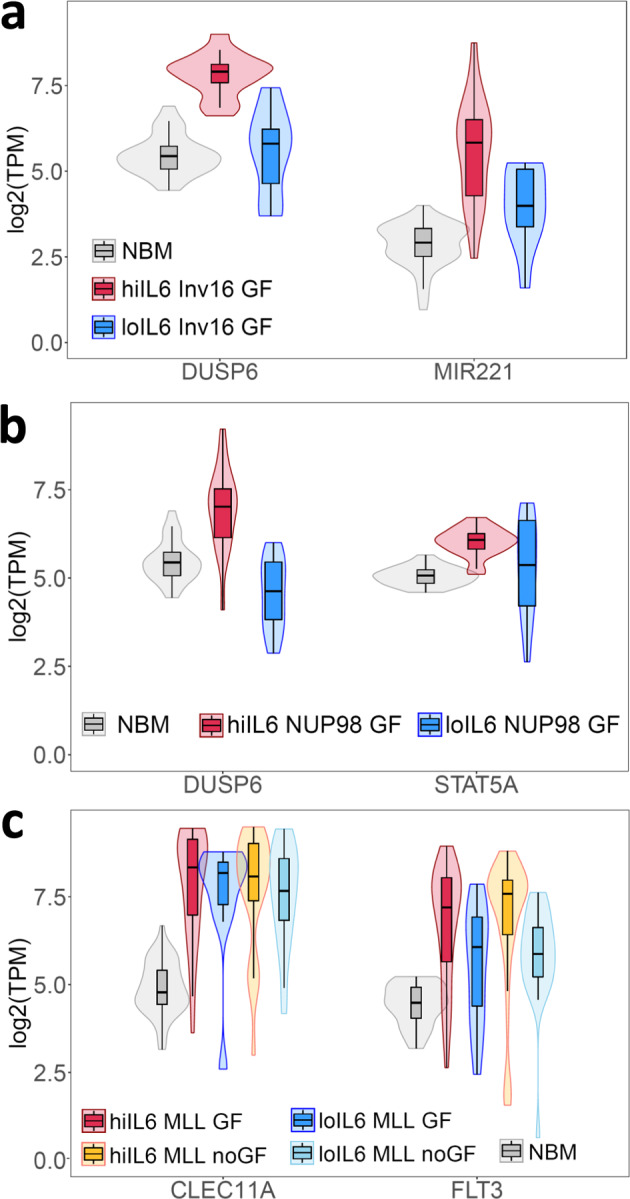
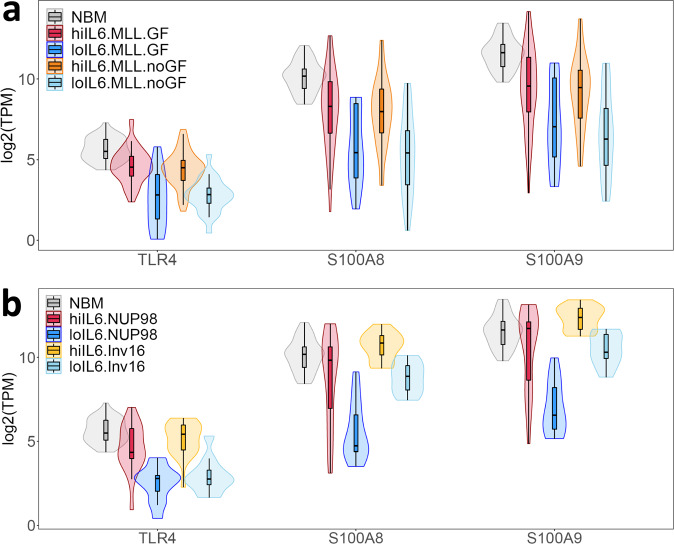
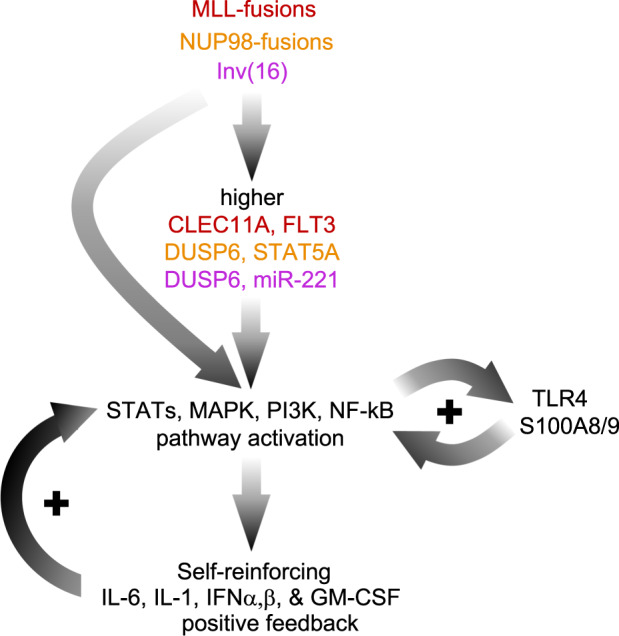
High levels of the inflammatory cytokine IL-6 in the bone marrow are associated with poor outcomes in pediatric acute myeloid leukemia (pAML), but its etiology remains unknown. Using RNA-seq data from pre-treatment bone marrows of 1489 children with pAML, we show that > 20% of patients have concurrent IL-6, IL-1, IFNα/β, and TNFα signaling activity and poorer outcomes. Targeted sequencing of pre-treatment bone marrow samples from affected patients (n = 181) revealed 5 highly recurrent patterns of somatic mutation. Using differential expression analyses of the most common genomic subtypes (~60% of total), we identify high expression of multiple potential drivers of inflammation-related treatment resistance. Regardless of genomic subtype, we show that JAK1/2 inhibition reduces receptor-mediated inflammatory signaling by leukemic cells in-vitro. The large number of high-risk pAML genomic subtypes presents an obstacle to the development of mutation-specific therapies. Our findings suggest that therapies targeting inflammatory signaling may be effective across multiple genomic subtypes of pAML.


Conflict of interest statement

The authors declare no competing interests.

Figures

Fig. 1
Fig. 1. Pediatric AML diagnostic samples with higher IL-6 or IL-6R expression have higher multi-cytokine signaling in the bone marrow (BM) and poorer 2-year outcomes than patients with low levels of bone-marrow IL-6 and IL-6R mRNA.
a pediatric AML BM IL-6 and IL-6R expression levels are rarely higher than in normal BM. b Gaussian mixture deconvolution of IL-6 and IL-6R expression into low and high groups (blue and red histograms, respectively). The top 25% of samples in the higher-expression groups (black arrows and dashed lines) were selected as having unusually high IL6/IL6R expression levels. c Kaplan–Meier Event-Free and Overall Survival plots for high- vs. low-IL6/R AML. 2-year log-rank p-values are indicated in each plot. d High- and low-IL6/R samples have similar fractions of blast cells. e Relative Single Sample Gene Set Enrichment Analysis (ssGSEA) scores for the IL-6 signaling gene set from MSigDB (gsea-msigdb.org), the Gene Ontology ‘IL-1 Response’ gene set (GO:0071347), and the TNFα signaling and IFNα response gene sets from MSigDB. Boxplots show the median and the upper and lower central-quartiles. The expected range of the data is indicated by whiskers. In all panels n = 287 for high-IL6/R group, n = 306 for the low-IL6/R group, and n = 45 for NBM.
Fig. 2
Fig. 2. Verification of findings in an independent cohort using the same gene sets and scoring as in the discovery cohort (Fig. 1, Supplementary Fig. 2B).
a IL-6 signaling, b Type 1 IFN signaling, c IL-1 signaling. Shown are gene set mean expression levels in high- vs. low-IL6/R samples. d Comparison of 5-year Event-Free and Overall Survival for high- vs. low-IL6/R patients. Log-rank p-values are shown. Boxplots show the median and the upper and lower central-quartiles. The expected range of the data is indicated by whiskers. In all panels n = 43 for high-IL6/R group, n = 59 for the low-IL6/R group., and n = 62 for NBM.
Fig. 3
Fig. 3. High-IL6/R pAML BM samples are highly distinct in terms of their immunological, transcriptional, and genomic characteristics.
a In a UMAP projection using 1,506 immune genes, 287 high-IL6/R pAML, 306 low-IL6/R pAML and 45 NBM samples form distinct clusters, indicating broad immune differences. b Unsupervised hierarchical clustering of the expression levels (log2(TPM + 1)) of 82 immune and cancer genes divides high- and low-IL6/R samples (n = 287 and 306 respectively) into 3 groups with sharply distinct rates of MLL gene fusions, response to therapy (5-year EFS), and age at diagnosis. The minimum log2 expression value is zero and the maximum is 11.08. The minimum age is 18 days and the maximum is 26.85 years. The minimum EFS is 1 day, and the maximum is 8.2 years. c Oncoprint summarizing the distribution of somatic DNA alterations in 181 high-IL6/R pAML diagnostic samples from Cluster1 in (b). Each column represents one pAML BM sample. Each row indicates the occurrence of a genomic alteration with a colored cell. Chromosomal translocations are indicated in the “Fusions” row. The fusion partners of MLL translocations are indicated above the “Fusions” row. The color key at the bottom shows the colors used to indicate the types of gene-gene fusion displayed in the “Fusions” row (Inv16 = chromosome 16 inversion). The other 3 rows in the Oncoprint indicate the presence of RAS and FLT3 point mutations (PM) and FLT3 Internal Tandem Duplications (ITD). FLT3 point mutations that have been experimentally found to activate FLT3 signaling are shown in lighter red. The horizontal bars at the top indicate the grouping of high-IL6/R pAML samples into 5 highly recurrent genomic subgroups. Group1: MLL-rearrangements with co-occurring RAS or FLT3 point mutations. Group 2: samples with MLL-rearrangements only. Group 3: samples with diverse gene fusions and co-occurring RAS or FLT3 point mutations. Group 4: samples with RAS/FLT3 point mutations but no recurrent translocations. Group 5: samples with no detected recurrent genomic alterations.
Fig. 4
Fig. 4. Phospho-CyTOF and RNA-seq suggest distinct cell-of-origin but common receptor-mediated signaling in high-IL6/R pAML genomic subtypes. All plots show data from 5 high-IL6/R pAML samples. Panel A additionally includes 5 NBM as indicated.
a UMAP projection of all CyTOF cell-type markers highlights clustering of cells from 2 samples with MLL (KMT2A) fusions away from the cells of 2 samples with chromosome 16 inversion (Inv(16)) and 1 sample (blue markers) with Normal Karyotype (NK). MLL fusion partners and RAS/FLT3 mutation status of the samples are indicated in the color key. The phenotype of each AML cluster is indicated above the cluster. b Comparison of the basal signaling states of NBM and the same 5 high-IL6/R samples as in panel (a) in the absence of resting in cytokine-rich media or stimulation with HS-5 supernatant. Compared to their counterparts in NBM, CD34+ high-IL6/R pAML samples have higher frequencies of cells with activated (phosphorylated) STAT1 and STAT3, suggesting intrinsic IL-6 and IFNα/β signaling activity. c Top row of each panel: Overnight rest in cytokine-rich media, and 25-min stimulation by HS-5 supernatant, increases the frequencies of all signaling-active cells (compared to cells maintained in cytokine-free and HS-5 supernatant-free media) in both NBM (i, ii) and high-IL6/R pAML (iii, iv), except for pSTAT1+ and pSTAT3+ CD34+ CMP/GMP high-IL6/R cells, which are already prevalent in the basal state (see B). Bottom row of each panel: Treatment with Ruxolitinib results in sharp down-regulation of the frequencies of cells with activated JAK/STAT signaling, but has mixed effects on NF-κB signaling. d Bulk RNA-seq Gene Set Enrichment Analysis (GSEA) plots of 5 MLL-rearranged (i.e., CD34-) high-IL6/R pAML showing downregulation of IFNα/β, TNFα and IL-6 signaling following Ruxo treatment. Consistent with these effects, the MYD88-independent signaling pathway is also downregulated by Ruxolitinib. All GSEA FDR ≤ 0.2.
Fig. 5
Fig. 5. Selected differentially upregulated genes in high-IL6/R pAML samples.
a Samples with RAS/FLT3 point mutations and co-occurring Inv(16). b Samples with NUP98 translocations and RAS/FTL3 point mutations. c Samples carrying ML-rearrangements with or without mutations in the growth factor signaling associated genes FLT3 and RAS (“indicated as “GF” and “noGF” respectively). For all 3 panels, all within-group pairwise two-sided comparison Mann–Whitney U Test P values are <0.05. The abbreviations “hiIL6” and “loIL6” indicate the high-IL6/R and low-IL6/R pAML subtypes. Numbers of samples per group: NBM = 45, low-IL6/R = 306, hiIL6 Inv16 GF = 17, loIL6 Inv16 GF = 11, hiIL6 NUP98 GF = 20, loIL6 NUP98 GF = 12, hiIL6 MLL GF = 53, loIL6 MLL GF = 13, hiIL6 MLL noGF = 46, loIL6 MLL noGF = 24. Boxplots show the median and the upper and lower central-quartiles. The expected range of the data is indicated by whiskers.
Fig. 6
Fig. 6. TLR4 and S100A8/9 are expressed at higher levels in high-IL6/R samples compared to low-IL6/R, but not NBM.
a TLR4 and S100A8/9 expression levels in MLL-rearranged AML with or without RAS/FLT3 mutations (indicated as “GF” and”no-GF” respectively), and b TLR4 and S100A8/9 expression levels in NUP98-rearranged and Inv(16) AML with RAS/FLT3 mutations. Numbers of samples per group: hiIL6 Inv16 GF = 17, loIL6 Inv16 GF = 11, hiIL6 NUP98 GF = 20, loIL6 NUP98 GF = 12, hiIL6 MLL GF = 53, loIL6 MLL GF = 13, hiIL6 MLL noGF = 46, loIL6 MLL noGF = 24. Boxplots show the median and the upper and lower central-quartiles. The expected range of the data is indicated by whiskers.
Fig. 7
Fig. 7. Schematic summary and model of the regulatory interactions reported.
All 3 main genomic subtypes of high-IL6/R pAML upregulate genes that have been reported to activate multiple signal transduction pathways that in turn can upregulate IL-6, IL-1, IFNα/β, GM-CSF, and S100A8/9 mediated TLR signaling. Notably, all these signaling pathways can become self-reinforcing via positive feedback loops (marked by the ‘+’ symbols).

References

    1. Schulpen M, et al. Increased survival disparities among children and adolescents & young adults with acute myeloid leukemia: a Dutch population-based study. Int J. Cancer. 2022;150:1101–1112. doi: 10.1002/ijc.33878. - DOI - PMC - PubMed
    1. Bolouri H, et al. The molecular landscape of pediatric acute myeloid leukemia reveals recurrent structural alterations and age-specific mutational interactions. Nat. Med. 2018;24:103–112. doi: 10.1038/nm.4439. - DOI - PMC - PubMed
    1. McCarthy JJ, McLeod HL, Ginsburg GS. Genomic medicine: a decade of successes, challenges, and opportunities. Sci. Transl. Med. 2013;5:189sr184. doi: 10.1126/scitranslmed.3005785. - DOI - PubMed
    1. Zhang H, Klareskog L, Matussek A, Pfister SM, Benson M. Translating genomic medicine to the clinic: challenges and opportunities. Genome Med. 2019;11:9. doi: 10.1186/s13073-019-0622-1. - DOI - PMC - PubMed
    1. Hanahan D, Weinberg RA. Hallmarks of cancer: the next generation. Cell. 2011;144:646–674. doi: 10.1016/j.cell.2011.02.013. - DOI - PubMed

Publication types