

Comparison between dynamic contour tonometry and Goldmann applanation tonometry correcting equations
- PMID: 36418360
- PMCID: PMC9684577
- DOI: 10.1038/s41598-022-24318-y
Comparison between dynamic contour tonometry and Goldmann applanation tonometry correcting equations
Abstract
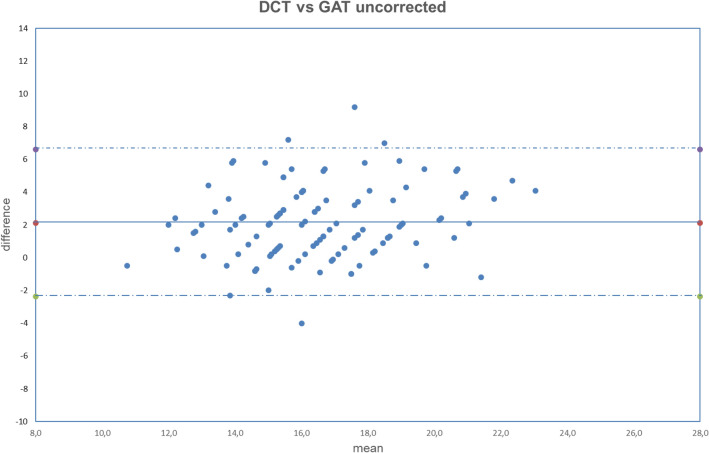
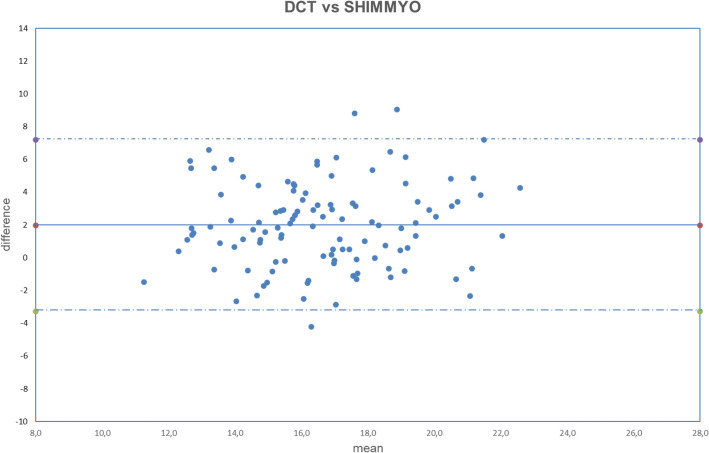
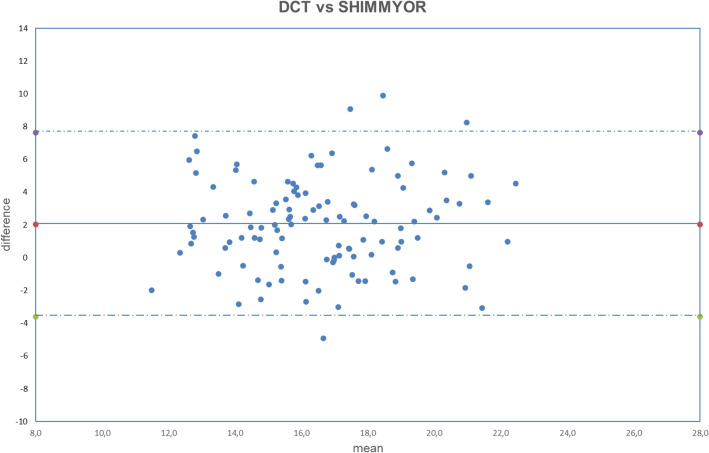
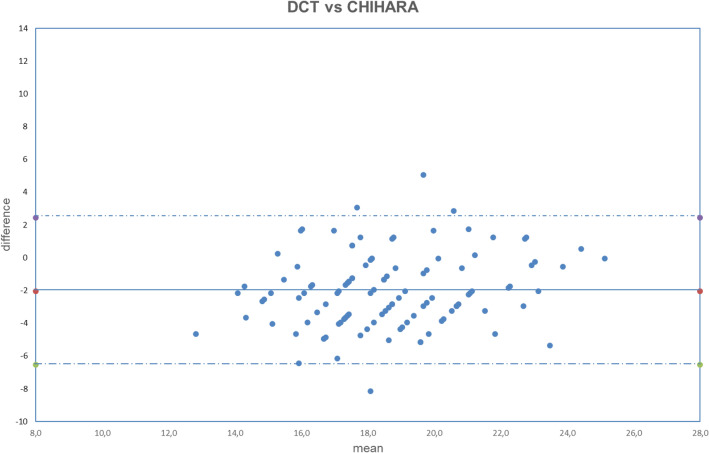
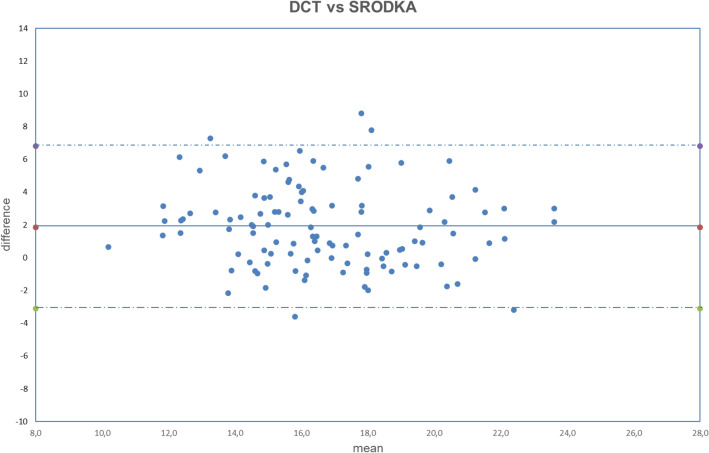
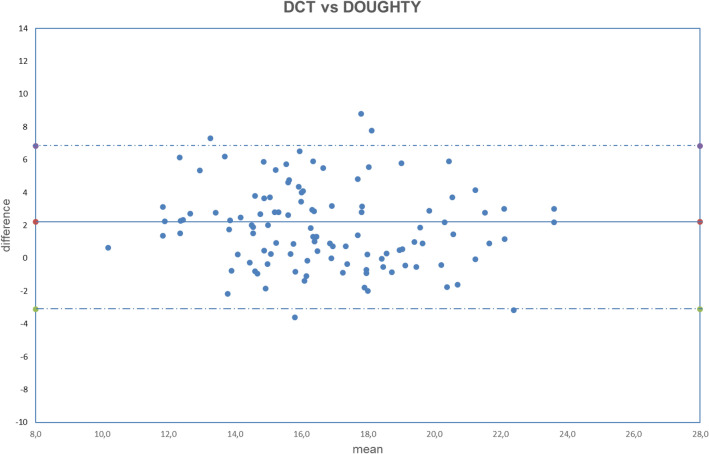
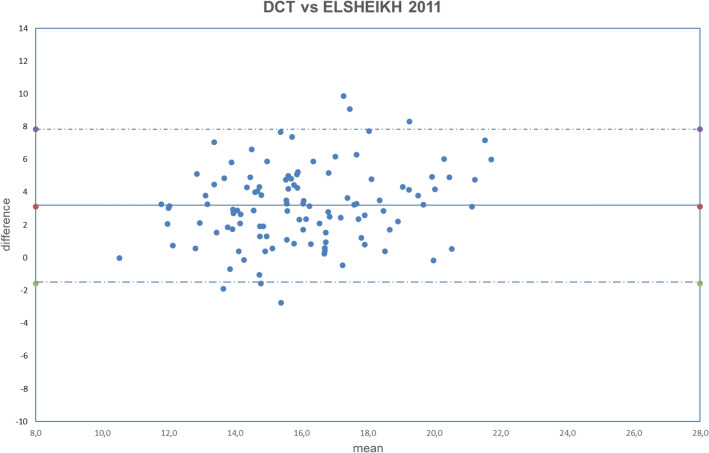
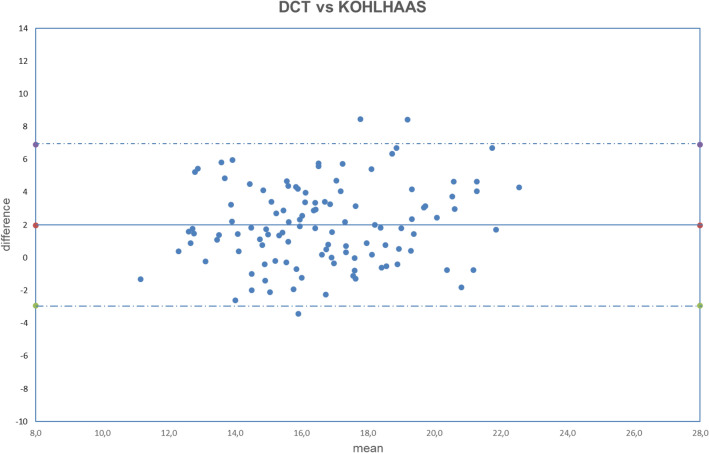
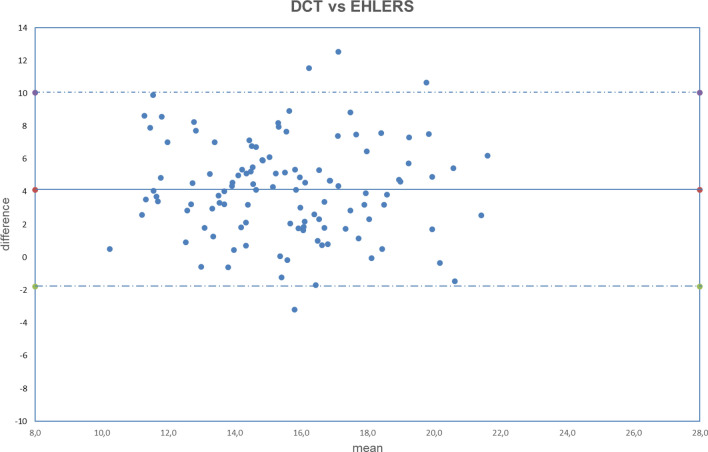
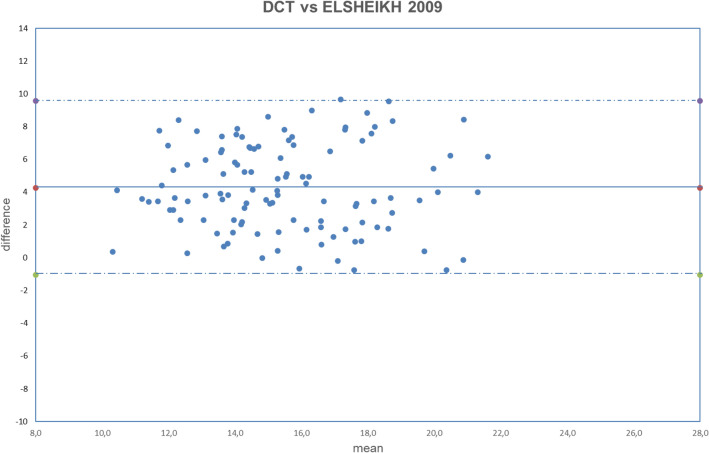
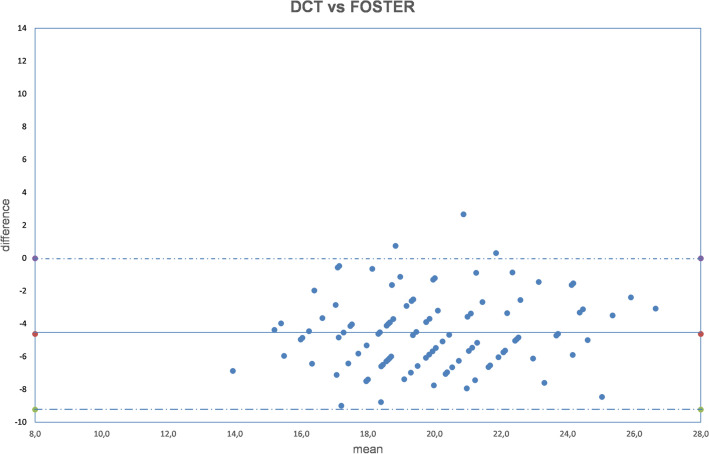
In order to investigate the reliability of correcting GAT formulas in comparison with dynamic contour tonometry (DCT), this study included 112 right eyes of 112 healthy subjects aged from 21 to 77 years, whose eyes underwent to a full ophthalmologic exam. IOP was measured in each eye with DCT and then with GAT. IOP values obtained with GAT were corrected with 10 equations and then compared with those provided by DCT. Participants mean age was 42.24 ± 14.08 years; mean IOP measured with DCT was 17.61 ± 2.87 and 15.50 ± 2.47 mmHg, measured with GAT. The mean discordance between DCT and GAT measurements was 2.11 ± 2.24 mmHg. All the correcting formulas, but Srodka one (p ˂ 0.001), tend to increase the difference between GAT and DCT. According to these results Śródka equation provides the best correction, reducing the difference between the two IOP measurement methods of - 0.03 ± 0.85 mmHg. Other equations do not provide a valid improvement of the agreement between the two methods or they provide a worsening of the agreement.
© 2022. The Author(s).
Conflict of interest statement
The authors declare no competing interests.
Figures
Similar articles
-
Correlation Between Dynamic Contour Tonometry, Uncorrected and Corrected Goldmann Applanation Tonometry, and Stage of Glaucoma.JAMA Ophthalmol. 2017 Jun 1;135(6):601-608. doi: 10.1001/jamaophthalmol.2017.1012. JAMA Ophthalmol. 2017. PMID: 28494071 Free PMC article.
-
[Evaluation of correction formulas for tonometry : The Goldmann applanation tonometry in approximation to dynamic contour tonometry].Ophthalmologe. 2017 Aug;114(8):716-721. doi: 10.1007/s00347-016-0409-3. Ophthalmologe. 2017. PMID: 27921133 German.
-
Comparisons between Pascal dynamic contour tonometry, the TonoPen, and Goldmann applanation tonometry in patients with glaucoma.Acta Ophthalmol Scand. 2007 May;85(3):272-9. doi: 10.1111/j.1600-0420.2006.00834.x. Acta Ophthalmol Scand. 2007. PMID: 17488456
-
Goldmann applanation tonometry and dynamic contour tonometry in eyes with elevated intraocular pressure (IOP): comparison in the same eyes after subsequent medical normalization of IOP.Graefes Arch Clin Exp Ophthalmol. 2010 Nov;248(11):1611-6. doi: 10.1007/s00417-010-1462-2. Epub 2010 Jul 22. Graefes Arch Clin Exp Ophthalmol. 2010. PMID: 20652303
-
Comparison of dynamic contour tonometry and goldmann applanation tonometry in African American subjects.Ophthalmology. 2007 Apr;114(4):658-65. doi: 10.1016/j.ophtha.2006.06.065. Epub 2006 Nov 30. Ophthalmology. 2007. PMID: 17141320
Cited by
-
A study exploring the causal relationship between glaucoma and anxiety disorders.Front Med (Lausanne). 2024 Aug 7;11:1410607. doi: 10.3389/fmed.2024.1410607. eCollection 2024. Front Med (Lausanne). 2024. PMID: 39170036 Free PMC article.
-
Herbal and Natural Treatments for the Management of the Glaucoma: An Update.Biomed Res Int. 2023 Nov 17;2023:3105251. doi: 10.1155/2023/3105251. eCollection 2023. Biomed Res Int. 2023. PMID: 38027044 Free PMC article. Review.
-
The Effect of Esophagogastroduodenoscopy on Intraocular Pressure.J Clin Med. 2024 Feb 21;13(5):1224. doi: 10.3390/jcm13051224. J Clin Med. 2024. PMID: 38592020 Free PMC article.
-
The influence of altitude on the differences between Goldmann tonometry and Pascal dynamic contour tonometry: An ecological meta-analysis.Indian J Ophthalmol. 2024 May 1;72(Suppl 3):S398-S403. doi: 10.4103/IJO.IJO_907_23. Epub 2023 Dec 15. Indian J Ophthalmol. 2024. PMID: 38099358 Free PMC article. Review.
-
Short-term variability in ocular biometry and the impact of preoperative dry eye.Sci Rep. 2024 Nov 5;14(1):26762. doi: 10.1038/s41598-024-77572-7. Sci Rep. 2024. PMID: 39501017 Free PMC article.
References
MeSH terms
LinkOut - more resources
Full Text Sources
