. 2022 Dec;612(7938):162-169.
doi: 10.1038/s41586-022-05449-8. Epub 2022 Nov 23.

Structural basis of tankyrase activation by polymerization

Affiliations

Structural basis of tankyrase activation by polymerization

Nisha Pillay et al. Nature. 2022 Dec.

Abstract

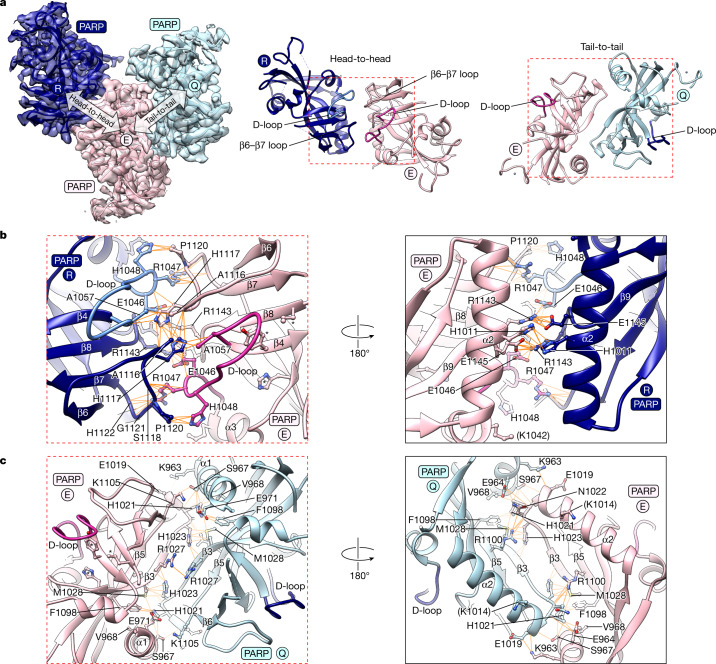
The poly-ADP-ribosyltransferase tankyrase (TNKS, TNKS2) controls a wide range of disease-relevant cellular processes, including WNT-β-catenin signalling, telomere length maintenance, Hippo signalling, DNA damage repair and glucose homeostasis1,2. This has incentivized the development of tankyrase inhibitors. Notwithstanding, our knowledge of the mechanisms that control tankyrase activity has remained limited. Both catalytic and non-catalytic functions of tankyrase depend on its filamentous polymerization3-5. Here we report the cryo-electron microscopy reconstruction of a filament formed by a minimal active unit of tankyrase, comprising the polymerizing sterile alpha motif (SAM) domain and its adjacent catalytic domain. The SAM domain forms a novel antiparallel double helix, positioning the protruding catalytic domains for recurring head-to-head and tail-to-tail interactions. The head interactions are highly conserved among tankyrases and induce an allosteric switch in the active site within the catalytic domain to promote catalysis. Although the tail interactions have a limited effect on catalysis, they are essential to tankyrase function in WNT-β-catenin signalling. This work reveals a novel SAM domain polymerization mode, illustrates how supramolecular assembly controls catalytic and non-catalytic functions, provides important structural insights into the regulation of a non-DNA-dependent poly-ADP-ribosyltransferase and will guide future efforts to modulate tankyrase and decipher its contribution to disease mechanisms.


Conflict of interest statement

The authors declare no competing interests.

Figures

Fig. 1
Fig. 1. Architecture of the TNKS2 SAM–PARP filament.
a, Domain organization of TNKS and TNKS2. b, Cryo-EM maps (before final sharpening in Phenix for model building) of TNKS2 SAM–PARP (left) and after masking out PARP (right). The antiparallel protofilaments are related to each other by D1 symmetry. A, acceptor site; D, donor site. Yellow arrows indicate protofilament polarity. c, Schematic representation of the quaternary filament structure, with letters indicating different protomers (see Extended Data Fig. 3j). d, Additionally sharpened cryo-EM map and model of a single TNKS2 SAM–PARP protomer. The PARP domain from PDB 5NWG is superimposed in green to illustrate poorly resolved features of the acceptor site. See Extended Data Fig. 2 for data processing details, and Extended Data Fig. 3 for map details and analysis of the G1032WTNKS2 mutation.
Fig. 2
Fig. 2. SAM domain contacts within the TNKS2 SAM–PARP filament.
a, Cryo-EM map and model showing three adjacent SAM–PARP protomers each from antiparallel protofilaments (D, E, F and N, O, P). Arrows indicate domain interactions, and letters refer to different SAM–PARP protomers (see Fig. 1c). b, Model of the TNKS2 PARP domain with buried surfaces identified by PISA highlighted in the respective colour code of the interacting domain (see Fig. 1c). Residues buried by two adjacent surfaces are shown in orange. c, Cartoon representation of SAM–SAM head-to-tail contacts (323 Å2), with key interacting residues shown in stick representation and bonds indicated by orange lines. EH, end helix; ML, mid-loop. d, As for c but for SAM–SAM interprotofilament contacts (161 Å2). e, As for c but for SAM/linker–PARP contacts (699 Å2).
Fig. 3
Fig. 3. PARP–PARP domain contacts within the TNKS2 SAM–PARP filament.
a, Cryo-EM map and model showing three adjacent PARP domains (left). Arrows indicate PARP–PARP head and tail interfaces. Overviews of the PARP–PARP interfaces in cartoon representation are also shown (right). b, Detailed cartoon representation of PARP–PARP head contacts (721 Å2), with key interacting residues shown as sticks and bonds indicated by orange lines. c, As for b but for PARP–PARP tail contacts (776 Å2). Residues of the catalytic H-Y-E triad are marked with asterisks, and letters indicate different protomers.
Fig. 4
Fig. 4. Conformational changes induced by PARP–PARP head interactions.
a, PARP domain from the filament (pink, with D-loop in magenta) superimposed onto the crystal structure of TNKS2 PARP not in a head-like crystal contact (green, 5NWG). Cartoon representation with the NAD+-binding site indicated (left), and a magnified view with selected head interface residues as sticks (right) are shown. The red arrows indicate conformational changes. The NAD+ analogue BAD was placed by superimposing the PARP1–BAD complex (6BHV). b, Intramolecular D-loop–β6–β7 loop contacts. c, Schematic representation of intermolecular and intramolecular loop interactions at the PARP–PARP head interface. The double-headed arrows indicate interactions.
Fig. 5
Fig. 5. PARP–PARP domain interactions control tankyrase function.
a, β-catenin-responsive luciferase reporter assay to analyse the roles of PARP–PARP head and D-loop interactions (n = 5 independent experiments (n = 4 for E1046AD-loop); individual data points and means; error bars indicate s.e.m.). The red lines denote side-chain interactions between mutated residues. The black star denotes the combination of mutations labelled by a grey star. K1042Aα3 is a control mutation outside the head interface. See Extended Data Fig. 7 for reporter assays probing other interfaces and for expression levels. WT, wild type. b,c, Endogenous PARylation of PARP–PARP head interface (b) and loop contact mutants (c) analysed by western blotting of immunoprecipitated TNKS2 variants (n = 4 (b; n = 3 for RE1143/1145ERβ8–β9loop and head combination) or n = 3 (c) independent experiments; individual data points and means; error bars indicate s.e.m.). See Extended Data Fig. 8 for in vitro PARylation and PARP activity assays probing other interfaces. ADPr, ADP-ribose. d, Fluorescence polarization (FP) to analyse binding of His6-MBP–TNKS2 SAM–PARP variants to BAD (n = 3 independent experiments; error bars indicate s.e.m.; Kd with s.e. is also indicated). See Extended Data Fig. 9g for protein SDS–PAGE. e, Mass photometry to analyse oligomerization of His6-MBP–TNKS2 SAM–PARP variants. The percentages of monomeric or larger than monomeric particles are shown (n = 5 independent experiments; individual data points and means; error bars indicate s.e.m.). See Extended Data Fig. 9a,b for probability density graphs and additional mutant variants. f, Representative fluorescence micrographs of mCitrine–TNKS2-expressing HeLa cells (left), and quantification of micrographs (right) (n = 3 independent experiments; individual data points and means; error bars indicate s.e.m.; statistical significance as per one-way ANOVA with Tukey’s multiple comparisons test; ****P < 0.0001; ***P ≤ 0.001; **P ≤ 0.01; *≤ 0.05; no label, > 0.05). See Extended Data Fig. 9c,d for data from the +tankyrase inhibitor condition. g, Model for the activation of catalytic and non-catalytic tankyrase functions by polymerization. The dashed arrow indicates de-polymerization. Double-headed red arrows indicate interactions.
Extended Data Fig. 1
Extended Data Fig. 1. TNKS2 SAM-PARP polymerisation promotes auto-PARylation.
Recombinant TNKS2 PARP and SAM-PARP were analysed for auto-PARylation by Western blotting, either before or after in vitro PARylation by incubation with NAD+. Y920ASAM, polymerisation-deficient mutant variant; G1032WPARP, catalytically inactive mutant variant. Top, anti-pan-ADP-ribose Western blot; bottom, Revert-stained membrane for protein load. One representative out of three independent experiments with similar results is shown.
Extended Data Fig. 2
Extended Data Fig. 2. SAM-PARP cryo-EM data processing.
a, Representative cryo-EM micrograph (of 8,400) showing SAM-PARP filaments; scale bar, 100 nm. b, Representative 2D class averages and average power spectrum from several class averages. M, meridian; E, equator. The first layer line from the equator (corresponding to the helical pitch P) and the first meridional layer line (corresponding to the helical rise h) are indicated. Particles from well-refined 2D classes were selected for subsequent processing. c, Workflow of 3D helical reconstruction. Refinements were iteratively improved by applying D1 symmetry, addition of particles and polishing steps. The numbers of segments contributing to each map are indicated. d, Gold-standard Fourier shell correlation (FSC) curves for the final half-maps. The estimated global resolution at 0.143 FSC is indicated. The FSC curves of the masked, unmasked and corrected maps are coloured in blue, red and black, respectively. The FSC curve for the model vs. map is shown in green. The estimated global model resolution at 0.5 FSC is indicated. e, Local resolution calculated by RELION. The surface colour of the map (for the filament and an individual, centrally located SAM-PARP protomer corresponding to chain E of the model) is rendered by local resolution, as shown in the colour scale. The acceptor site (A) is indicated. To facilitate model building, the map shown was further locally sharpened using Phenix Autosharpen. See Methods for data processing details.
Extended Data Fig. 3
Extended Data Fig. 3. Cryo-EM target and map features.
a, Cryo-EM map contoured at 8.73 and corresponding model of TNKS2 SAM-PARP chain E in cartoon representation with the G1032WPARP mutant residue in stick representation. b, Superimposition of PARP domain from TNKS2 SAM-PARP G1032WPARP (pink) with PARP domains from crystal structures: apo-TNKS2 PARP (3KR7, orange), TNKS2 PARP in complex with a small-molecule inhibitor binding the adenosine subsite (IWR-1, 3UA9, blue), TNKS2 PARP in complex with a small-molecule inhibitor binding the nicotinamide subsite (5NWG, green). The tryptophane introduced by the inactivating G1032WPARP mutation displaces the β3-α3 loop and helix α4 plus the subsequent G-loop relative to each other, which likely accounts for catalytic inactivation,. It is unlikely that the disorder within the distant acceptor site is due to the mutation. However, it is possible that the mutation contributes to the apparent disorder in the G-loop and Zn2+-binding site. The region of the PARP domain affected by the G1032WPARP mutation is situated on the filament periphery, distal to observed inter-domain contacts. The inset shows conformational differences of the D-loop base and H1048, which stacks with the adenine-mimetic amide region of the A-site binder IWR-1. This stacking interaction also likely occurs with NAD+. c, General overview of the TNKS2 SAM-PARP G1032WPARP cryo-EM map (after Phenix Autosharpen) used for model building. The map is contoured at 8.73. The model is shown in cartoon representation with side chains in stick representation. d-i, Cryo-EM maps corresponding to structural representations shown in the main figures. Maps are contoured at 8.73, with the exception of e, which is contoured at 6.3 to better display the density for the two R896 conformers with lower individual occupancies. j, IDs of SAM-PARP protomers for the 20-protomer filament built into the cryo-EM map.
Extended Data Fig. 4
Extended Data Fig. 4. Negative-stain EM of TNKS2 SAM shows a two-start helix.
a, Crop of a representative negative-stain electron micrograph (of 67) showing TNKS2 SAM filaments. b, 3D map of TNKS2 SAM alone (left) and rigid-body fitted with the SAM domain from the SAM-PARP model (right). c, Comparison between a 2D class average, a projection of the SAM domain filament 3D map from b, a projection of the SAM domain from the SAM-PARP model, and a projection of the single-stranded TNKS2 SAM DH902/924RE filament crystal structure (PDB ID 5JRT); scale bars, 50 Å. The features of both the 2D class average and the projection of the 3D map obtained for TNKS2 SAM show clear similarity to those of the two-start SAM domain helix from the SAM-PARP model, as opposed to the single-start helix from the crystal structure. This demonstrates that the TNKS2 SAM domain autonomously forms two-start helices.
Extended Data Fig. 5
Extended Data Fig. 5. PARP:PARP contacts from crystal structures resembling head-to-head and tail-to-tail interactions.
a, Superimposition of TNKS/TNKS2 PARP domain pairs in head- and tail-like interactions in crystal structures, as identified by PISA. Domains are shown in transparent grey cartoon representation. PARP domains in head and tail interactions from the TNKS2 SAM-PARP filament are shown in orange red. b, Conservation of tankyrase PARP:PARP head and tail interfaces. The surface of a TNKS2 SAM-PARP protomer was coloured by percentage identity as indicated by the colour scale, using the alignment shown in Extended Data Fig. 6, omitting the non-tankyrase ARTD family members. SAM-PARP protomers interacting with the PARP domain of the reference protomer via the head or tail surfaces are shown in grey cartoon representation. The PARP:PARP head surface is as highly conserved as the enzyme active site. c, Superimposition of unique TNKS and TNKS2 PARP domains from the crystal structures that either engage (in tones of yellow) or do not engage (in tones of blue) in head- or tail-like contacts. A PARP domain from the TNKS2 SAM-PARP filament is shown in orange red. Domains are shown in worm representation. The D-loop base can adopt either an open (golden-yellow or dark blue) or closed (pale yellow or light blue) conformation. Of the domains not in a head-like contact and with an open D-loop base, most (13 out of 18) feature a small-molecule ligand in the A-site. The remaining 5 domains (with N-site binders) show electron densities in the A-site not attributable to the small-molecule inhibitor. Note that head- and tail-like PARP:PARP interactions do not co-occur in any crystal structure. d, Superimposition of TNKS2 PARP domains from the indicated crystal structures. Amino acid backbones and the H1048TNKS2 side chains are shown. One of the two chains in 3MHJ (no head-like contact, N-site binder) shows a D-loop base in two alternate conformations, open and closed, suggesting that in the absence of an A-site binder, the D-loop can sample open and closed conformations. See Supplementary Table 1 for PDB codes and analysis.
Extended Data Fig. 6
Extended Data Fig. 6. Multiple sequence alignment of catalytic domains from tankyrase homologues and ARTD family members.
The indicated tankyrase orthologues and paralogues as well as Diphteria-toxin like ADP-ribosyltransferase (ARTD) family members were aligned and sequences coloured by percentage identity. Numbering above the alignment corresponds to human TNKS2. Sequences not aligning with the reference sequence (human TNKS2) were deleted for clarity. Buried residues in the PARP:PARP head-to-head, tail-to-tail and SAM:PARP interfaces, as defined by the PISA server, are shaded in orange, green and red, respectively. See Methods for accession numbers.
Extended Data Fig. 7
Extended Data Fig. 7. Luciferase reporter assays to analyse contributions of domain interfaces to tankyrase function.
a-d, β-catenin-responsive TOPFlash luciferase reporter assay to analyse the contributions of PARP:PARP tail and head, inter-protofilament, and SAM/linker:PARP interactions (a, n = 6 (3 for K1014A); b, n = 4; c, n = 3; d, n = 3 independent experiments; individual data points and means; error bars, SEM). Red lines denote side chain interactions amongst mutated residues. The black star denotes the combination of those mutations labelled by a grey star for each set. K1014Aα2 is a control mutation outside the tail interface. N1022APARPα2-β3loop was designed to disrupt a potential contact with the SAM domain of the protomer interacting in the PARP:PARP head mode, but also contributes to the PARP:PARP tail interface. The ≈45% reporter reduction conferred by the R932ASAMα5 mutation is likely due to its moderate impact on polymerisation. Given that the combined SAM domain mutations disrupting the SAM/linker:PARP interface did not affect reporter activation, the K1003APARPα2 mutation likely acts through a mechanism that is independent of the SAM/linker:PARP interaction. e, Analysis of the contributions of selected head-like PARP:PARP domain contacts observed in crystal structures. Top, β-catenin-responsive TOPFlash luciferase reporter assay (n = 5 independent experiments (4 for E1015R); individual data points and means; error bars, SEM). The data for the vector, WT, G1032WPARP and VY903/920WASAM controls are the same as those shown in Fig. 5a as mutants were analysed in the same set. Bottom, superimposition of head-to-head pair from the cryo-EM structure (cartoon in colour) and the head-to-head-like pair from crystal structure 4PNL (cartoon in grey, chains shown on the left superimposed). Selected amino acids are shown in stick representation with contacts drawn as orange lines. f, as e, but for tail-tail and tail-to-tail-like interface. Luciferase reporter controls are the same as shown in a as mutants were analysed in the same set (n = 6 independent experiments; individual data points and means; error bars, SEM). The reference crystal structure is 5NWG. Note that F1110β6-β7loop sits in the β6-β7 loop. g–k, Samples from a third and fourth technical replicate in the luciferase reporter assays were probed by Western blotting for MYC-TNKS2 and α-tubulin or β-actin to assess the expression levels of the TNKS2 mutant variants. Ponceau S staining of the membrane serves as additional loading control. Data from one representative experiment (of at least three with similar results) are shown.
Extended Data Fig. 8
Extended Data Fig. 8. Analysis of contributions of domain interfaces to tankyrase catalytic activity.
a-h, Assessment of PARylation status by Western blotting of immunoprecipitated TNKS2 interface mutant variants, either directly after immunoprecipitation (endogenous) or upon in vitro PARylation by incubation with NAD+. The PARylation signals from 3 [b-h] or 4 [a, except for RE1143/1145ERβ8-β9loop and head comb., where n = 3) independent experiments were quantified (individual data points and means; error bars, SEM). i, Assessment of PARylation status by Western blotting of purified His6-MBP-TNKS2 SAM-PARP proteins produced in E. coli, either directly after purification (endogenous, top) or upon in vitro PARylation by incubation with NAD+ (bottom). ADP-ribose was detected using an anti-pan-ADP-ribose reagent; protein loading was assessed by Ponceau S staining of the membrane. One representative out of three independent experiments with similar results is shown.
Extended Data Fig. 9
Extended Data Fig. 9. Analysis of TNKS2 oligomerisation, localisation and structural integrity.
a, Mass photometry analysis of the indicated His6-MBP-TNKS2 SAM-PARP variants. Representative probability density graphs from one out of five experiments are shown for each variant, with theoretical molecular weights of species containing one to six subunits indicated by dotted lines. Dashed vertical red lines indicate boundaries between monomeric and >monomeric species used for quantification. The three species marked with asterisks have poorer separation between peaks due to a higher tendency of molecules to repeatedly bind and unbind to and from the glass surface (see Methods for details). b, Analysis of mass photometry data for additional PARP domain mutant variants as in Fig. 5e (n = 5 independent experiments; individual data points and means; error bars, SEM). Data for controls (WT, G1032WPARP, G1032WPARP Y920ASAM) are identical to Fig. 5e and shown again for reference purposes. As for a, the three species marked with asterisks should be interpreted with caution. c, Fluorescence microscopy as in Fig. 5f, but after application of a tankyrase catalytic inhibitor. d, Quantification of c (n = 3 independent experiments; individual data points and means; error bars, SEM). e, Differential scanning fluorimetry of the indicated variants of His6-MBP-TNKS2 SAM-PARP. Data are means from three parallel technical replicates. f, g, Coomassie-stained SDS-PAGE gels of purified His6-MBP-TNKS2 SAM-PARP fusion proteins for quality control. Sufficiently high protein yield did not require repeated purifications for most of the variants (n = 1).
Extended Data Fig. 10
Extended Data Fig. 10. Regulatory assembly and surfaces on TNKS2 SAM-PARP.
a, Cryo-EM map of five consecutive pairs of TNKS2 SAM-PARP protomers, numbered n (for sense strand) and n’ (for antisense strand). Three PARP domains are shown in colour to illustrate the PARP:PARP contacts. Four or five pairs of protomers, respectively, need to assemble for a PARP:PARP tail (1:4’) or head (1:5’) contact to be established. b, The regulatory surfaces corresponding to those engaged by the helical domain (HD) in PARP1-3/ARTD1-3 and HPF1 in PARP1&2/ARTD1&2 remain available in the TNKS2 SAM-PARP filament. The PARP domain from TNKS2 SAM-PARP is shown in surface representation, coloured as in Fig. 2b. The HD of human PARP2, shown in orange cartoon representation, and human HPF1, shown in green cartoon representation, were oriented by superimposing the PARP2 catalytic domains from the PARP2 HD-PARP-ABT888 complex structure (3KJD chain A) and the PARP2 PARP-HPF1 complex structure (6TX3). c, ARC5 could likely be accommodated in the available minor groove of TNKS2 SAM-PARP. The TNKS2 SAM-PARP filament model is shown in surface representation and coloured as in Fig. 1. TNKS ARC (from 5GP7) is shown in yellow surface representation. d, PARP:PARP head-like interactions in crystal structures of other ADP-ribosyltransferases, identified by PISA. Top, A. thaliana RCD1 (5NGO). Bottom, human PARP14/ARTD8 (7LUN). Domains are shown in worm representation with chain identifiers. The TNKS2 PARP:PARP head contact is shown in orange red.

References

    1. Haikarainen T, Krauss S, Lehtiö L. Tankyrases: structure, function and therapeutic implications in cancer. Curr. Pharm. Des. 2014;20:6472–6488. doi: 10.2174/1381612820666140630101525. - DOI - PMC - PubMed
    1. Li X, et al. Proteomic analysis of the human tankyrase protein interaction network reveals its role in pexophagy. Cell Rep. 2017;20:737–749. doi: 10.1016/j.celrep.2017.06.077. - DOI - PubMed
    1. Rycker MD, Price CM. Tankyrase polymerization is controlled by its sterile alpha motif and poly(ADP-ribose) polymerase domains. Mol. Cell. Biol. 2004;24:9802–9812. doi: 10.1128/MCB.24.22.9802-9812.2004. - DOI - PMC - PubMed
    1. Mariotti L, et al. Tankyrase requires SAM domain-dependent polymerization to support Wnt–β-catenin signaling. Mol. Cell. 2016;63:498–513. doi: 10.1016/j.molcel.2016.06.019. - DOI - PMC - PubMed
    1. Riccio AA, McCauley M, Langelier M-F, Pascal JM. Tankyrase sterile α motif domain polymerization is required for its role in Wnt signaling. Structure. 2016;24:1573–1581. doi: 10.1016/j.str.2016.06.022. - DOI - PMC - PubMed

Publication types