. 2022 Nov 23;12(1):20185.
doi: 10.1038/s41598-022-24502-0.

Electron-beam patterned calibration structures for structured illumination microscopy

Affiliations

Electron-beam patterned calibration structures for structured illumination microscopy

Sangeetha Hari et al. Sci Rep. .

Abstract

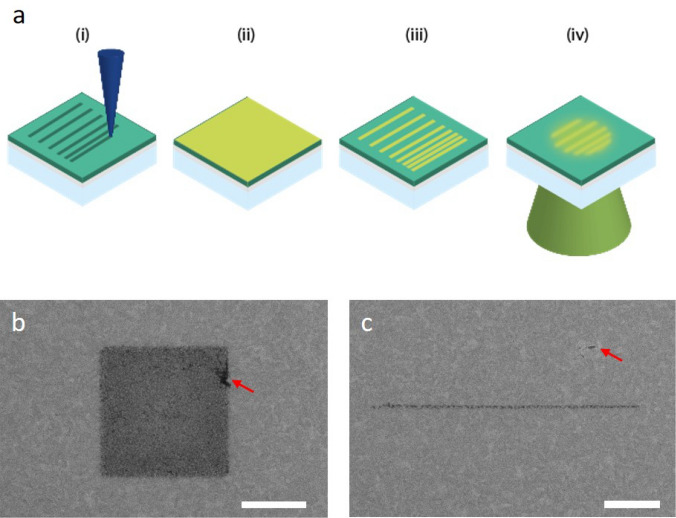
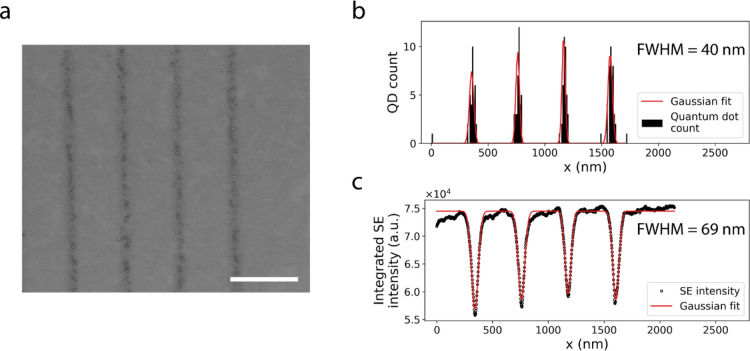
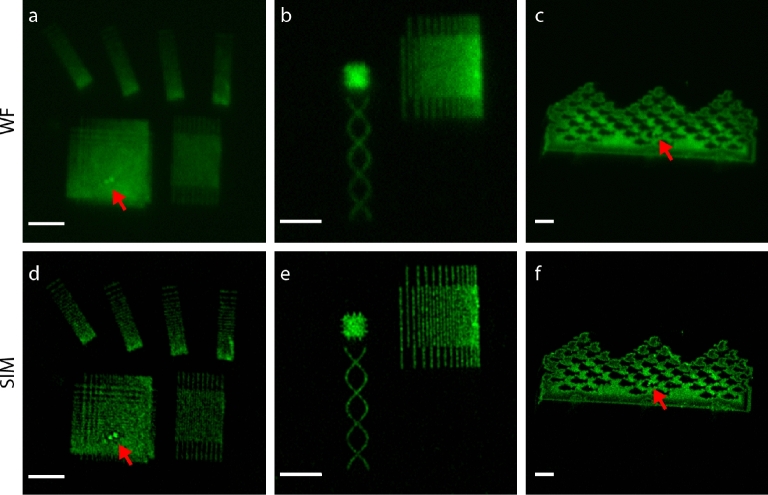
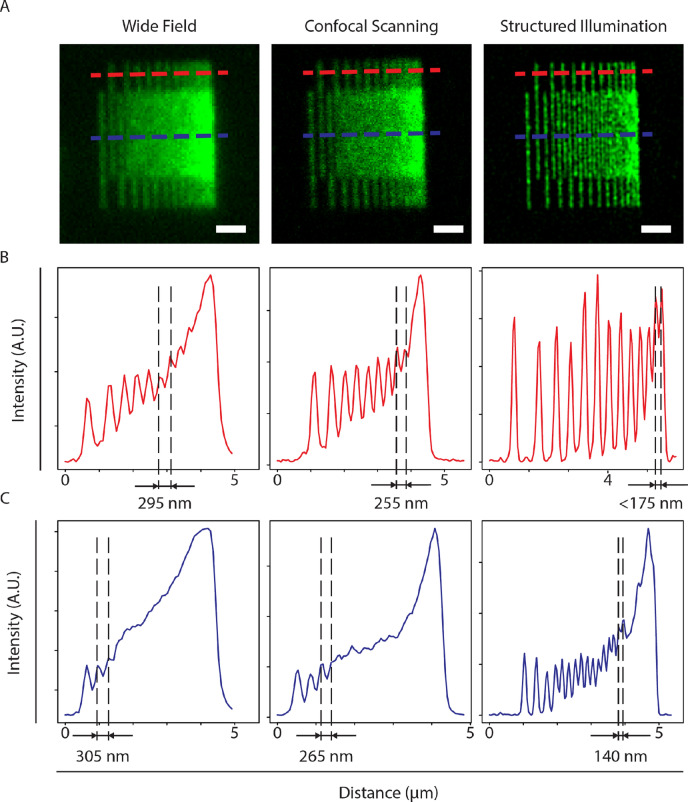
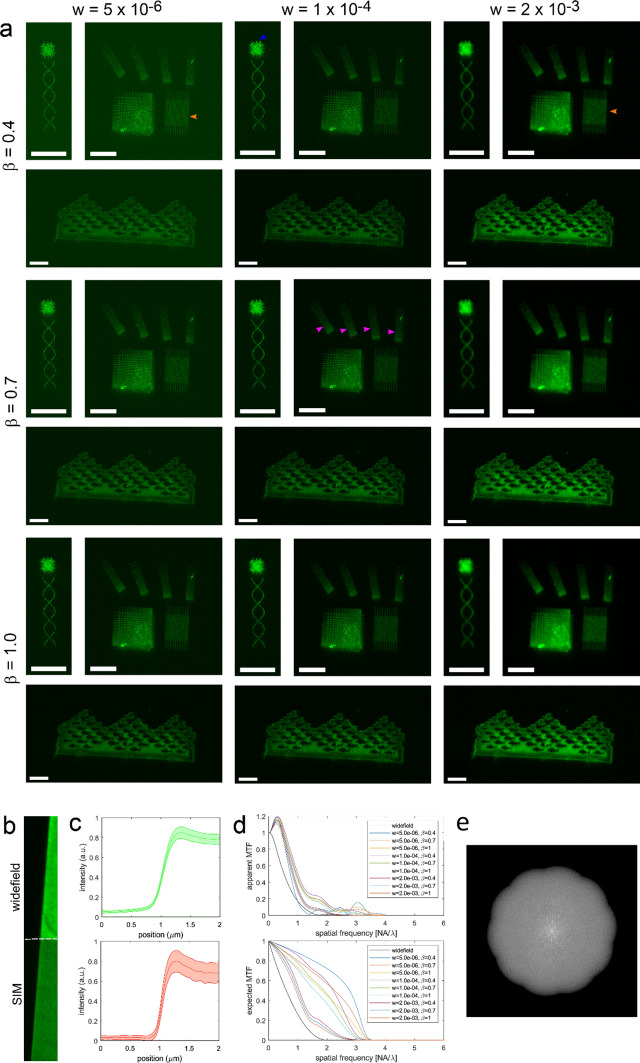
Super-resolution fluorescence microscopy can be achieved by image reconstruction after spatially patterned illumination or sequential photo-switching and read-out. Reconstruction algorithms and microscope performance are typically tested using simulated image data, due to a lack of strategies to pattern complex fluorescent patterns with nanoscale dimension control. Here, we report direct electron-beam patterning of fluorescence nanopatterns as calibration standards for super-resolution fluorescence. Patterned regions are identified with both electron microscopy and fluorescence labelling of choice, allowing precise correlation of predefined pattern dimensions, a posteriori obtained electron images, and reconstructed super-resolution images.


Conflict of interest statement

The authors declare no competing interests.

Figures

Figure 1
Figure 1
Electron-beam patterning and dimension control of fluorescent nanostructures for super-resolution calibration (a) Schematic illustration of the patterning procedure: (i) a scanning focused electron beam (depicted in blue) is used to create nanoscale patterns in a PEG monolayer on an ITO-coated glass slide, (ii) the patterned slides are incubated in a buffer solution containing IgG anti-body linked fluorescent molecules or quantum dot nanoparticles, (iii) slides are washed with buffer and deionised water to remove non-specifically bound antibodies before drying, and (iv) inspected with a fluorescence microscope. (b,c) In the electron microscope, after step (i), patterned areas are visible as dark contrasted regions allowing direct evaluation of the patterning procedure and the pattern dimensions. Variations in grayscale contrast in both square and line pattern are indicative of the stochastic variations in local electron dose. Red arrows indicate small defects (b) in the patterned area or (c) on the PEG layer that may compromise pattern or background fluorescence respectively. Scale bars are 1 µm.
Figure 2
Figure 2
Quantum dot labelling confirms a posteriori obtained pattern dimensions. (a) Electron microscopy image of single quantum dot wide lines showing the quantum dot binding locations coincide with the darker contrast observed from the patterned areas in secondary electron mode. Distribution of (b) quantum dots positions and (c) secondary electron contrast obtained by integration along the direction of the lines. We obtain a line width of 40 nm for the quantum dots positions which falls within the 69 nm linewidth obtained on the secondary electron contrast. Scale bar in (a) is 500 nm.
Figure 3
Figure 3
Fluorescent nanopatterns for super-resolution microscope calibration. (ac) Wide field fluorescence microscopy images of the collection of patterns written for assessing microscope performance, including (a) lines with from top to bottom decreasing line spacing under different orientation, a checkerboard pattern with in two dimensions decreasing line spacing, interdigitated lines with equal spacing, (b) interdigitated lines with from left to right decreasing spacing, a solid square with protruding small lines, a double helix, and (c) a nanoscale version of M.C. Escher’s Sky and Water I. Pattern positions on the microscope slide were recognized by sequences of larger arrays of solid fluorescent squares (not shown). (df) Structured illumination microscopy images of the patterns in (ac). The improvement in resolution is apparent from the various line patterns and the protruding lines in the small square, but also known reconstruction artefacts like enhanced noise appear for instance around the double helix structure. Red arrows point to small defects in the fluorescent patterns. Scale bars are 2 µm.
Figure 4
Figure 4
Fluorescent lines patterns confirm improved SIM resolution. (A) Wide field, confocal laser scanning, and structured illumination microscopy images of the interdigitated lines pattern with decreasing spacing. Intensity profiles recorded along the red and the blue dashed lines in (B) and (C) respectively. For all imaging modes, the intensity in between lines increases upon reaching the resolution limit. Dashed lines and numeric values indicate the smallest observed line spacing on all three images, in correspondence with the expected resolution improvement from WF to CLSM and SIM respectively. Sale bars in (A) are 1 µm.
Figure 5
Figure 5
Assessment of SIM processing parameters. (a) 2D-SIM reconstructions of three nano-patterned structures for different regularization parameters w and for different exponents β of the triangle apodization function. The fine grid (orange arrow) is resolved in SIM with low w, but not with (too) high w. The resolving power of SIM is isotropic, as can be seen from the just resolvable line spacing in the chirped grids with different orientations (pink arrows). For low w and for low β contrast is higher, but at the expense of reconstruction induced noise. For balanced conditions the small lines on the sides of the small square (blue arrow) can be clearly recognized, for too low w the lines cannot be clearly separated from the noise structure, for too high w the small lines cannot be seen as was the case for wide-field (cf. Fig. 3a). The reconstruction induced noise is also visible in the background for low w and low β, but not for high β. (b) Imaged edge and (c) edge response (average and standard deviation indicated) for wide field and SIM (w=1×10⁻⁴, β=0.7). (d) Apparent MTF derived from the edge response in (c), and expected MTF from reconstruction. The contrast and spatial frequency cut-off for SIM is improved compared to wide field. The reconstruction induced noise on the imaged plateau for low w makes the estimation of the MTF unreliable for this case. The overshoot at low spatial frequencies for SIM is probably due to a non-ideal underlying fluorescent edge object. A possible root cause is fluorescent material that accumulates close to edge. (e) Power spectral density on logarithmic scale for the Sky and Water I with w=1×10⁻⁴, β=0.7. The periodicity in the pattern clearly appears as peaks in the power spectral density. Comparative images for the other parameter settings can be found in the Supplemental Figure S3. Scale bars in (a) are 3 µm, in (b) 2 µm.

References

    1. Gustafsson MGL. Surpassing the lateral resolution limit by a factor of two using structured illumination microscopy. J. Microsc. 2000;198:82–87. doi: 10.1046/j.1365-2818.2000.00710.x. - DOI - PubMed
    1. Heintzmann R, Benedetti PA. High-resolution image reconstruction in fluorescence microscopy with patterned excitation. Appl. Opt. 2006;45(20):5037–5045. doi: 10.1364/AO.45.005037. - DOI - PubMed
    1. Righolt CH, Slotman JA, Young IT, Van Vliet LJ, Stallinga S. Image filtering in structured illumination microscopy using the Lukosz bound. Opt. Express. 2013;21(21):1599–1609. doi: 10.1364/OE.21.024431. - DOI - PubMed
    1. Chu K, et al. Image reconstruction for structured-illumination microscopy with low signal level. Opt. Express. 2014;22(7):807–812. doi: 10.1364/OE.22.008687. - DOI - PubMed
    1. Muller M, Monkemoller V, Hennig S, Hu W, Huser T. Open-source image reconstruction of super-resolution structured illumination microscopy data in ImageJ. Nat. Commun. 2016;7:1–6. doi: 10.1038/ncomms10980. - DOI - PMC - PubMed

Publication types