. 2022 Nov 23;6(1):88.
doi: 10.1038/s41698-022-00328-x.

MEK inhibitor resistance in lung adenocarcinoma is associated with addiction to sustained ERK suppression

Affiliations

MEK inhibitor resistance in lung adenocarcinoma is associated with addiction to sustained ERK suppression

Dylan A Farnsworth et al. NPJ Precis Oncol. .

Abstract

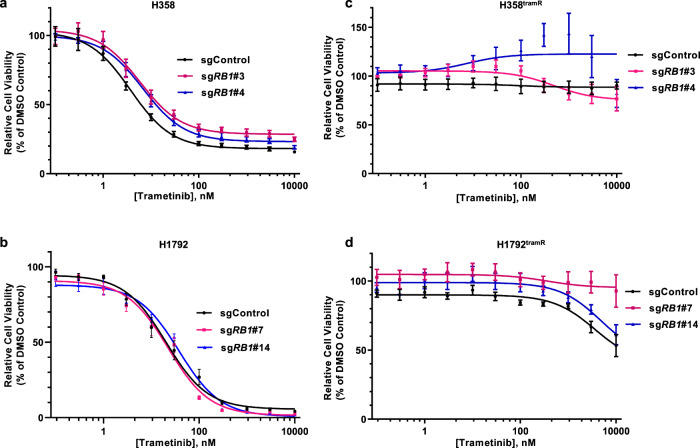
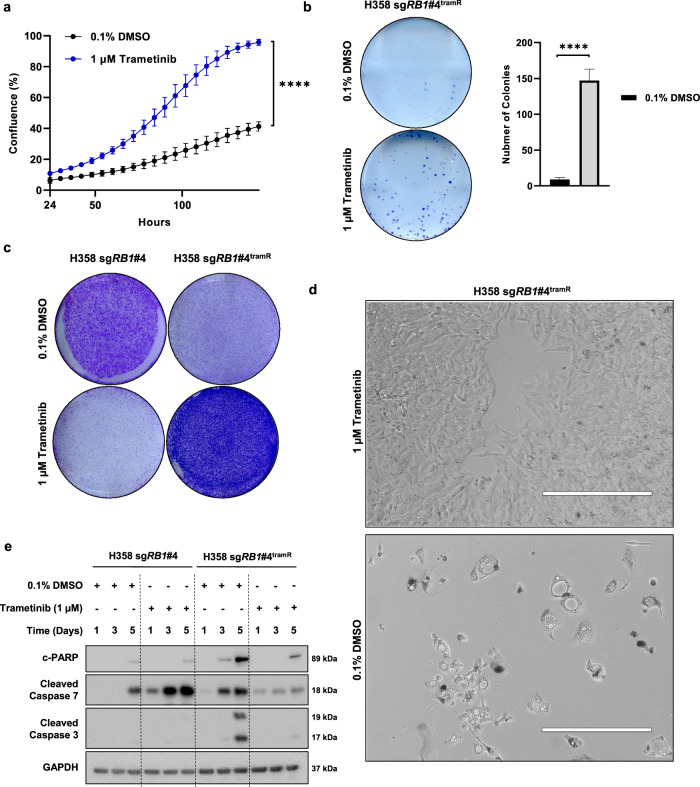
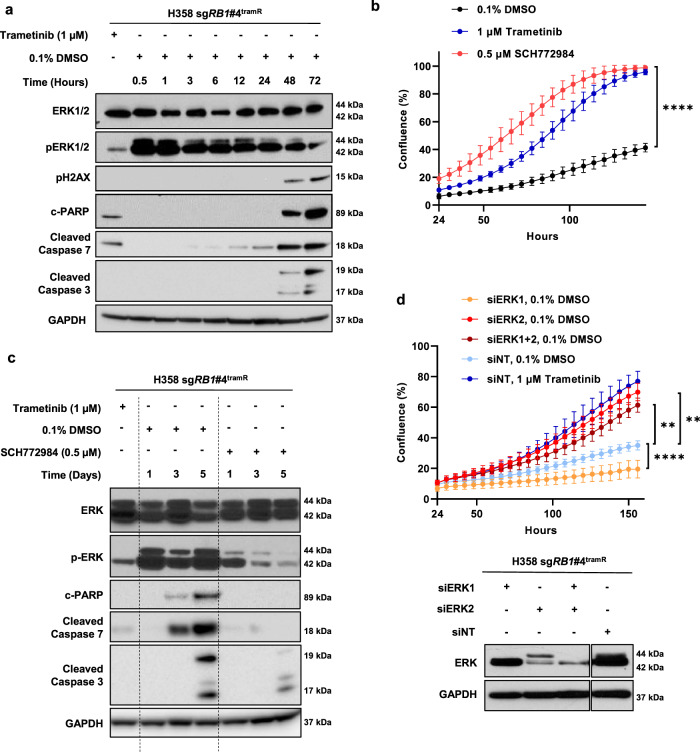
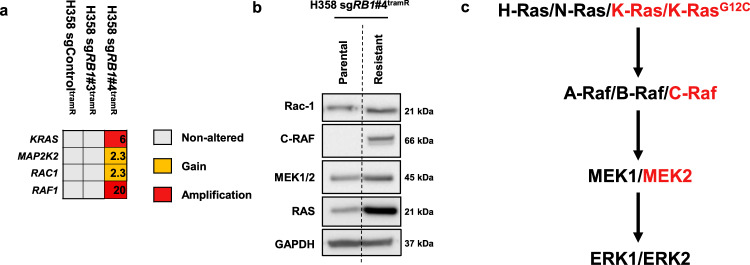
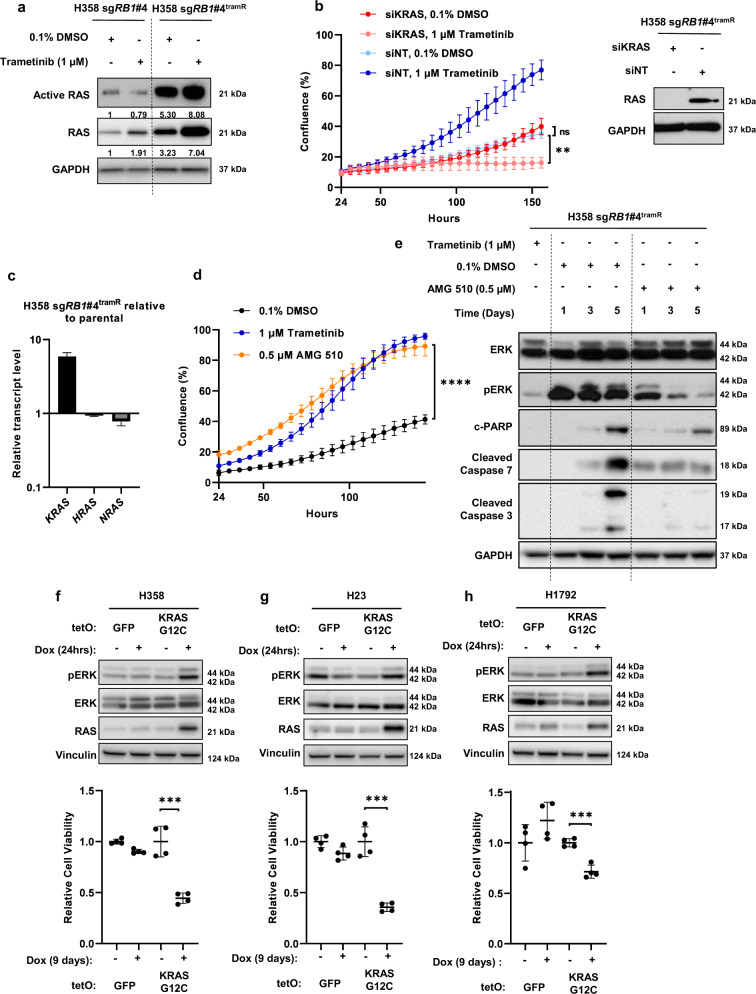
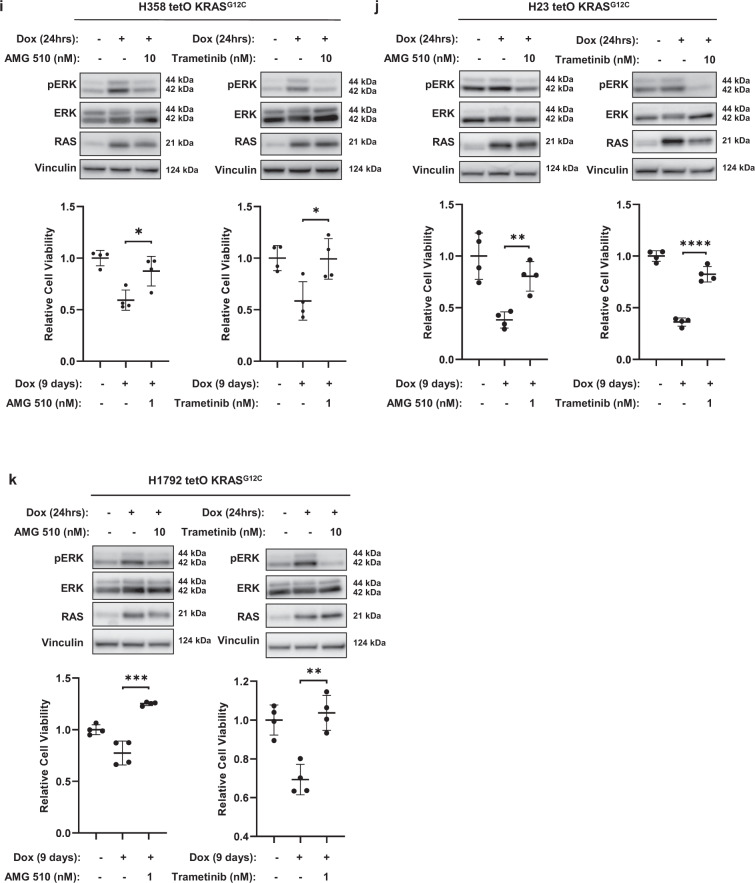
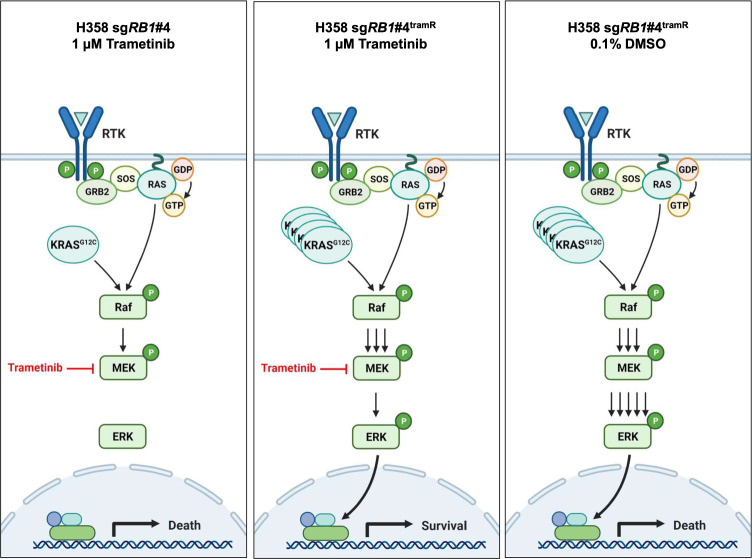
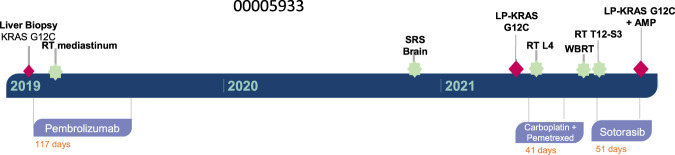
MEK inhibitors (MEKi) have limited efficacy in KRAS mutant lung adenocarcinoma (LUAD) patients, and this is attributed to both intrinsic and adaptive mechanisms of drug resistance. While many studies have focused on the former, there remains a dearth of data regarding acquired resistance to MEKi in LUAD. We established trametinib-resistant KRAS mutant LUAD cells through dose escalation and performed targeted MSK-IMPACT sequencing to identify drivers of MEKi resistance. Comparing resistant cells to their sensitive counterparts revealed alteration of genes associated with trametinib response. We describe a state of "drug addiction" in resistant cases where cells are dependent on continuous culture in trametinib for survival. We show that dependence on ERK2 suppression underlies this phenomenon and that trametinib removal hyperactivates ERK, resulting in ER stress and apoptosis. Amplification of KRASG12C occurs in drug-addicted cells and blocking mutant-specific activity with AMG 510 rescues the lethality associated with trametinib withdrawal. Furthermore, we show that increased KRASG12C expression is lethal to other KRAS mutant LUAD cells, consequential to ERK hyperactivation. Our study determines the drug-addicted phenotype in lung cancer is associated with KRAS amplification and demonstrates that toxic acquired genetic changes can develop de novo in the background of MAPK suppression with MEK inhibitors. We suggest that the presence of mutant KRAS amplification in patients may identify those that may benefit from a "drug holiday" to circumvent drug resistance. These findings demonstrate the toxic potential of hyperactive ERK signaling and highlight potential therapeutic opportunities in patients bearing KRAS mutations.


Conflict of interest statement

A.M.U. and W.W.L. are scientific advisors for Hyperbio Therapeutics. Marc Ladanyi has received advisory board compensation from Merck, Bristol-Myers Squibb, Takeda, Bayer, Lilly Oncology, Janssen, and Paige.AI. Research grants unrelated to the current study was obtained from Hesinn Heathcare, Merus, LOXO Oncology and Elevation Oncology Inc. Romel Somwar has received research grants, unrelated to the current study, from Merus, LOXO Oncology and Elevation Oncology Inc. and Helsinn.

Figures

Fig. 1
Fig. 1. Impact of RB1 on trametinib resistance.
a, b Isogenic H358 and H1972 clones with RB knockout were grown in the indicated concentrations of trametinib (1 nM to 10 µM) for 3 days. Cell viability was assayed with alamarBlue and relative viability was calculated as a percent of the 0.1% DMSO-treated control. Error bars are SEM from three independent experiments. c, d Resistant RB knockout and control H358 and H1792 clones were grown in the indicated concentrations of trametinib (1 nM to 10 µM) for 3 days. Cell viability was assayed with alamarBlue and viability was calculated relative to 0.1% DMSO vehicle control. Error bars are SEM from three independent experiments.
Fig. 2
Fig. 2. H358 sgRB1#4tramR cells are addicted to trametinib.
a H358 sgRB1#4tramR grow slower in 0.1% DMSO then in 1 µM trametinib as measured by IncuCyte S3 live-cell imaging system. Error bars represent SD from four independent experiments. P value from extra sum-of-squares F test on calculated logistic growth rate are indicated. ****p < 0.0001. b Clonogenic growth assay performed on H358 sgRB1#4tramR grown in 0.1% DMSO or 1 µM trametinib. Cells were fixed and stained with crystal violet following 14-day treatment under the indicated conditions. Representative images from four independent replicates. Error bars represent SD from four independent experiments. Colonies were quantified using Fiji. P value from Student’s t test on colony number shown, ****p < 0.0001. c H358 sgRB1#4tramR cells were grown in either 0.1% DMSO or 1 µM trametinib for 7 days, then stained with crystal violet. H358 sgRB1#4tramR can proliferate better in 1 µM trametinib than in 0.1% DMSO vehicle, the opposite of what is seen in their parental counterparts. d ×10 microscope images were taken after 11 days. Vacuoles form in H358 sgRB1#4tramR cells when grown without trametinib. Scale bar shown represents 400 µm. e H358 sgRB1#4 parental and resistant cells were grown in either 0.1% DMSO or 1 µM trametinib and harvested after 1, 3 or 5 days. Lysates were subjected to immunoblotting for the indicated proteins. H358 sgRB1#4tramR cells display upregulation of apoptosis markers when grown without trametinib.
Fig. 3
Fig. 3. ERK2 hyperactivation mediates trametinib addiction.
a H358 sgRB1#4tramR were treated with 0.1% DMSO or 1 µM trametinib, harvested after the indicated time periods, and immunoblotted for the proteins shown. Starting at 30 minutes after drug removal, and persisting past 72 hours, there is a strong pERK rebound, as well as induction of markers of apoptosis and DNA damage. b H358 sgRB1#4tramR cells were seeded in the indicated concentrations. Inhibition of ERK with 0.5 µM SCH772984 rescues H358 sgRB1#4tramR cell growth after trametinib removal, as measured by IncuCyte S3 live-cell imaging system. Error bars represent SD from four independent replicates. P value from extra sum-of-squares F test on calculated logistic growth rate is indicated. ****P < 0.0001. c H358 sgRB1#4tramR cells were treated with indicated drug concentrations for indicated time, harvested, lysed, and immunoblotted. Treatment with 0.5 µM SCH772984 rescues induction of pERK and apoptosis markers. d siRNA targeting ERK1 and/or ERK2 were transfected into H358 sgRB1#4tramR. Knockdown of ERK2 alone, or ERK1 and ERK2, rescues cells from death after trametinib removal. Knockdown of ERK1 alone further inhibits cell growth following trametinib removal. Confluence was measured by IncuCyte S3 live-cell imaging system. Error bars represent SEM from four independent experiments. P values from Student’s t test on confluence at endpoint growth rate are indicated. **p < 0.01, ****p < 0.0001.
Fig. 4
Fig. 4. MAPK pathway components are amplified in H358 sgRB1#4tramR.
a MSK-IMPACT profiling reveals RAC1, RAF1, MAP2K2, and KRAS copy number gains and amplifications. Alteration status for each gene is indicated by color for each cell line b H358 sgRB1#4 parental and resistant cells were cultured in 0.1% DMSO or 1 µM trametinib respectively, harvested, and immunoblotted for the indicated proteins. Genes that were amplified in a were validated at the protein level. c Proteins are amplified at three different nodes above ERK1/2 in the MAPK pathway.
Fig. 5
Fig. 5. Mutant KRAS amplification drives hyperactivation of ERK and drug addiction following trametinib removal.
a Active GTP-bound RAS was isolated by affinity purification. H358 sgRB1#4tramR cells have much higher levels of active RAS compared to their parental counterparts. Protein levels were quantified by densitometry using FIJI. Normalized active and total RAS levels relative to H358 sgRB1#4 parental treated with 0.1% DMSO are shown. b KRAS knockdown by siRNAs does not rescue drug addiction in H358 sgRB1#4tramR, as measured by IncuCyte S3 live-cell imaging system. The loading control used for this figure (GAPDH) is the same as the one used in Fig. 3d. Error bars are SEM from four independent experiments. p value from Student’s t test on confluence at endpoint growth rate are indicated. NS = not significant. c KRAS RNA levels are increased in H358 sgRB1#4tramR cells compared to parental counterparts. Error bars represent SEM from three technical replicates. d Inhibition of KRASG12C with 0.5 µM AMG 510 rescues H358 sgRB1#4tramR cell growth after removal trametinib, as measured by IncuCyte S3 live-cell imaging system. Error bars represent SD from four independent experiments. P value from extra sum-of-squares F test on calculated logistic growth rate is indicated. ****P < 0.0001. e Treatment with 0.5 µM AMG 510 partially rescues induction of pERK and apoptosis markers in H358 sgRB1#4tramR. fh H358, H23, and H1792 were engineered to stably express KRASG12C under the control of a doxycycline inducible as described in the methods. GFP or KRASG12C expression was induced by adding 200 ng/mL doxycycline to the media for the indicated amounts of time. Induction of KRASG12C after 24 h leads to increases in pERK levels. Cell viability measured by adding alamarBlue after 9-day treatment with doxycycline, calculated relative to no doxycycline control. Induction of KRASG12C over 9 days reduces cell viability in the 3 cell lines compared to the no doxycycline control. Error bars represent SD from four independent experiments. ik Inhibition of MEK or KRASG12C specifically with 10 nM trametinib or 10 nM AMG 510 partially rescues pERK by KRASG12C after 24 h. After 9 days, treatment with 1 nM trametinib or 1 nM AMG 510 also partially rescues loss of cell viability driven by induction of KRASG12C, as measured by alamarBlue. The error bars represent SD from four independent experiments. P values from Student’s t test are indicated. *p < 0.05, **p < 0.01, ***p < 0.001, ****p < 0.0001, NS = not significant.
Fig. 6
Fig. 6. Mutant KRAS amplification is associated with resistance and dependence to trametinib.
Parental H358 cells are sensitive to trametinib. In H358 sgRB1#4tramR cells, KRASG12C amplification is associated with resistance to trametinib. In these same cells, when trametinib is removed, KRASG12C amplification drives ERK hyperactivation and cell death. Figure made with BioRender, adapted from “RAS Pathway”, by BioRender.com (2021). Retrieved from https://app.biorender.com/biorender-templates.
Fig. 7
Fig. 7. KRASG12C amplification in a lung adenocarcinoma patient following sotorasib treatment.
A 67-year-old female former smoker (25 pack year history) presented with a 3-month history of chronic dry cough. A chest CT scan revealed a 1.7 cm right upper lobe lobulated nodule and bilateral lung nodules with accompanying diffuse infiltration of the surrounding mediastinal soft tissue. Subsequent imaging including a PET scan and brain MRI showed liver and nodal metastases and multiple subcentimeter enhancing brain metastases. The patient underwent a liver biopsy which revealed high-grade lung adenocarcinoma with a PD-L1 staining of 75%. MSK IMPACT of the liver tumor revealed a KRASG12C mutation. Patient initiated treatment on pembrolizumab monotherapy and received palliative radiation therapy to the mediastinum. Patient experienced strong radiographic response to pembrolizumab. Patient underwent stereotactic radiosurgery for a frontal lobe brain metastasis. Pembrolizumab was held due to pneumonitis and the patient continued on observation for 21 months. An MRI of the spine showed L4 vertebral body metastasis with epidural and possible leptomeningeal disease, which was confirmed by a lumbar puncture. MSK IMPACT once again showed a KRASG12C mutation. The patient underwent radiation therapy to the L4 metastasis and started systemic therapy with carboplatin and pemetrexed with radiographic response, but persistent leptomenigeal disease. She underwent radiation therapy to T12-S3 spinal metastases and whole brain radiation. She them commenced therapy with sotorasib with minimal response. IMPACT of a CSF sample taken 2.5 months into treatment with sotorasib once again showed the KRASG12C mutation and a new KRAS amplification. The patient died of disease progression 3.5 weeks later.

References

    1. Collisson EA, et al. Comprehensive molecular profiling of lung adenocarcinoma: the cancer genome atlas research network. Nature. 2014;511:543–550. doi: 10.1038/nature13385. - DOI - PMC - PubMed
    1. Skoulidis F, Heymach JV. Co-occurring genomic alterations in non-small-cell lung cancer biology and therapy. Nat. Rev. Cancer. 2019;19:495–509. doi: 10.1038/s41568-019-0179-8. - DOI - PMC - PubMed
    1. Kris MG, et al. Using multiplexed assays of oncogenic drivers in lung cancers to select targeted drugs. J. Am. Med. Assoc. 2014;311:1998–2006. doi: 10.1001/jama.2014.3741. - DOI - PMC - PubMed
    1. Soria J-C, et al. Osimertinib in untreated EGFR -mutated advanced non–small-cell lung cancer. N. Engl. J. Med. 2017;378:113–125. doi: 10.1056/NEJMoa1713137. - DOI - PubMed
    1. Shaw AT, et al. Crizotinib versus chemotherapy in advanced ALK -positive lung cancer. N. Engl. J. Med. 2013;368:2385–2394. doi: 10.1056/NEJMoa1214886. - DOI - PubMed